
Abstract
Based on previous research, there are differences between eye movements of people with attention-deficit hyperactivity disorder (ADHD) and of healthy people, as a result, the existence of differences regarding the electrooculogram (EOG) signals of the 2 groups exists. Thus, this study aimed to examine the recorded EOG signals of 30 ADHD children and 30 healthy children while performing an attention-related task. For this purpose, the EOG signals of these 2 groups were decomposed utilizing various wavelet functions. Afterward, features, including mean, energy, and standard deviation (SD) of approximation and detail wavelet coefficients were calculated. The Davies–Bouldin (DB) index was used for the evaluation of the feature space quality. Finally, the 2 groups were classified using one-dimensional feature vector and support vector machine (SVM). The SD of detail coefficients (db4) was selected as the most effective feature for separating the 2 groups. Statistical analysis revealed that the values of energy and SD of EOG signals’ detail coefficients were significantly lower in the ADHD group in comparison with the healthy group (P<.001). These results showed that the speed of the ADHD group's eye movements was slower due to the fact that the high-frequency band activity of EOG signals in the healthy group was higher. In addition, the EOG signals were classified with a detection accuracy of 83.42 ± 3.8%. The results of this study can be applied in designing an EOG biofeedback protocol to treat or mitigate the symptoms of ADHD patients.
Introduction
Attention-deficit hyperactivity disorder (ADHD) is the very epitome of prevalent neurodevelopmental disorders among children, 1 mainly identified by symptoms such as lack of attention, excessive motor activity, and impulsivity. 2 This disorder comes in 3 types, including ADHD-I (people with attention deprivation), ADHD-HI (people showing impulsive behaviors), and ADHD-C (a combination of the first and second types). 3 Since ADHD affects 2.5% of adults and 5% of children, it is deemed to be acute.4,5 This disorder is accompanied by various problems in different areas in childhood ranging from social domains to cognitive fields 6 and it can continue into adulthood, contributing to diverse dilemmas among which addiction to drugs, criminality, and occupational problems are 3 of the gravest.7–9 Only when ADHD disorder is diagnosed early can some of these complications be ameliorated or unraveled; as a result, timely diagnosis of ADHD is crucial of importance. 10 For this purpose, various versions of ADHD criteria published in the Diagnostic and Statistical Manual of Mental Disorders (DSM-IV) by the American Psychiatric Association (APA) are used. 2 This method for diagnosis of ADHD is not reliable due to the fact that the results of such clinical interviews are dependent on individuals’ honesty and perception of psychologists’ questions,11,12 accordingly, several studies have looked for other diagnostic methods. Groups of researchers have investigated the differences between electroencephalogram (EEG) signals of normal individuals and people with ADHD,13–19 with regards to the differences associated with the EEG signals of ADHD group and healthy group, neurofeedback training has been incorporated into treating ADHD as a nonpharmaceutical therapeutic method.16,20–23 Neurofeedback training helps individuals with ADHD modify their brain activity based on a computer game or auditory feedback while their EEG signals are recorded to maintain their EEG signal features within normal range.16,24,25 Likewise, some studies have revealed the effectiveness of using EMG biofeedback alone or alongside neurofeedback in curing ADHD.26,27
In the meantime, having found that the amount of attention affects eye movements, some studies evaluated the eye movements of ADHD people and healthy people using eye-tracking systems. For example, studies have indicated that ADHD individuals encounter difficulties in suppressing unwanted saccades 28 and the rate of their micro-saccades is higher in comparison with healthy individuals. 29 Moreover, people with ADHD were recognized with weaker binocular coordination. 30 In another research, saccade latency and accuracy in ADHD children and healthy children were examined using an anti-saccade task, and children with ADHD showed higher numbers of errors and shorter latency. 31 Supplementary to this, the modulation in the angle of vergence was defined as a biomarker to classify ADHD people from non-ADHD using machine learning methods32,33 since healthy individuals showed stronger eye vergence responses.34,35 Another study based on evaluating visual search patterns and change detection performance indicated that children with ADHD had poorer performance in change detection and they had difficulty in sustaining their fixations. 36 Furthermore, ADHD group and healthy group were significantly different in the time spent fixating on the target and distractor and the number of fixations on them. 37 In a study on the classification of ADHD adults and non-ADHD ones, fixations, saccades, and pupil diameters were classified utilizing the decision-tree algorithm. 38 Based on these differences regarding the eye movements of ADHD individuals and normal people, in some studies, eye-tracking training has been utilized to boost ADHD children's eye movements problems.39,40
Additionally, studies have been conducted using electrooculogram (EOG) signal processing to evaluate the differences between the eye movements of these 2 groups.41–46 For example, the poor ability of people with ADHD to suppress rapid and unwanted eye movements has also been concluded by examining the EOG signal. 41 A case in point can be seen in a study in which horizontal and vertical EOG signals were examined while following the test image, revealing a healthy group's better performance. 42 Furthermore, Sho’ouri classified EOG signals of children with ADHD and healthy ones with a detection accuracy of 72.22% ± 2.8%; she found the scaling exponent of EOG signals in ADHD children was significantly higher. 45 The EOG signals of the 2 groups were also classified with a detection accuracy of 84.6% ± 4.4% using 2 features of approximate entropy and Petrosian's fractal dimension and a support vector machine (SVM) classifier. In another research, differences between EOG signals of ADHD children and healthy ones were investigated. It has been shown that the values of low-frequency (0.5-4.125 Hz) band power, fractal dimension and entropy were significantly lower in the EOG signals of the ADHD children, compared to the healthy ones (P < .001). But, the scaling exponent values of EOG signals were significantly increased in ADHD children, compared to healthy ones. Further, an EOG biofeedback protocol was proposed, encouraging ADHD patients to increase the amount of the entropy and fractal dimensions of their EOG signals. 44
EOG signal processing for examining eye movements of ADHD individuals and healthy ones is of benefit because the EOG record is cheaper and simpler compared to eye-tracking systems. In addition to this, EOG biofeedback is likely to be effective in treating or alleviating ADHD symptoms, as a result, the most effective features in discriminating the 2 groups should be determined. On another note, wavelet transform (WT) has been efficient in various fields such as detecting and classifying brain disorders (e.g., epilepsy and autism).47–51 Moreover, WT has been commonly utilized for EOG signal processing in designing BCI systems52,53 Hence, there is the feasibility of its being practical in detecting ADHD and designing an EOG biofeedback protocol for curing ADHD. However, there is a lack of sufficient studies on using WT for EOG signal processing of ADHD group and non-ADHD group. Using this tool poses some important questions. For instance, which wavelet function would be more effective in discriminating the EOG signals of these 2 groups? Which features are better to be extracted from wavelet coefficients? These are the most prominent questions.
The present study has focused on finding the answers to the proposed questions. Therefore, in this study, 3 features, including mean, standard deviation (SD), and energy are extracted. Then, different wavelet families will be investigated to determine the best wavelet function in distinguishing the EOG signals of the 2 groups. Following this, the most effective feature and the best level of decomposition will be resolved by monitoring the differences between the approximate and detail coefficients, and the 2 groups will be classified. Ultimately, it will be found out whether WT is an appropriate tool for separating the EOG signals of ADHD and healthy groups or not.
Method
Database
Participants
In this research, the database related to Mohammadi et al.'s 15 research was utilized. The database contains EEG and EOG signals of 30 ADHD children (22 boys and 8 girls, with mean age of 9.62 ± 1.75 years), who were diagnosed utilizing the DSM-IV criteria, and of 30 healthy children (25 boys and 5 girls, with mean age of 9.85 ± 1.77 years). 25, 2, and 3 of the children with ADHD had ADHD-C, ADHD-HI, and ADHD-I, respectively. All of the participants had no history of other neurological disorders, brain injuries (e.g., epilepsy), learning disabilities, and utilization of drugs such as barbiturate and benzodiazepine. Children above the moderate level in the Raven Progressive Matrix Test were chosen to participate in the research.
Signal Recording Procedure
The EOG and EEG signals of participants were recorded in the Psychology and Psychiatry Research Center at Roozbeh hospital, Tehran University of Medical Sciences (TUMS), using the SD-C24 device. For recording EEG signals of participants, EEG electrodes were placed according to the 10-20 International Standard System, and A1 and A2 electrodes on the earlobes were references. Eye movement was also recorded using 2 electrodes located below and above the right eye (see Figure 1.). The sampling frequency was adjusted to 128 Hz and the recorded signals were filtered through a band-pass filter with cut-off frequencies at 0.5 and 30 Hz. The test was performed in a protected room. Children were asked to prevent extra movements to curtail artifacts. 15
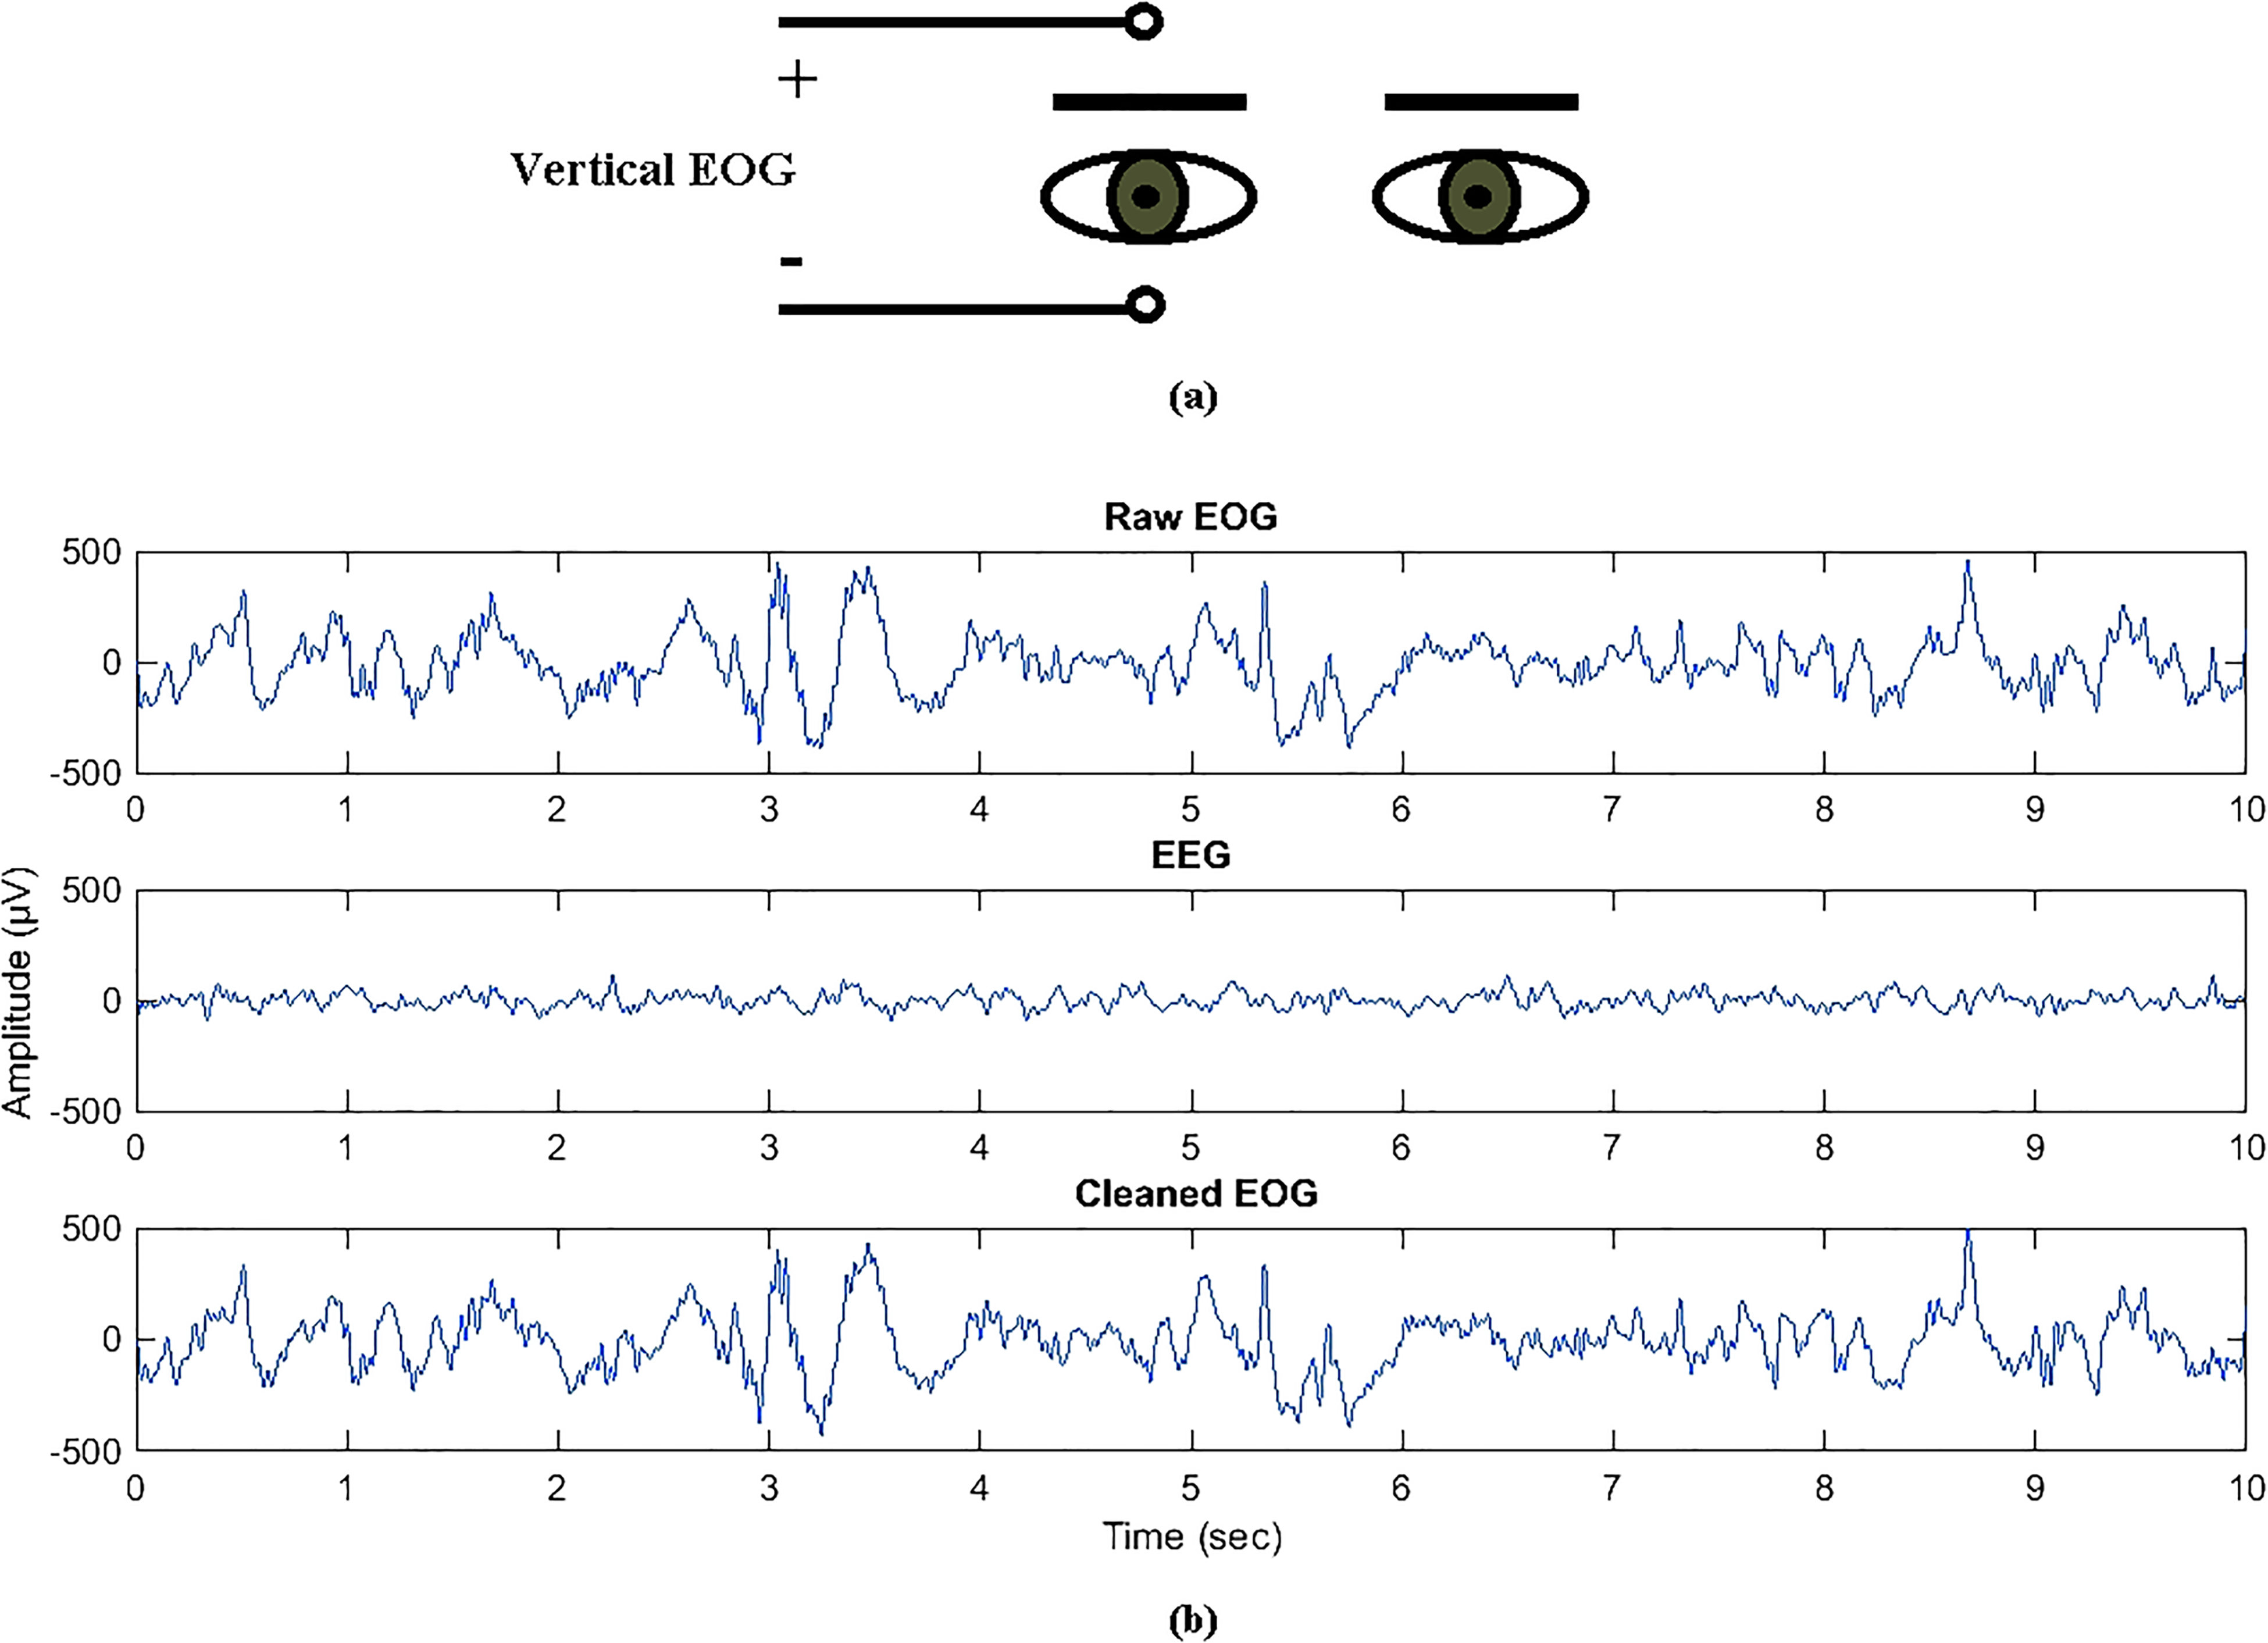
(a) Electrode placement for vertical electrooculogram (EOG) acquisition and (b) A sample of raw EOG, brain activity recorded by the EOG channel, and the cleaned EOG for a healthy child.
Experiment
17 pictures, containing 5 to 16 shapes of cartoon characters or animals, were displayed for each child. These shapes were arranged in 3 rows in each picture. Children were required to count the shapes in the top row, the middle row, and the bottom row, respectively. Eventually, they had to announce the total number. After the child's response, the next picture was shown. During this process, the EOG and EEG signals of participants were recorded. 15 The recording time depended on the children's response speed. The recording time of EOG and EEG signals in healthy children (78.69 ± 18.12 s) was significantly lower than that of children with ADHD (114.03 ± 50.04 s) (P < .01).
Data Preprocessing
Parts of the recorded EOG signals with large artifacts e.g., eye blinking) were omitted by examining the signals visually. The remaining EOG signals were defined as raw EOG. Being close to the frontal lobe, the 2 electrodes above and below the right eye record the subject's brain activity with EOG signal simultaneously. Thus, the matrix containing the 21-channel EEG and EOG signals of each child was decomposed into independent components through Independent Component Analysis (ICA) method with the aim of eliminating the EEG signal effect from the EOG signal and watching the net impact of the EOG signal on separating these 2 groups. Then, the components with the impact of artifacts (e.g., eye movement and muscle movement) were removed, and afterward the signals were reconstructed again. Whatever remained in each channel after reconstruction of signals was associated with the brain activity of that area, so what was reconstructed in the EOG channel was the EEG signal recorded by the EOG channel. This EEG component, therefore, was subtracted from the raw EOG to acquire a net EOG signal called cleaned EOG. The cleaned EOG was divided into fragments of 20 s length. Figure 1 presents a sample of raw EOG, brain activity recorded by the EOG channel, and the cleaned EOG for a healthy child. 54
Calculation of the Extracted Features From Wavelet Transform
WT, proposed by Mallet in 1989, is a linear function decomposing a signal into various frequency sub-bands with appropriate localization in both time and frequency domains. This transform is implemented through a high-pass FIR filter and a low-pass FIR filter, producing detail and approximation coefficients, respectively (see Figure 2).49,55
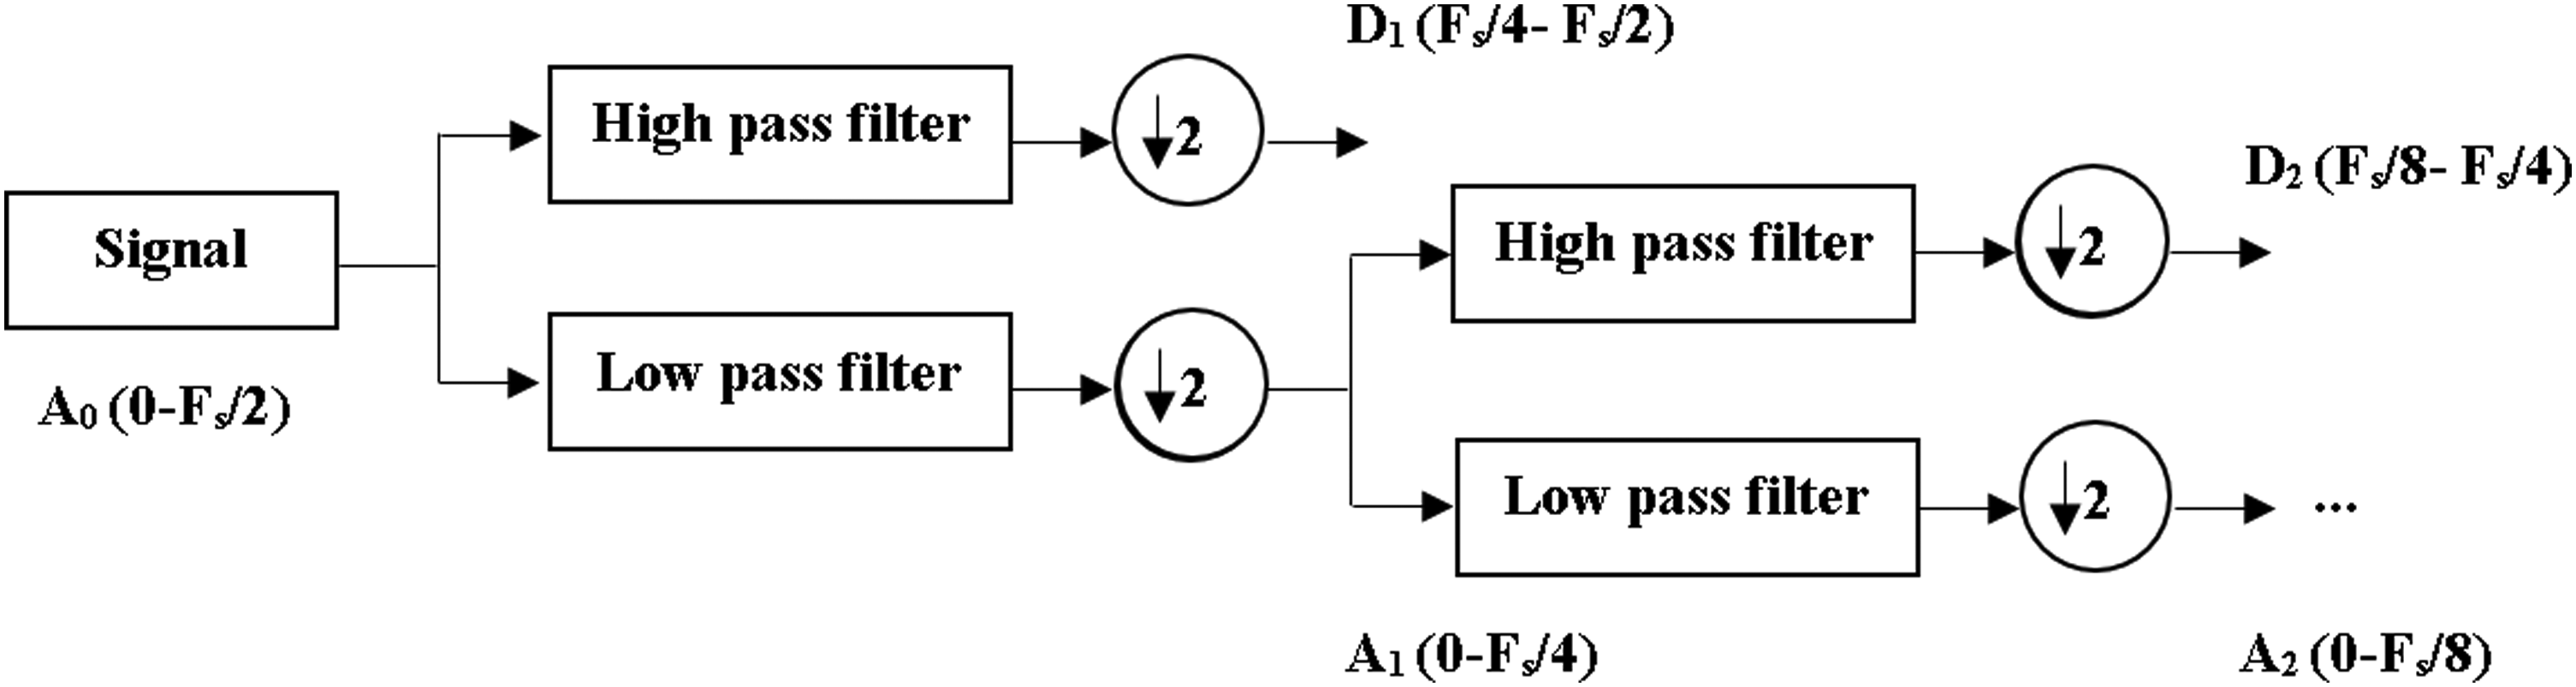
Wavelet decomposition tree. Abbreviations: Fs: sampling frequency.
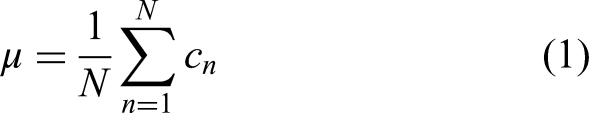
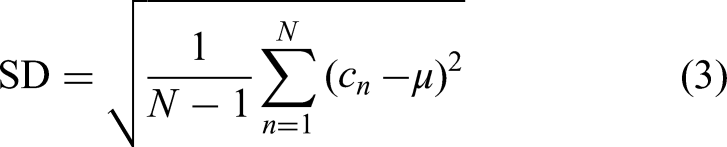
Approximation and detail wavelet coefficients parameters such as energy, mean and SD were calculated as the features for discriminating the ADHD group from the healthy group. The mean (µ) of wavelet coefficients (c) was calculated as follows:
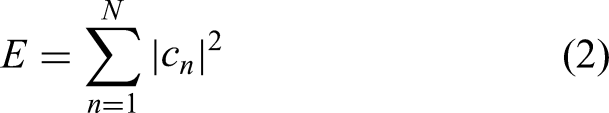
The energy (E) of wavelet coefficients was obtained as the following equation:
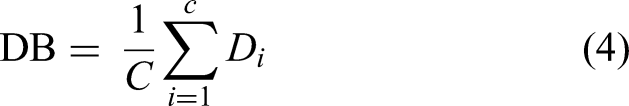
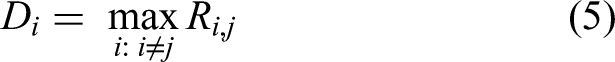
Davies–Bouldin Index to Evaluate the Quality of Features’ Space
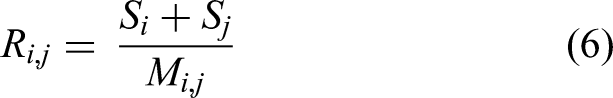
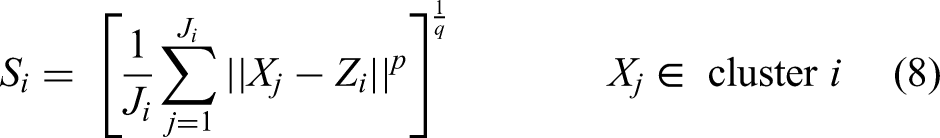
Davies–Bouldin (DB) index is a metric for assessing the discrimination of clusters. In other words, this index evaluates the similarity among clusters. The lower value of this index represents the higher separability among the clusters. DB index is calculated using scattering matrices of clusters.
56
The DB calculation procedure is described as follows:

Statistical Analysis
Kolmogrov–Smirnov test was applied to compare the values of obtained features to a standard normal distribution. Since the distribution of all extracted features was non-normal, Mann–Whitney U test was used to assess the differences between the 2 groups.
The SVM Classifier to Classify the EOG Signals of the 2 Groups
SVM as a type of statistical learning theory was proposed by Vapnik, and advanced in the 1990s. 57 SVM classifier is deemed to be a binary classification approach in which a hyperplane line is constructed for separating positive and negative classes. This line can be produced in different ways, but the optimal separating hyperplane is the line with the maximum margin, the distance between hyperplane and the 2 classes.58,59
Results
Determining the Best Wavelet for Discriminating the 2 Groups
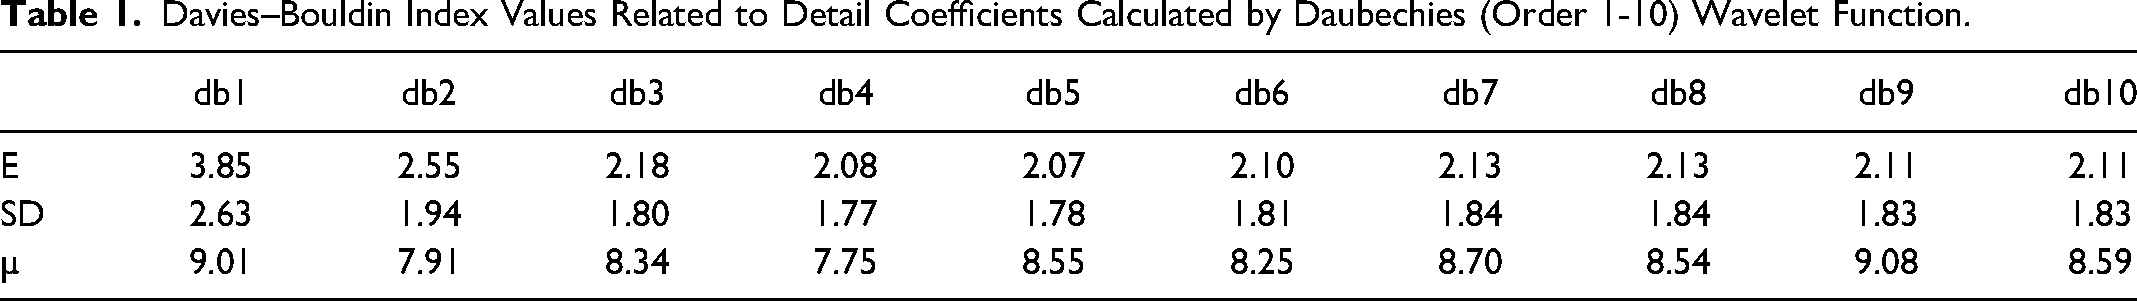
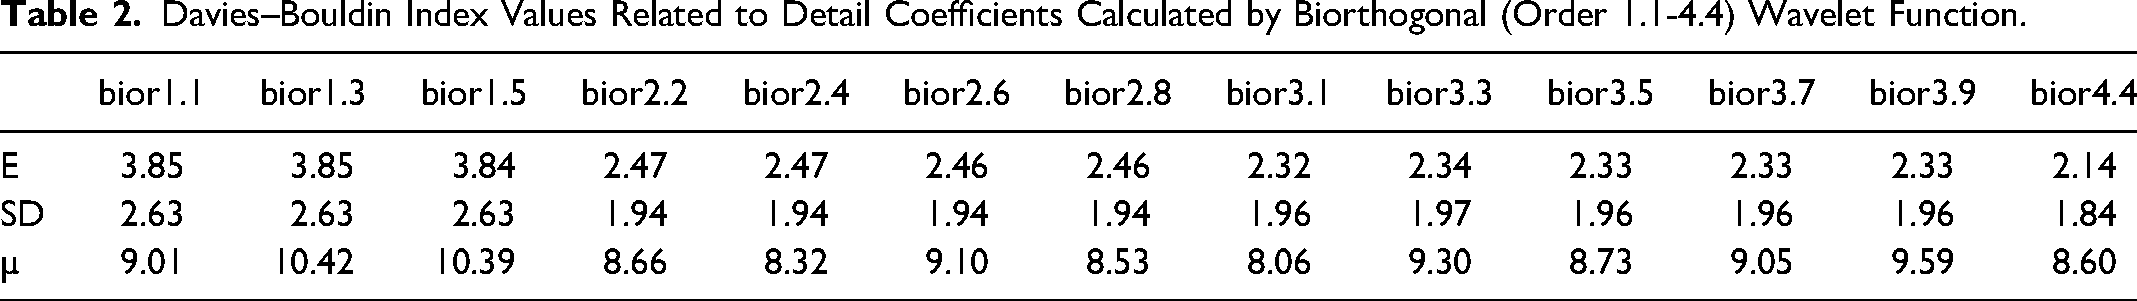
The decomposition level was fixed at the first level to evaluate the role of the various wavelet functions in separating the 2 groups. The EOG signals were decomposed by the wavelet functions such as Daubechies (order 1-10), Coiflets (order 1-5), biorthogonal (order 1.1-4.4), and Symlets (order 2-8) up to the first level. DBI values were calculated for detail coefficients of the first level. The results can be seen in Tables 1, 2, and 3.
Davies–Bouldin Index Values Related to Detail Coefficients Calculated by Daubechies (Order 1-10) Wavelet Function.
Davies–Bouldin Index Values Related to Detail Coefficients Calculated by Biorthogonal (Order 1.1-4.4) Wavelet Function.
Davies-Bouldin Index Values Related to Detail Coefficients Calculated by Coiflets (Order 1-5) and Symlets (Order 2-8) Wavelet Functions.
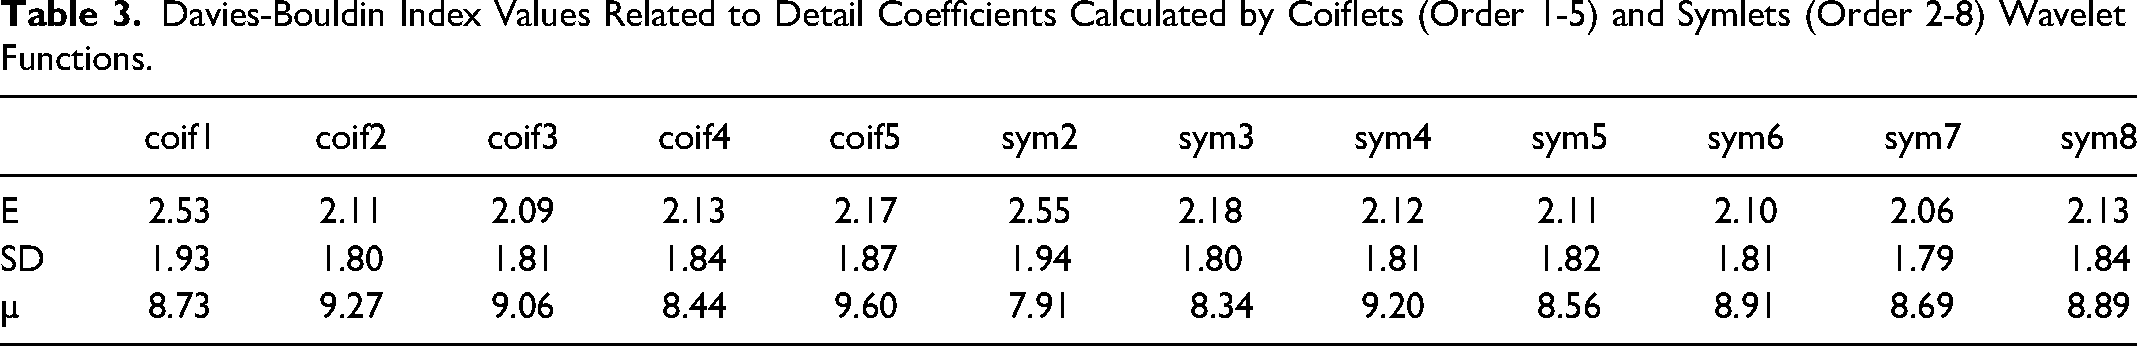
It is clear that the detail coefficients of the first level of decomposition, calculated by db4 wavelet function, have the lowest values of the DB index. Thus, db4 would be the chosen wavelet function for distinguishing these 2 groups.
Selecting the Best Level of Decomposition and Feature
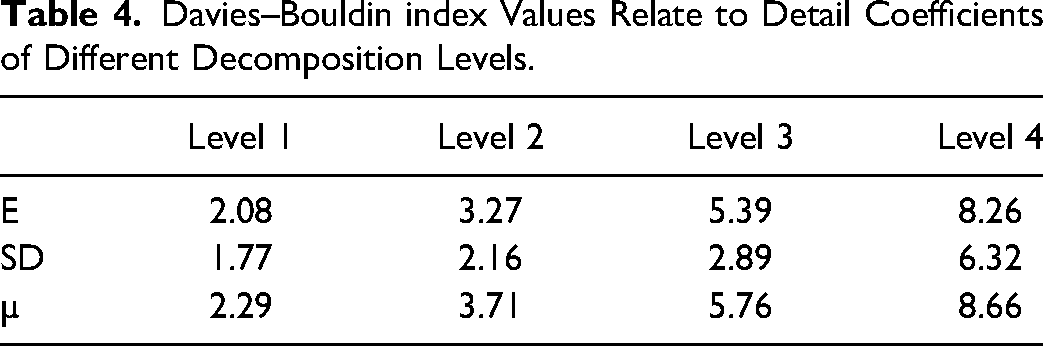
The EOG signals were decomposed using db4 up to 4 levels. For observing the role of decomposition level in separating the 2 groups, the wavelet type was fixed and the level of decomposition was varied. In Table 4, the DB index values of detail coefficients for 4 levels of decomposition is presented. It can be seen that the first level of decomposition has the lowest values of DB index; as a result, this level would be the best level for discriminating the EOG signals of the 2 groups. In addition, the SD of detail coefficients of the EOG signals in the first level of decomposition could be used as the most effective features for classifying the EOG signals of the 2 groups.
Davies–Bouldin index Values Relate to Detail Coefficients of Different Decomposition Levels.
Statistical Analysis of Extracted Features From the EOG Signals
The SD, energy, and mean of the wavelet coefficients (db4) for cleaned EOG signals were calculated. It was revealed that the mean value of the SD and energy of detail coefficients at various levels of decomposition were significantly higher in the healthy group (P < .001). Nevertheless, in terms of approximation coefficients, there was no significant difference between the mean value of SD and energy of the 2 groups. 43 Figures 3 and 4 show the mean value of the SD and energy of detail and approximation coefficients for cleaned EOG signals in ADHD and healthy groups, respectively. The cleaned EOG signals of ADHD children and healthy children, on the contrary, were not significantly different regarding the mean value of mean of detail and approximation coefficients. Therefore, the energy and SD of the EOG signals could be used as the most effective features for classifying the EOG signals of the 2 groups. In the current study, the SD was selected for classification.
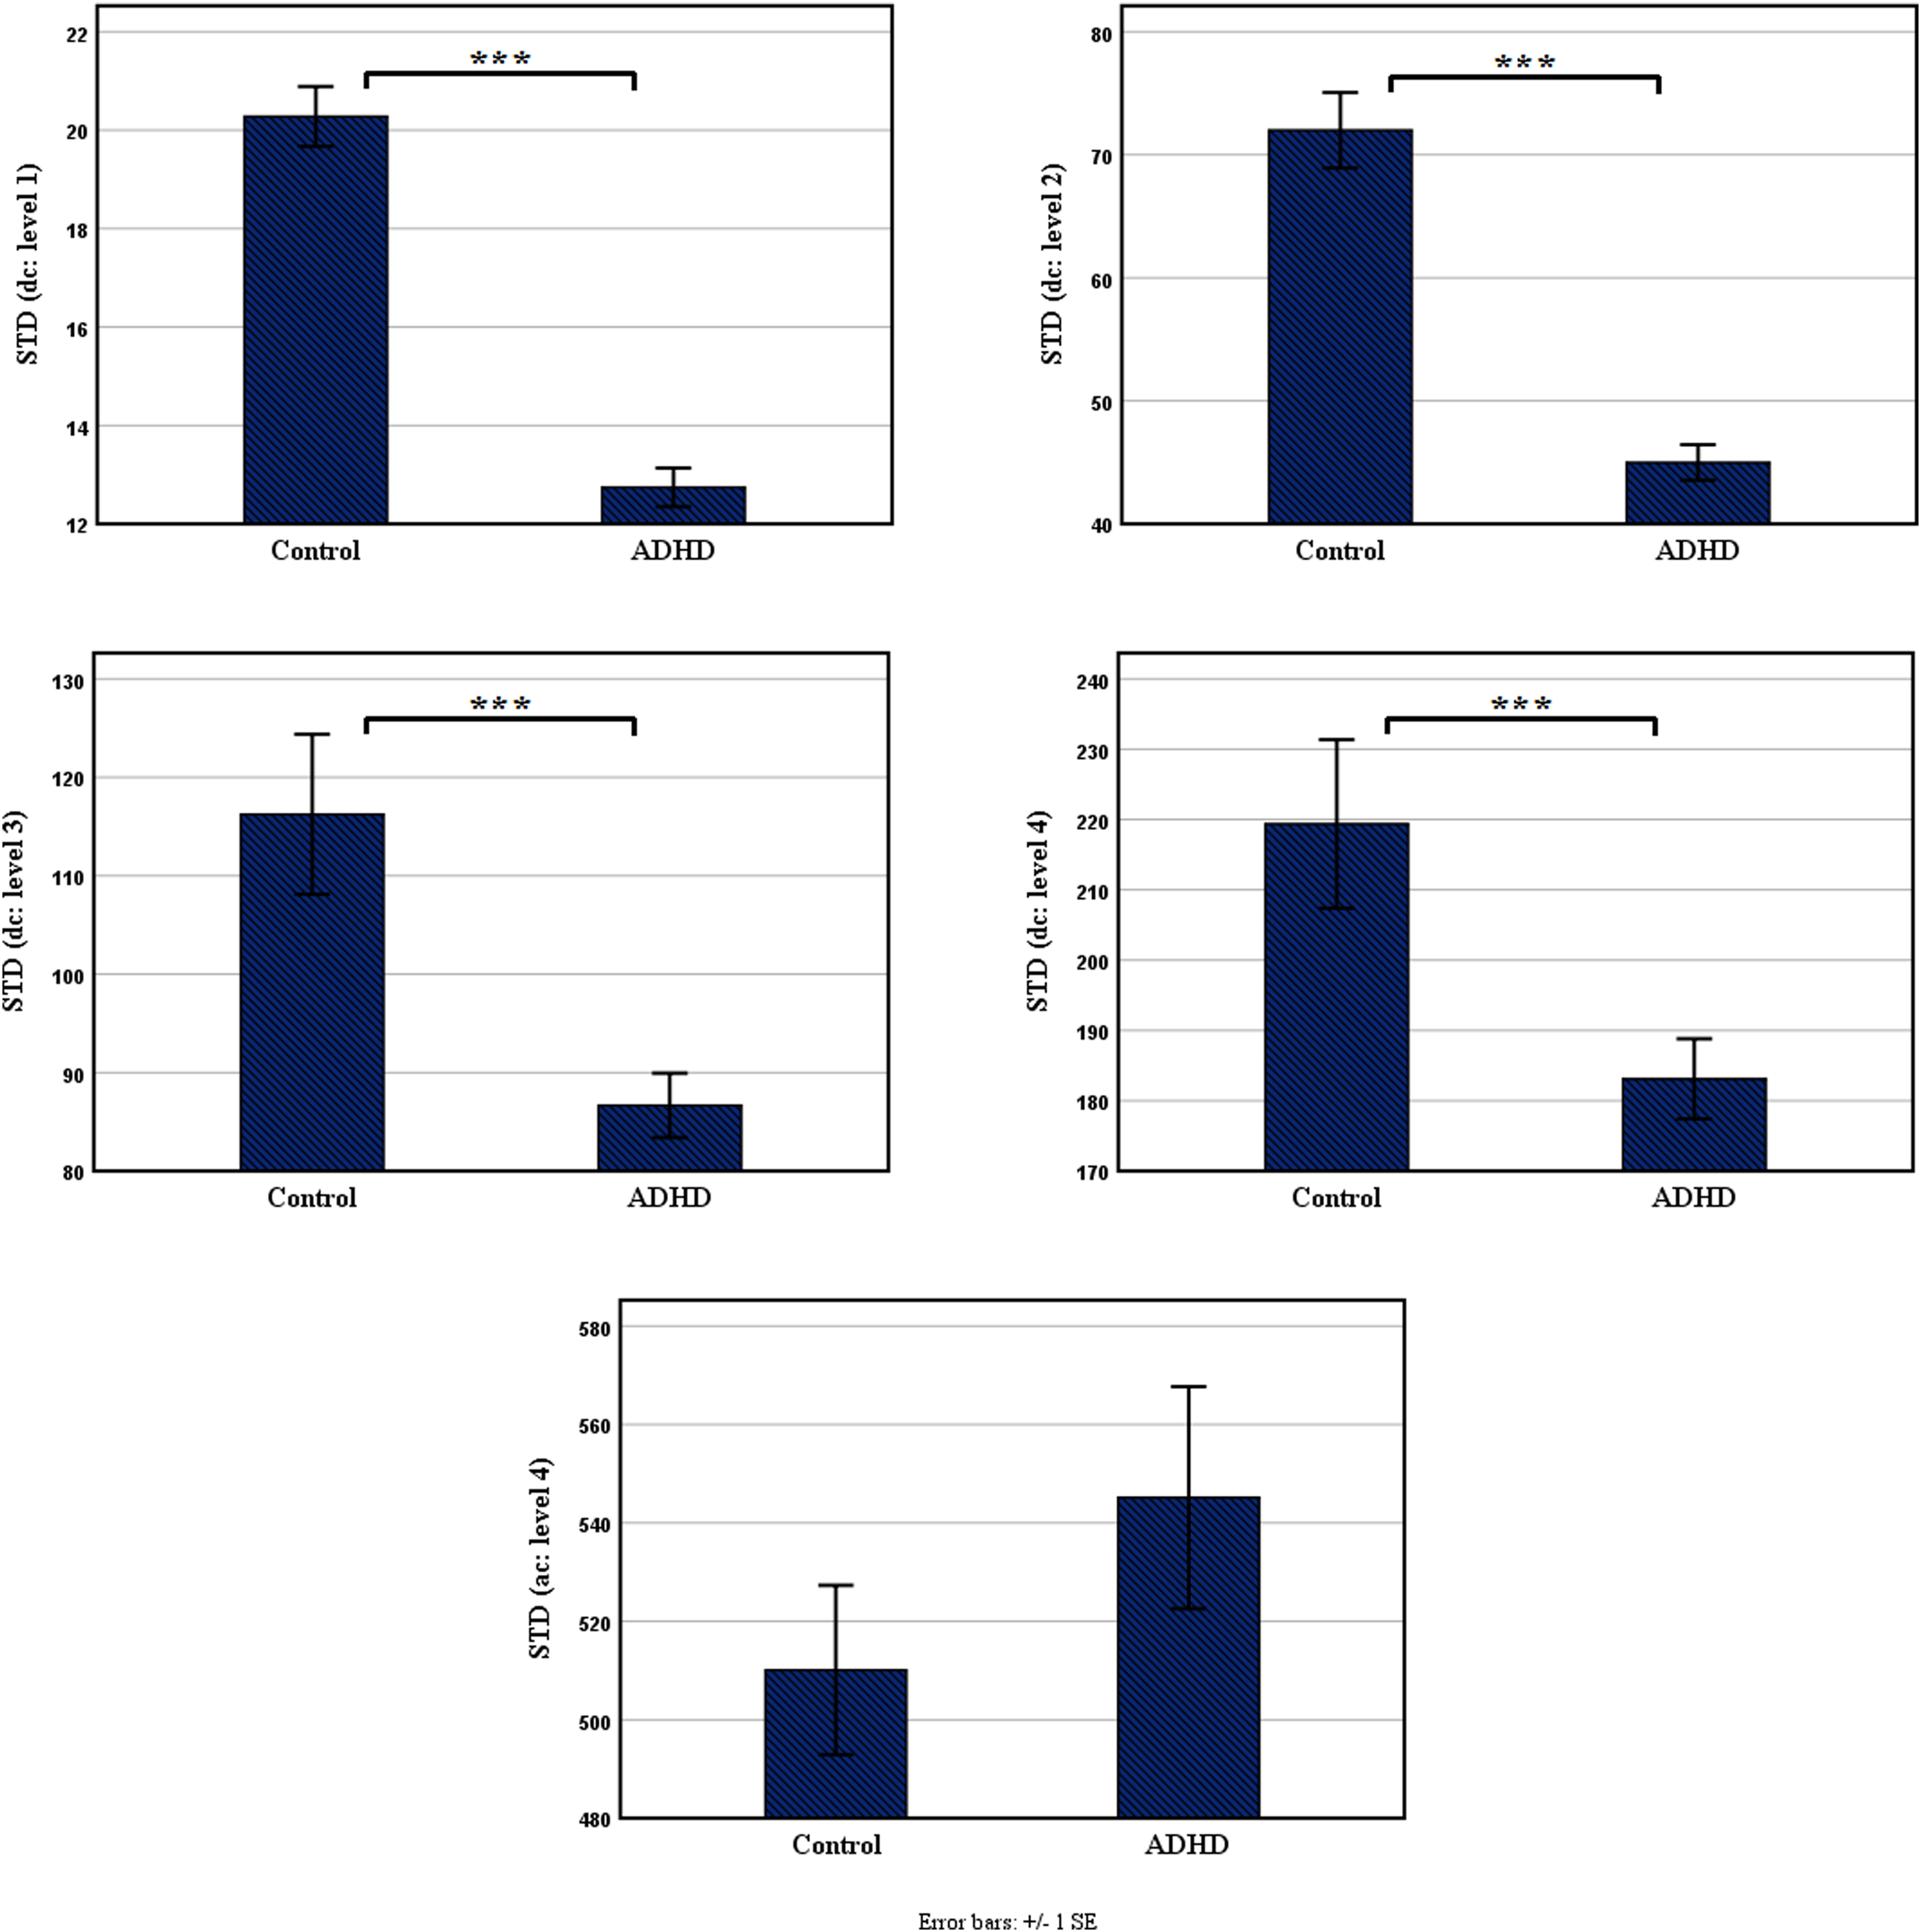
The mean value of the standard deviation of approximation and detail coefficients in the 2 groups (***: P < .001).
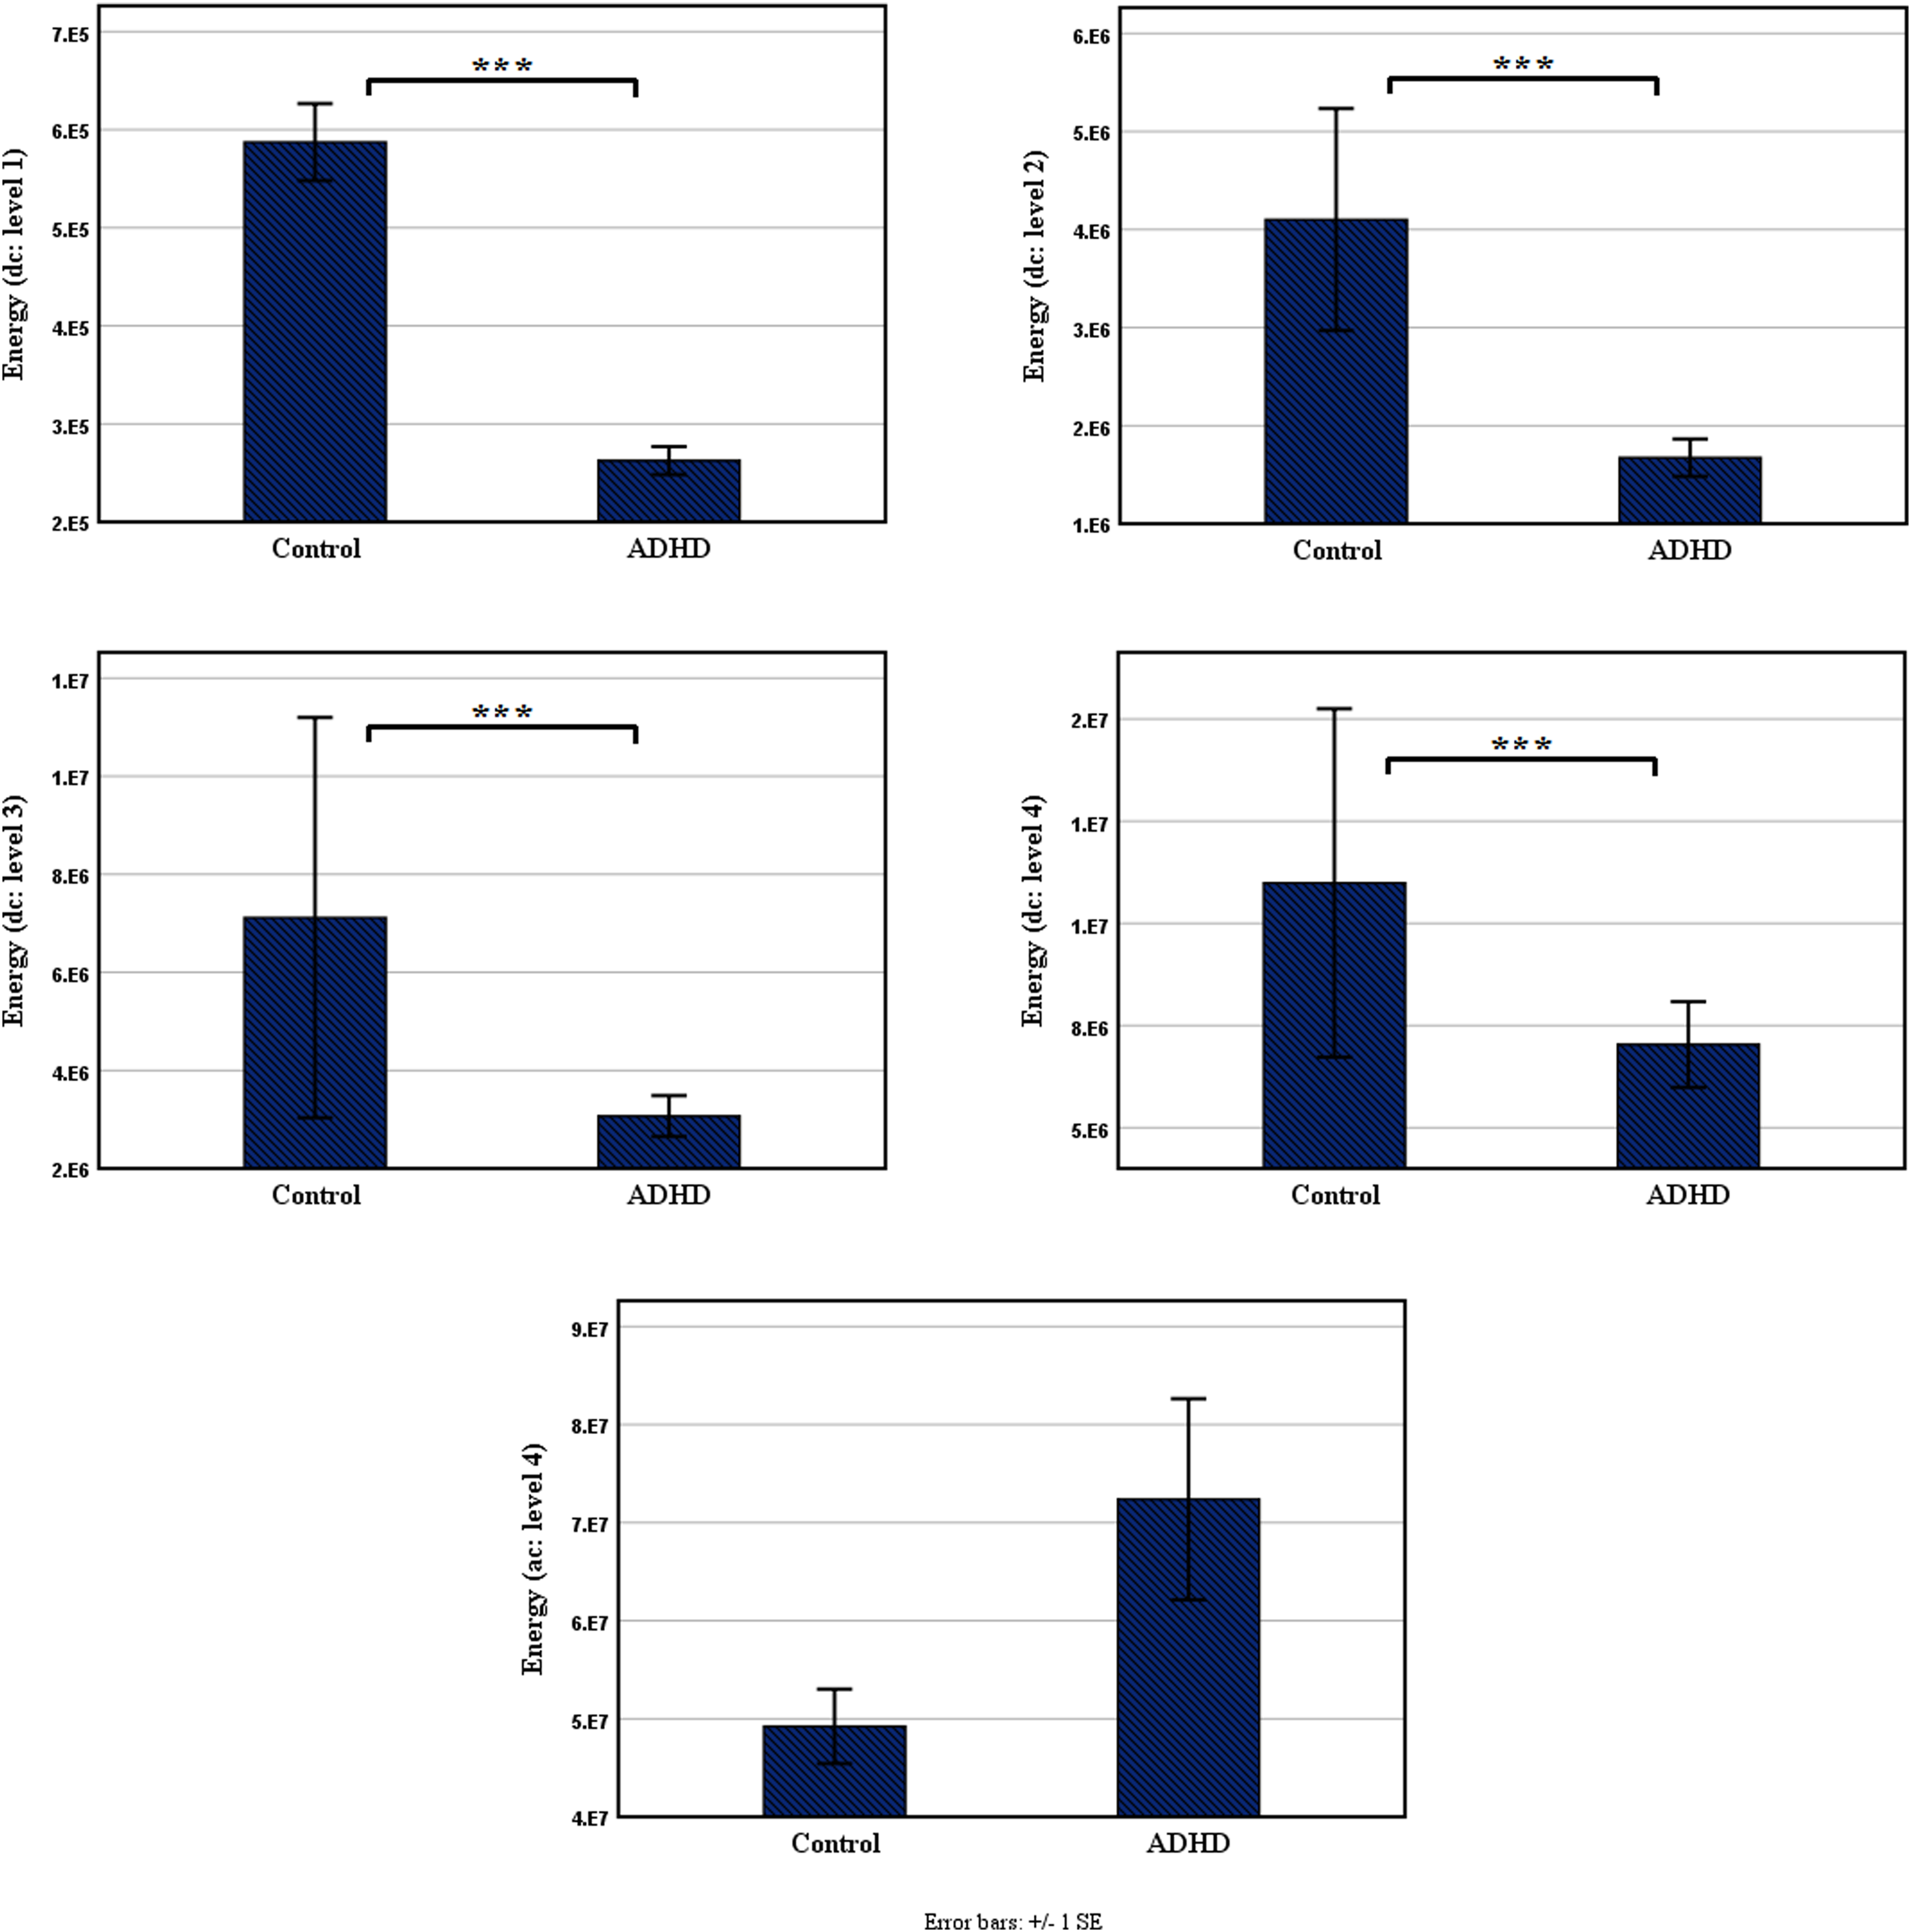
The mean value of the energy of approximation and detail coefficients in both groups (***: P < .001).
Selecting SVM Kernels
For detecting the best kernel of SVM, the performance of 3 different types of kernels, including linear, RBF, and polynomial was compared. For this purpose, the receiver operating characteristics (ROC) curve was applied. A ROC curve illustrates relative trade-offs between sensitivity or true positive rate as the y coordinate and 1-specificity or false positive rate as the x coordinate. 60 The area under the ROC curve (AUC) is a quantitative index, describing accuracy and providing a useful parameter for evaluating and comparing classifiers.
The more the AUC is, the better performance the kernel has. Figure 5 shows the ROC curves of linear, RBF, and polynomial kernels. As can be seen in Figure 5, the AUC of linear kernel was more than that of RBF and polynomial kernels, so it was more accurate for classifying the EOG signals of the ADHD and healthy groups.
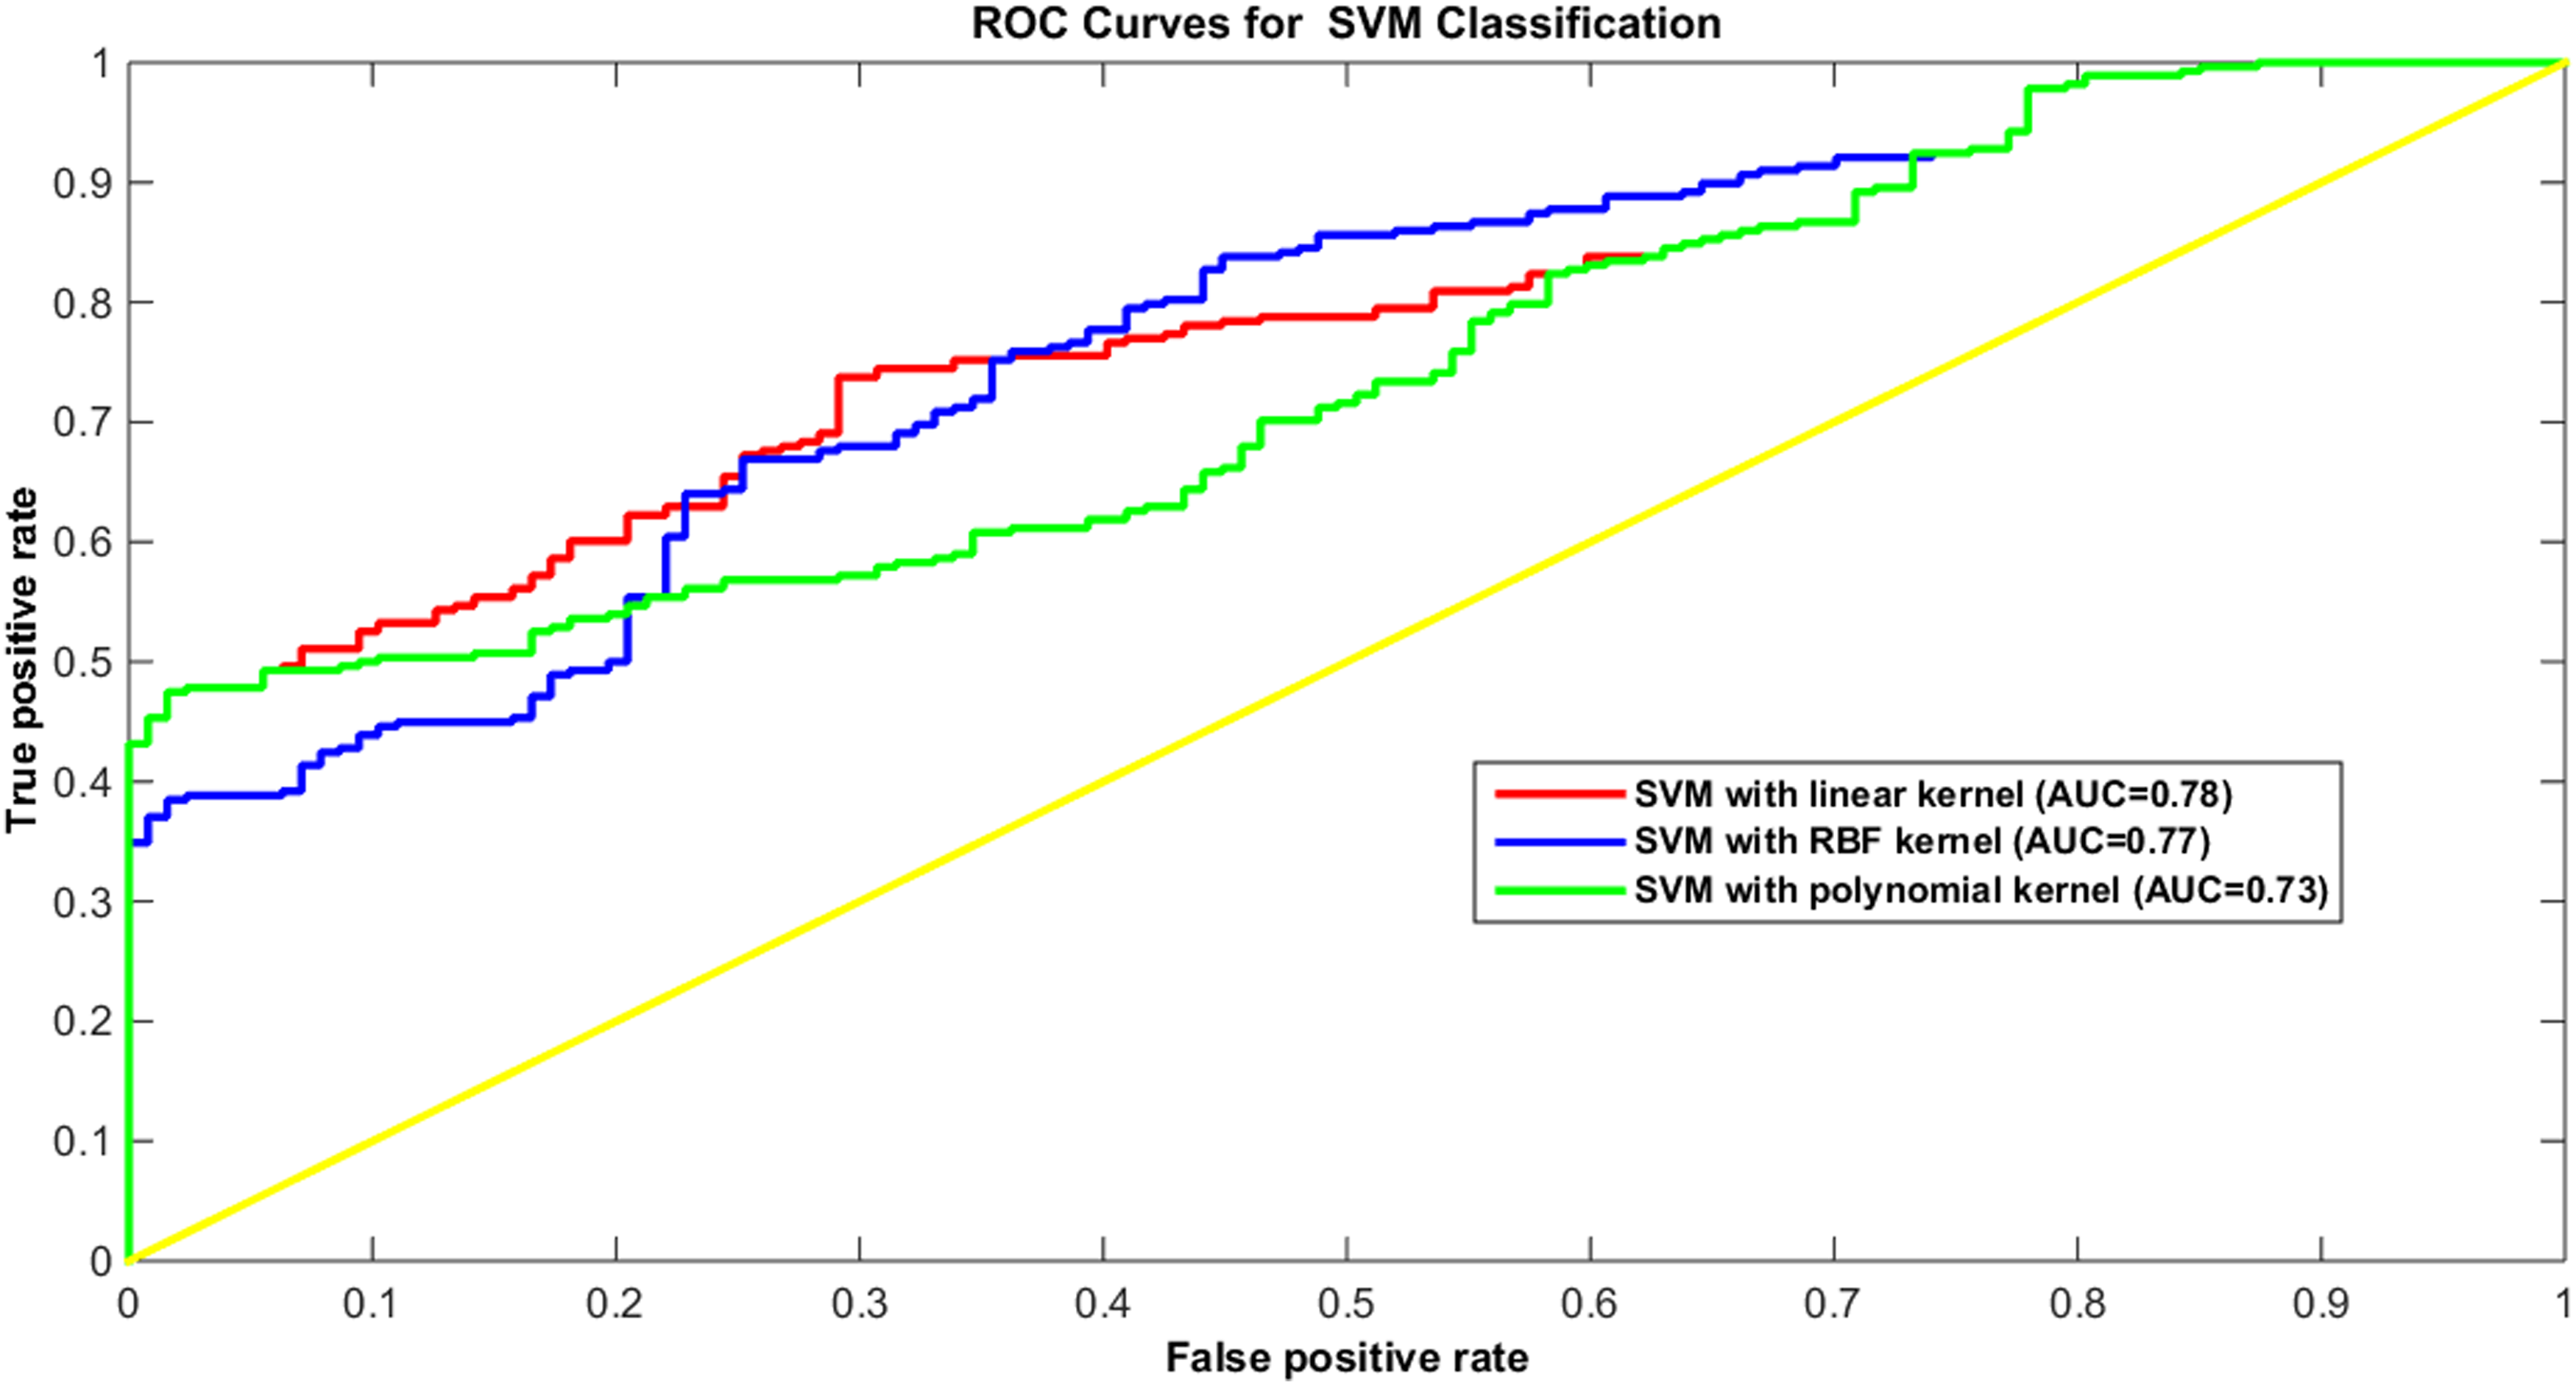
The area under the receiver operating characteristic curve (AUC) to assess the performance of the classifier on various kernel functions, namely linear, RBF, and polynomial.
Classification of the EOG Signals
In this study, SVM classifier was used to classify the cleaned and raw EOG signals of the 2 groups. The 2 groups were classified by one-dimensional feature vector (the SD of detail coefficients of the EOG signals in the first level of decomposition using db4). In total, 90% of the ADHD data was devoted to training and 10% to classifier testing. However, doing so for the healthy data led to decreasing the amount of sensitivity. In turn, the healthy data was reduced in favor of increasing the amount of sensitivity. Eventually, the expedient size for training was captured at 11 and 223 samples for healthy and ADHD groups, respectively. Table 5 presents the mean detection accuracies, sensitivities, and specificities of 10-time classification of both the cleaned and the raw EOG signals of the 2 groups.
The Mean Detection Accuracies, Sensitivities and Specificities of 10 Time Classification.
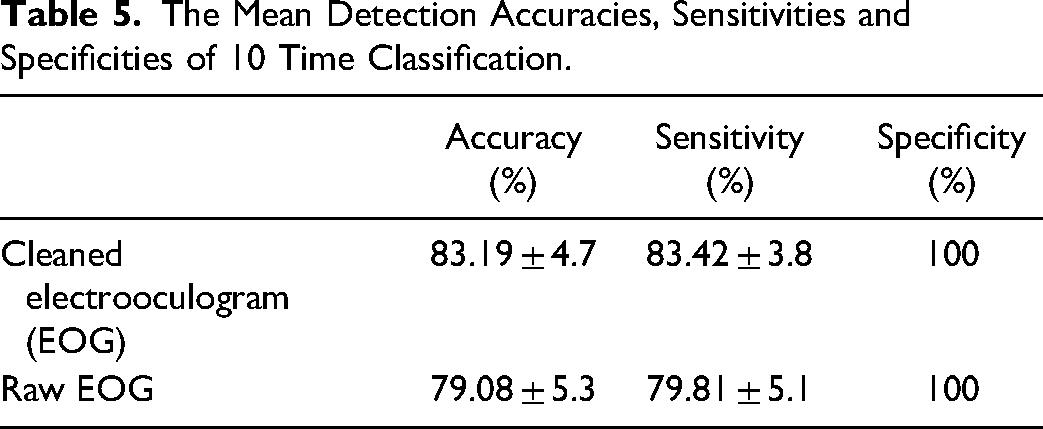
As can be seen in Table 5, the mean detection accuracy for classification of the 2 groups’ cleaned EOG signals was higher as compared to the raw EOG signals. However, this difference was not significant due to the result of t-test (P = .09).
Discussion
Assessment of Extracted Features
Various wavelet features were elicited from the EOG signals of ADHD and healthy children. Due to the obtained results, the energy and SD of detail coefficients in the healthy group were significantly higher in comparison with ADHD group, while performing an attention-related task. 43 In addition, it was revealed that the relative power of the high-frequency band of the EOG signals in the healthy group and the value of the scaling exponent of the EOG signals in ADHD children were significantly higher,44,54 meaning that the dominant frequency components of the EOG signals in ADHD children are related to low-frequency ranges. Moreover, a correlation between the frequency of EOG signals and the speed of eye movement has been found. During the experiment, the participants were asked to count the shapes at the top of the monitor screen first and then count those at the bottom of the screen and add them together. It seems that the gaze of the healthy children was more easily fixed on the desired shapes and moved on the shapes with a small shift, and finally the counting was done quickly. 41 Nevertheless, eyes of those with ADHD moved vertically more broadly, and might even have shifted from top to bottom and vice versa. The significant lower test time in healthy children compared to ADHD children supports this hypothesis.
In other words, the speed of eye movements in ADHD group was lower, whereas they had high-angle eye movement, representing the low frequencies in the EOG signals. In light of the fact that detail coefficients indicate the high-frequency components of the signal, the results of this study are in line with the results of other studies.
Merits of Diagnosing ADHD by Evaluating EOG Signals
In most studies conducted on eye movements of ADHD patients and of healthy individuals, eye tracking systems have been utilized,28,30,31,33–37,41,61,62 while the EOG signal as an extrinsic reflection of unconscious behaviors is an appropriate indicator for an individual's mental activity. In fact, the EOG signal contains information about the level of fatigue or attention. 63 Thus, if similar results with eye-tracking systems are attained by EOG signals processing, discriminating between the 2 groups with a more accessible, simpler, and cheaper system will be feasible.
The differences in SD, energy, and mean values of the ADHD and control groups’ EOG signals were examined. According to the results, the values of SD and energy of EOG signals in the ADHD group were significantly lower. 43 Moreover, the EOG signals of the 2 groups were classified using SD of wavelet detail coefficient and SVM classifier with a sensitivity of 83.19% ± 4.7%, specificity of 100%, and detection accuracy of 83.42% ± 3.8%. In the present study, the detection accuracy has been improved compared to the previous research in which the EOG signals were classified using scaling exponent and Growing Neural Gas (GNG) network with a detection accuracy of 72.22% ± 2.8%. 54 In another research, EOG signals of 2 groups have also been classified with a detection accuracy of 84.6% ± 4.4% using 2 features (approximate entropy and Petrosian's fractal dimension) and a SVM classifier. In the present research, the EOG signals of the 2 groups were classified using only 1 feature with a detection accuracy of 83.42% ± 3.8%.
Consequently, it is expected that EOG signal processing for diagnosing ADHD is functional. Additionally, there was no significant difference between the 2 groups with regard to the role of raw and cleaned EOG signals in classifying the eye movements of ADHD children from healthy ones due to the result of t-test (P = .09). Hence, only if features are extracted from the raw EOG signal can the discrepancy between the EOG signals of the 2 groups be determined.
Future Perspective
The results of the present research have shown that there was a significant difference between the energy and the SD of the wavelet detail coefficients of the EOG signals of ADHD children and healthy ones. Previous research has also shown the significant differences between the EOG signals of the 2 groups in features such as relative power of different frequency bands, fractal dimension, and approximate entropy. 64 As a result, people's EOG signals are affected by their level of attention. For this reason, it is possible to use the EOG signal as a diagnostic tool in neuroscience to track attention. There is also a possibility that the use of EOG biofeedback alone or along with neurofeedback can be effective in reducing ADHD symptoms. Therefore, the obtained results can be useful in proposing an EOG biofeedback protocol to reduce ADHD symptoms.
During EOG biofeedback training, therapists can ask ADHD children to perform a cognitive task similar to the one used in the present research. At the same time as performing the desired task, the children's EOG signals should be recorded. EOG features are extracted from the children's EOG signals and they are encouraged if the amount of EOG features was within the range of healthy children. To implement this training procedure, various training methods similar to Fuzzy adaptive neurofeedback training (FNFT) method, the hard boundary-based neurofeedback training (HBNFT) method, the soft boundary-based neurofeedback training (SBNFT) method, and so on, can be used.44,65–69 These ideas will be explored in future research.
Conclusions
In the present research, differences between EOG signals of ADHD children and healthy children were investigated in energy, mean and SD values of wavelet coefficients. The obtained results showed that the values of energy and SD of EOG signals’ detail coefficients were significantly lower in the ADHD children as compared to healthy ones (P < .001). These results suggest that the speed of the ADHD children's eye movements was slower due to the fact that the high-frequency band activity of EOG signals in healthy children was higher. In addition, the EOG signals were classified with a detection accuracy of 83.42% ± 3.8%. The obtained results also suggest the use of EOG signal as a diagnostic tool in neuroscience to track attention. Furthermore, the results of this study can be applied in designing an EOG biofeedback protocol to treat or mitigate the symptoms of ADHD patients.
Footnotes
Acknowledgment
The authors hereby, express their sincere thanks to Professor Ali Motie Nasrabadi for providing the database.
Declaration of Conflicting Interests
The authors declared no potential conflicts of interest with respect to the research, authorship, and/or publication of this article.
Funding
The authors received no financial support for the research, authorship, and/or publication of this article.