
Abstract
Shipboard helicopter operations are much more challenging and complex than land-based operations due to many factors associated with the presence of the ship. To determine those conditions in which safe operations may occur, a First of Class Flight Trial (FOCFT) is conducted for every new ship–helicopter pair. This trial results in a Ship–Helicopter Operating Limit (SHOL) envelope that is used to document operational limits for regular operations. Conducting a FOCFT is a, expensive, and time-consuming task that requires testing all aspects of operations. Modeling and simulation efforts to support shipboard helicopter operations have been ongoing internationally for many years with the intention of de-risking FOCFT and introducing efficiency into the testing process. Canada will be accepting several new ship classes into its fleet over the next two decades. In support of FOCFT for these new ships, modeling and simulation tools are being developed by the National Research Council (NRC) Canada and Defence Research and Development Canada (DRDC) and significant advancements have occurred in the past decade. As part of this work, NRC and DRDC now use a framework and analysis approach that is intended to standardize SHOL testing with the use of modeling and simulation. This paper introduces that framework and gives details on the modeling and simulation tools that can be used to reduce risk and increase efficiency for Canada’s upcoming FOCFTs.
1. Introduction
Military ships rely heavily on ship-based helicopter operations to provide surveillance, supplies, search and rescue, force protection, and many other roles. These activities must be performed in a variety of weather and sea conditions. Shipboard helicopter operations are much more challenging and complex than land-based operations due to many factors associated with the presence of the ship. Figure 1 shows a diagrammatic representation of the elements (environment, ship, conditions, aircraft, pilot response and capability) and factors (within each element) that contribute to shipboard helicopter limitations and how they relate to one another. The ship and environmental characteristics combine to create the operational conditions in which the helicopter and pilot are required to function. The pilot must then operate the helicopter within its limitations to execute a given task.
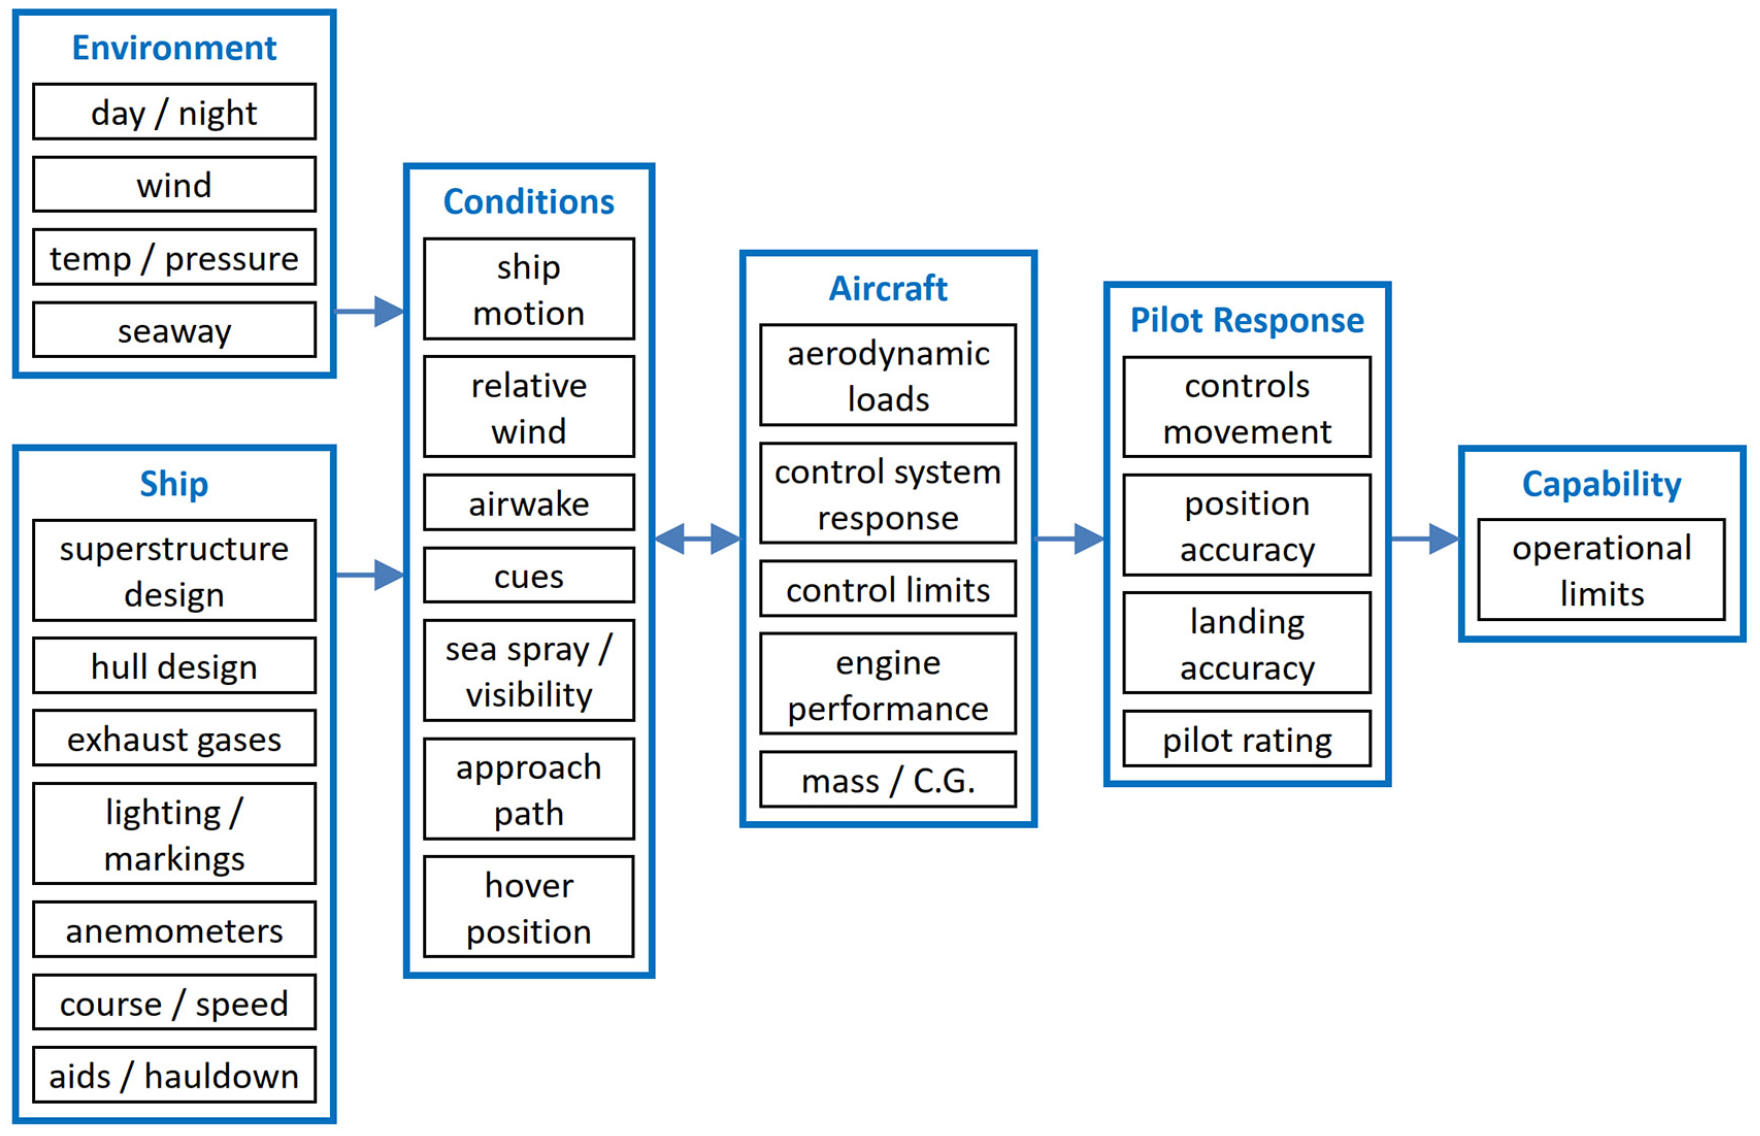
Factors contributing to Ship–Helicopter Operating Limit (SHOL).
To determine those conditions in which safe operations may occur, a First of Class Flight Trial (FOCFT) is conducted for every new ship–helicopter pair. The trial results in a Ship–Helicopter Operating Limit (SHOL) envelope that is used to document operational limits for regular operations. Conducting a FOCFT is a expensive, and time-consuming task. Fundamentally, the SHOL testing process aims to find the capability limit for executing all aspects of shipboard helicopter operations. Different types of limits exist such as the relative wind (RW) envelope for launch and recovery or the deck motion limits for helicopter securing. At a conceptual level, SHOL testing proceeds by increasing the severity of the test conditions until a limit is reached; the first limit reached defines the capability limit.
Modeling and simulation efforts to support shipboard helicopter operations have been ongoing internationally for many years with the intention of de-risking FOCFT and introducing efficiency into the testing process. In Canada, the National Research Council (NRC) Canada and Defence Research and Development Canada (DRDC) have been part of the international community working in this area through the North Atlantic Treaty Organization (NATO) and The Technical Cooperation Program (TTCP) for many years. To make SHOL determination safer, quicker, and more cost effective, the NRC and DRDC have developed modeling and simulation tools for the Royal Canadian Air Force (RCAF) and the Royal Canadian Navy (RCN) for current and evolving ship–helicopter combinations. Canada will be accepting several new ship classes into its fleet over the next two decades and in support of this effort, significant improvements to the modeling and simulation tools for FOCFT have been made. The NRC and DRDC now use a framework and analysis approach that is intended to standardize SHOL testing with the use of modeling and simulation. Work related to ship motions as well as wind and airwake measurements are done by NRC and DRDC in accordance with a set of conventions as defined in (@techreport, 2022). 1
In the 1980s, Healey proposed that modeling and simulation could be used to support shipboard helicopter flight trials.2,3 Since then, a considerable amount of work has been conducted around the world in this area.
A recent review of international work pertaining to airwake impacts on shipboard helicopter operations 4 reveals a rich history and deep knowledge base internationally in this area. The paper by Shukla et al. covers basic features of a ship airwake including the governing physical principles and a comprehensive overview of the work relating to the experimental and computational modeling of ship airwakes. This paper also describes coupled methods, which go beyond the airwake to include the effects of the helicopter. The conclusions of this paper compose a snapshot of the state of the art with respect to airwake-related modeling for supporting shipboard helicopter operations.
International collaborators have been working in this area for decades through the former TTCP working group AER-TP2 (Canada, the United Kingdom, Australia, and the United States of America). A wider collaboration has been ongoing in NATO Applied Vehicles Technology (AVT) working groups 5 where topics of subsequent working groups have been: effects of ship geometry modification on airwake structures, 6 documentation of simulation best practices, 7 ship design guidance for helicopter operations 8 and most recently, benchmarking methods used by various nations and an analysis of the effects of ship motion. 9 These works show how the state of the art has advanced through international collaboration. A future goal of these collaborations is to use modeling and simulation to expand multinational operations by allowing nations to operate helicopters from allied ships in a wider range of conditions than the current narrow interoperability envelopes permit. 10 In the future, the outputs of these international collaborations may feed into broader operational envelopes in Helicopter Operations from Ships Other than Aircraft Carriers (HOSTAC), which is the NATO document governing international shipboard helicopter operations. 11
Modeling and simulation of ship motions is similarly mature compared with simulation of the ship airwake. 12 NATO Subgroup 61 on Virtual Ships developed a standard for ship motion simulation to enable international collaboration on the study of ship motion. 13 While airwake and ship motion modeling are covered well individually in literature and many nations possess such modeling capabilities, the combined effects of the two on helicopter operations is not currently part of the established capability in most nations, and is a topic of current research and collaboration. Many are investigating the effects of ship motion on airwake;9,14–17 however, the full impacts on operational capabilities remain largely unknown. To date, no individual modeling and simulation tool is able to fully capture all the important elements of the shipboard operational environment.
The NATO AVT-217 working group report 8 discussed different types of modeling and simulation tools that are useful in supporting shipboard helicopter operations and their different characteristics; a conceptual framework surrounding this discussion is shown in Table 1. The table is based on the current tools developed and used by the working group members. For this reason, Table 1 is conceptually incomplete although it introduces many of the concepts necessary for a more universal framework. Some modeling and simulation tools model specific parts of the system previously given in Figure 1 to gain insight on the impacts of certain elements on operations, where others combine modeling of many parts in an effort to simulate the environment more completely. Some tools that consider specific aspects of the system use the concept of indirect metrics, which will be described later. This concept is shown in Table 1 for those tools where derived quantities come from the measured quantities. Other tools measure the quantities of interest directly and therefore have no derived quantities. Generally speaking, direct metrics are used for those simulations that consider the system shown in Figure 1 more holistically.
Classification of modeling and simulation methods.
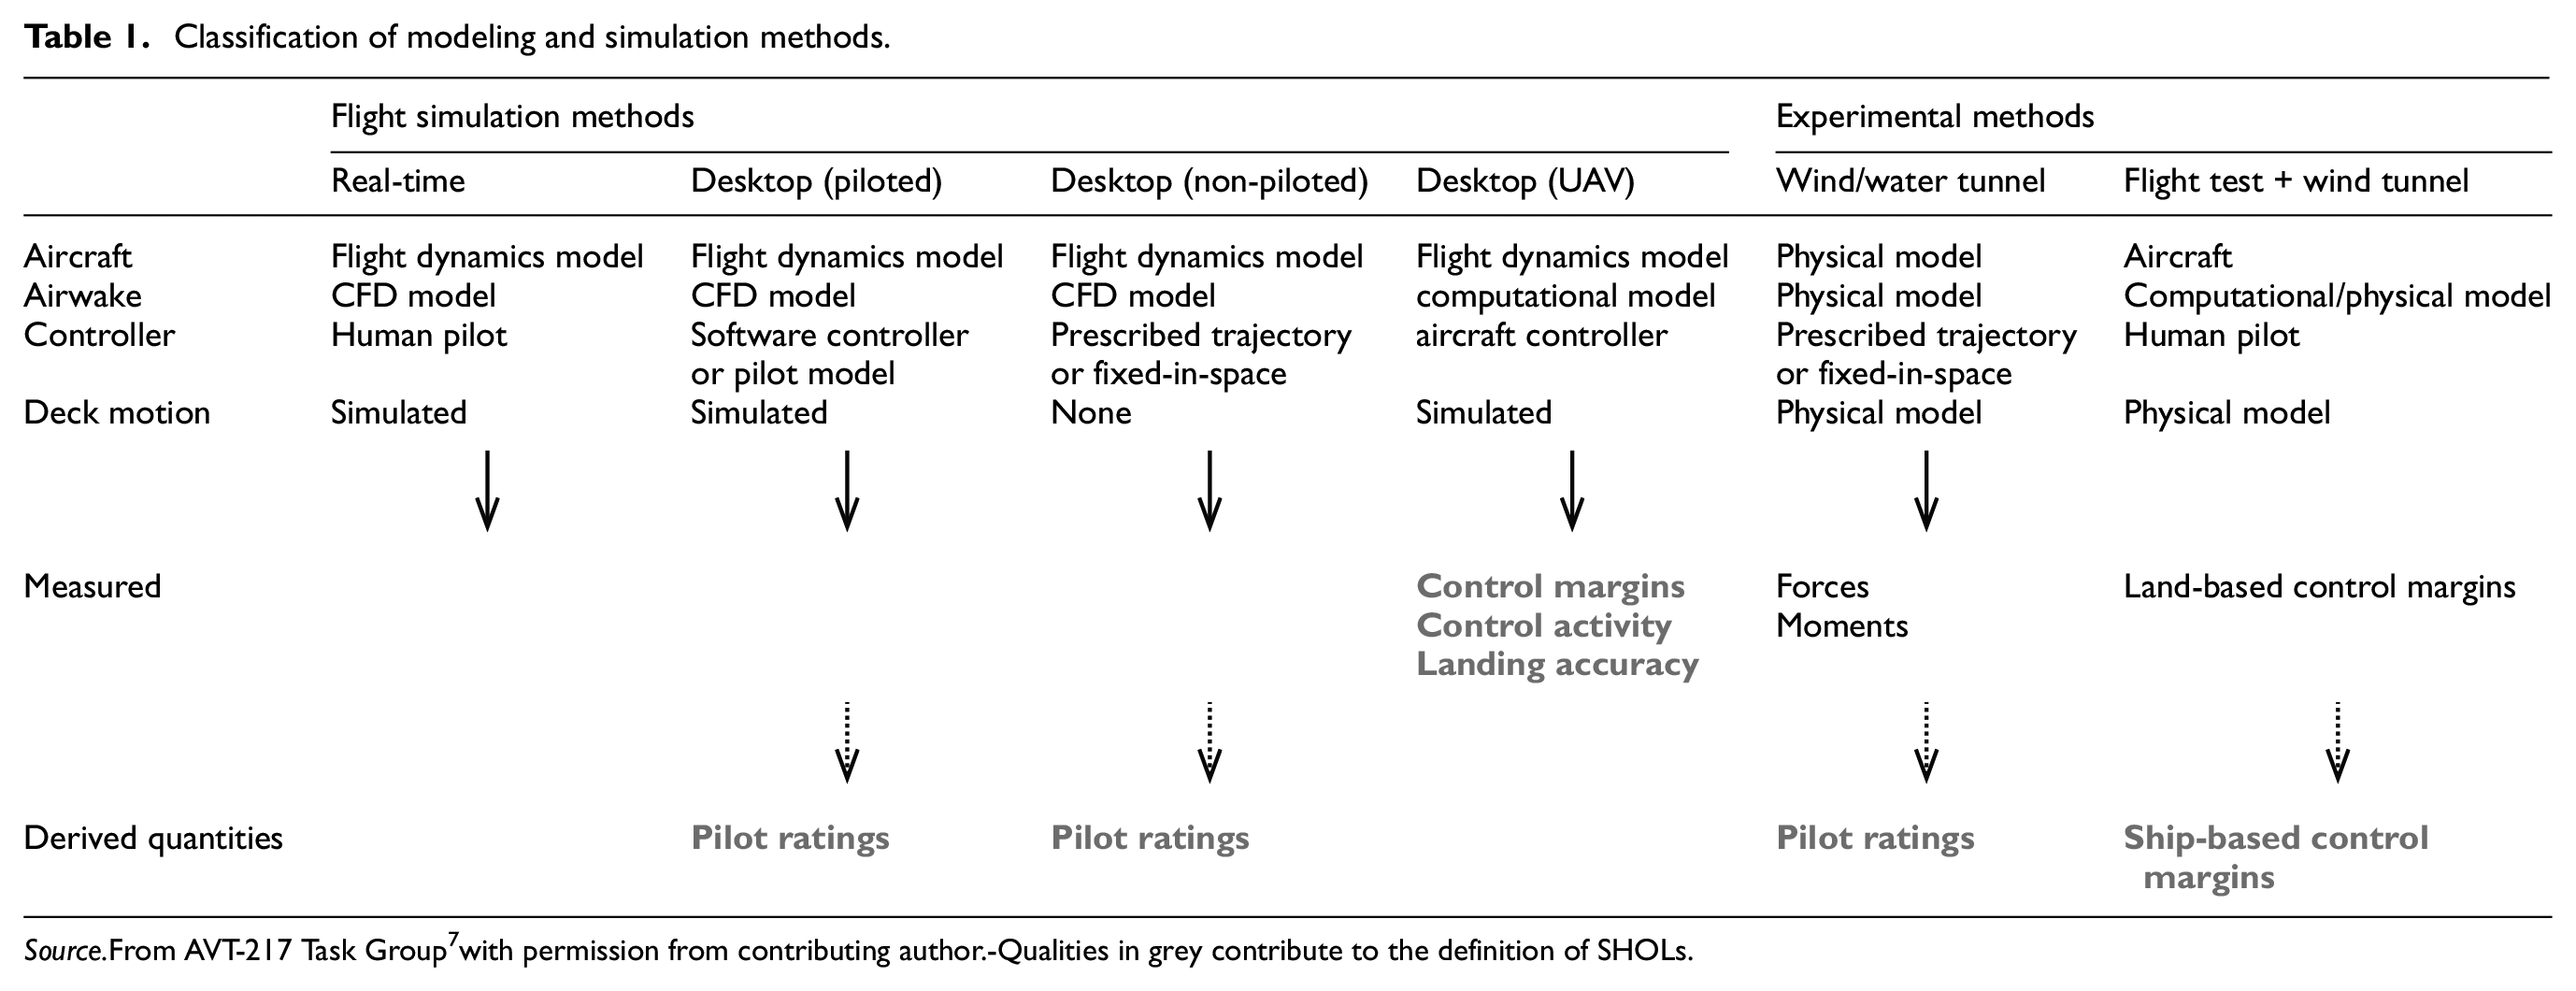
Source.From AVT-217 Task Group 7 with permission from contributing author.-Qualities in grey contribute to the definition of SHOLs.
The modeling and simulation tools that are available to support shipboard helicopter operations are relatively well covered in the open literature. However, for the most part, discussions surrounding the use of modeling and simulation tools to support flight trials themselves are largely happening internal to individual nations’ operational processes, or through formalized international collaborations, such as NATO. One exception is a testing methodology that is supported by modeling and simulation used in the Netherlands as reported by Hoencamp. 18 In general, the details of each national approach to modeling and simulation support to SHOL vary depending on the unique situations and resources within each nation.
The current paper describes the major factors affecting shipboard helicopter operational limits, and it will present a conceptual framework that can be used to identify and quantify operational limits. The conceptual framework has been developed in a modular and scalable manner, and it allows the major workload contributions to overall operating limits to be quantified. The paper will demonstrate how the framework applies to flight testing and how the framework incorporates a variety of modeling and simulation tools. In Canada, the NRC and DRDC use a suite of experimental and computational tools that represent direct and indirect metrics of different combinations of the factors that affect operational limits (shown previously in Figure 1). These modeling and simulation tools include Anemometer Bias Management (ABM), measurements of the unsteady loading on a helicopter model, airwake analysis, an Integrated Reality In-flight Simulator (IRIS) capability, and ship motion simulation capabilities. The role of each tool in supporting the identification of operational limits will be described. Finally, a proposed method by which modeling and simulation tools can be incorporated into planning of FOCFT planning to improve efficiency and reduce risk is presented.
2. A conceptual framework for the identification of shipboard helicopter operational limits
FOCFTs include testing many different aspects of helicopter operations aboard a ship, all of which require certification or validation to ensure they are safe within a defined envelope. These tests fall into six main categories: aviation facility compatibility, maintenance activities, deck operations (e.g., traversing, securing, straightening, blade spread/fold, and refueling), visual compatibility (e.g., ship and helicopter lighting compatibility), electromagnetic compatibility (EMC), and flight operations (e.g., launch and recovery, Vertical Replenishment (VERTREP), Helicopter In-Flight Refueling (HIFR), hoisting, hot refueling, and emergency landing).
Fundamentally, the FOCFT process aims to find the capability limits (i.e., SHOL) for executing all aspects of the intended shipboard helicopter operations. One type of limit set is used to define the maximum allowable motions of the ship flight deck. Another type is the Wind Over Deck (WOD) envelope which identifies all of the RW speeds and azimuth angles for which a given operation may be safely conducted.
Specific SHOL envelopes are typically developed for each type of evolution such as launch, recovery, HIFR, VERTREP, and hoisting. Envelopes may be further refined to include specific operational details such as visibility conditions (e.g., day, night unaided, night aided) or for different aircraft gross weight bands. For each envelope generated, the opportunity to provide greater operational capability usually exists, but at the cost of increasing the length and complexity of the FOCFT used to develop. By way of example, days or weeks may be required to conduct a flight trial in a high sea state with strong winds. In the interim, high-value assets are committed to the trial and therefore not available for operations. The application of careful modeling and simulation aims to provide those greater operational capabilities at reduced cost and risk. The scope of this paper will focus primarily on launch and recovery operations and their respective WOD and flight deck motion envelopes.
2.1. Composition of limits
The fundamental objective of SHOL is to ensure that ship-based helicopter operations (a.k.a. evolutions) are achievable and safe. SHOL development involves consideration of different aspects of an operation, each of which may have one or more limiting factors. These individual factor limits are then combined to form a total capability limit, Γ, such that Γ is reached or exceeded if any of its component limits is reached or exceeded. At a conceptual level, FOCFT proceeds by increasing the severity of the test conditions until a limit is reached; the first limit reached defines the capability limit, Γ.
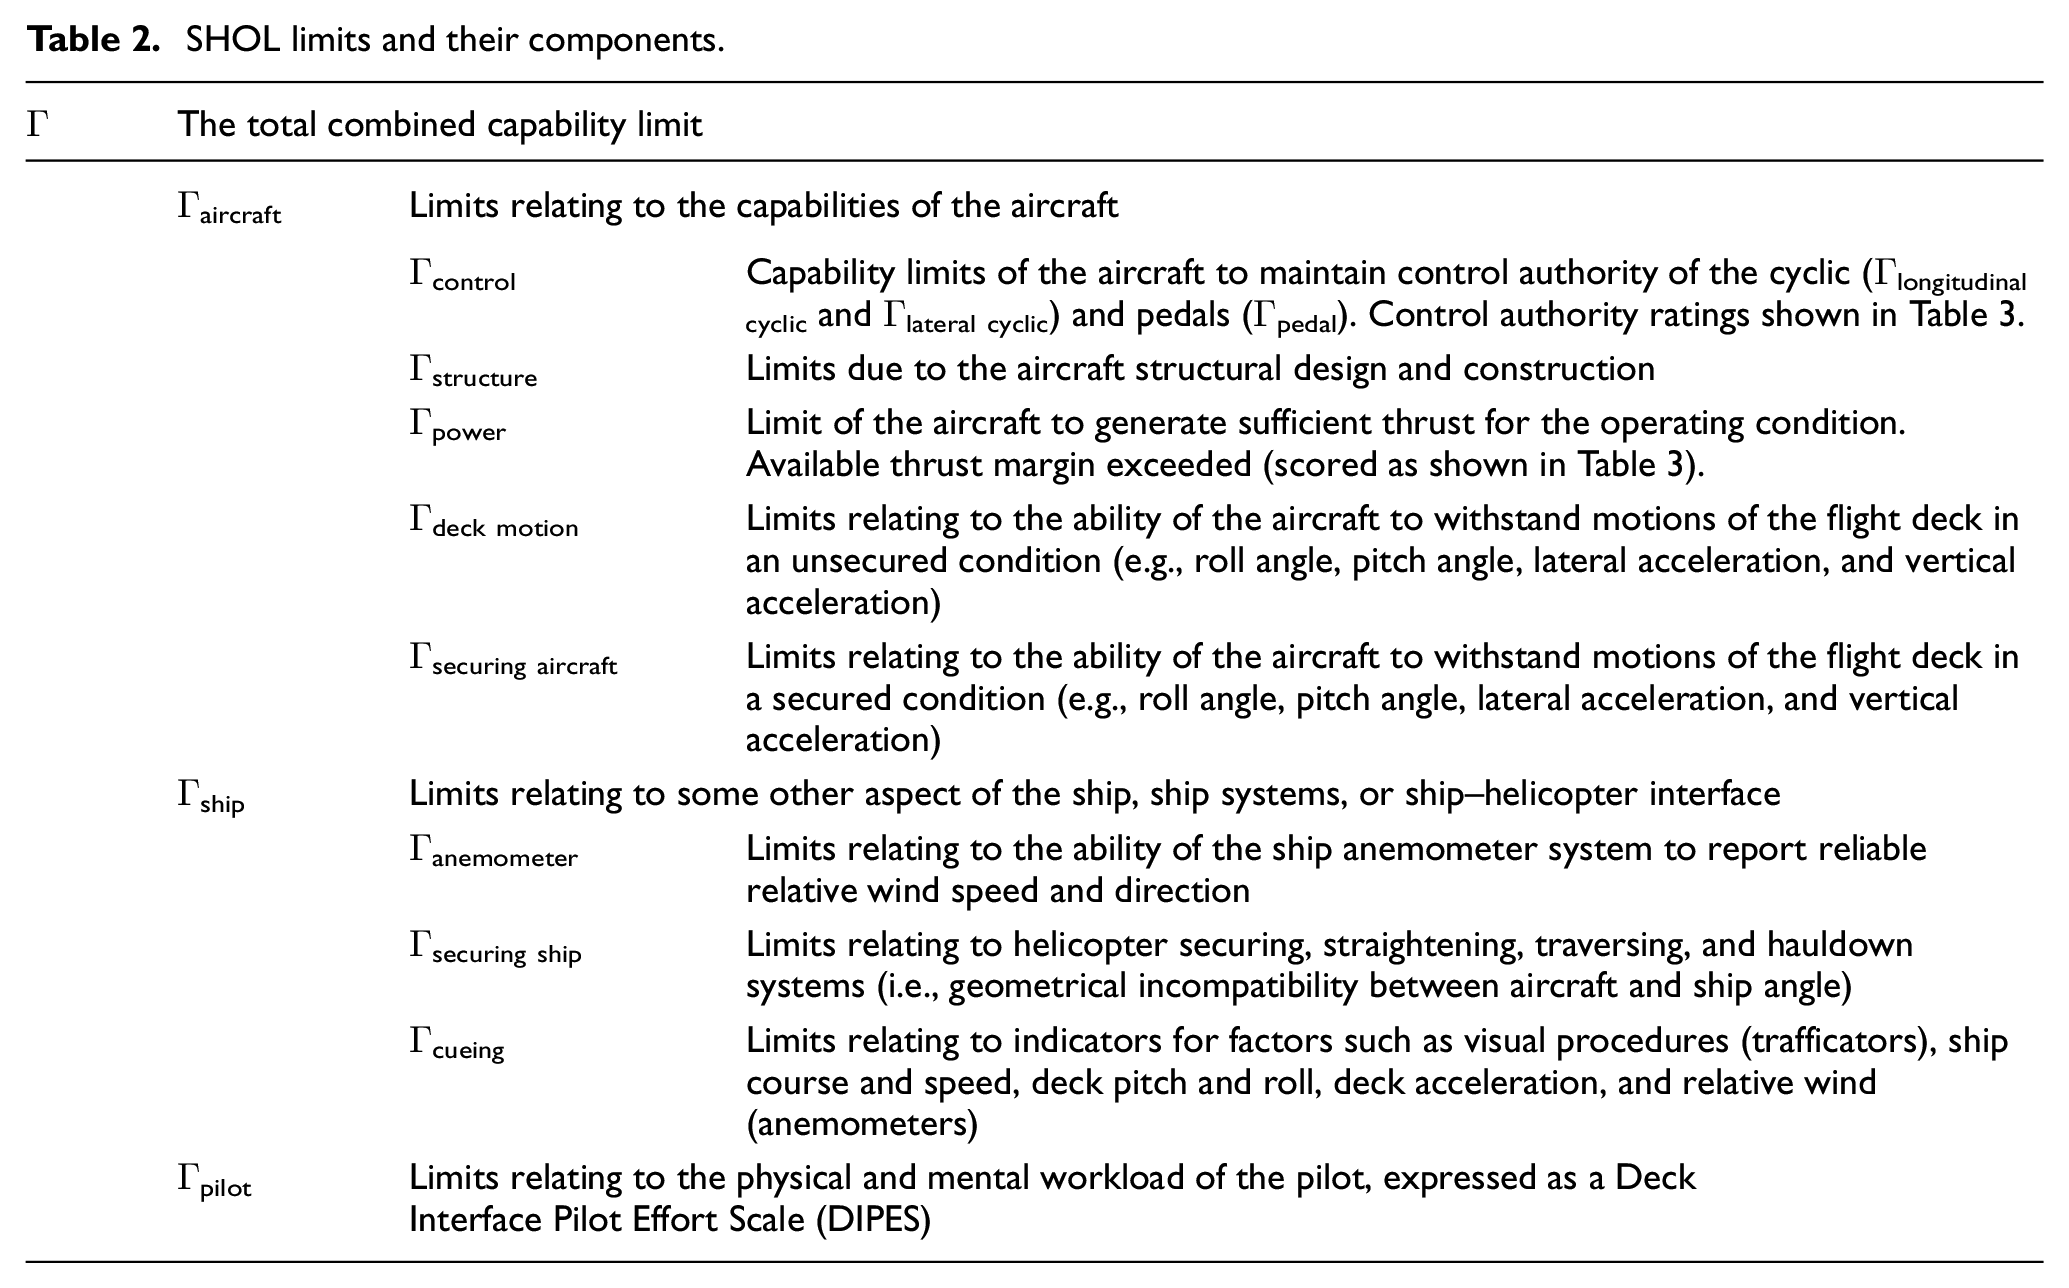
The different contributing factors of Γ can be categorized as being related to the aircraft, the ship, or the pilot. Each of these can then be further decomposed into sub-factors accounting for the specific limiting characteristics of that category. Table 2 shows the breakdown of Γ into component limits that are considered when developing SHOL.
SHOL limits and their components.
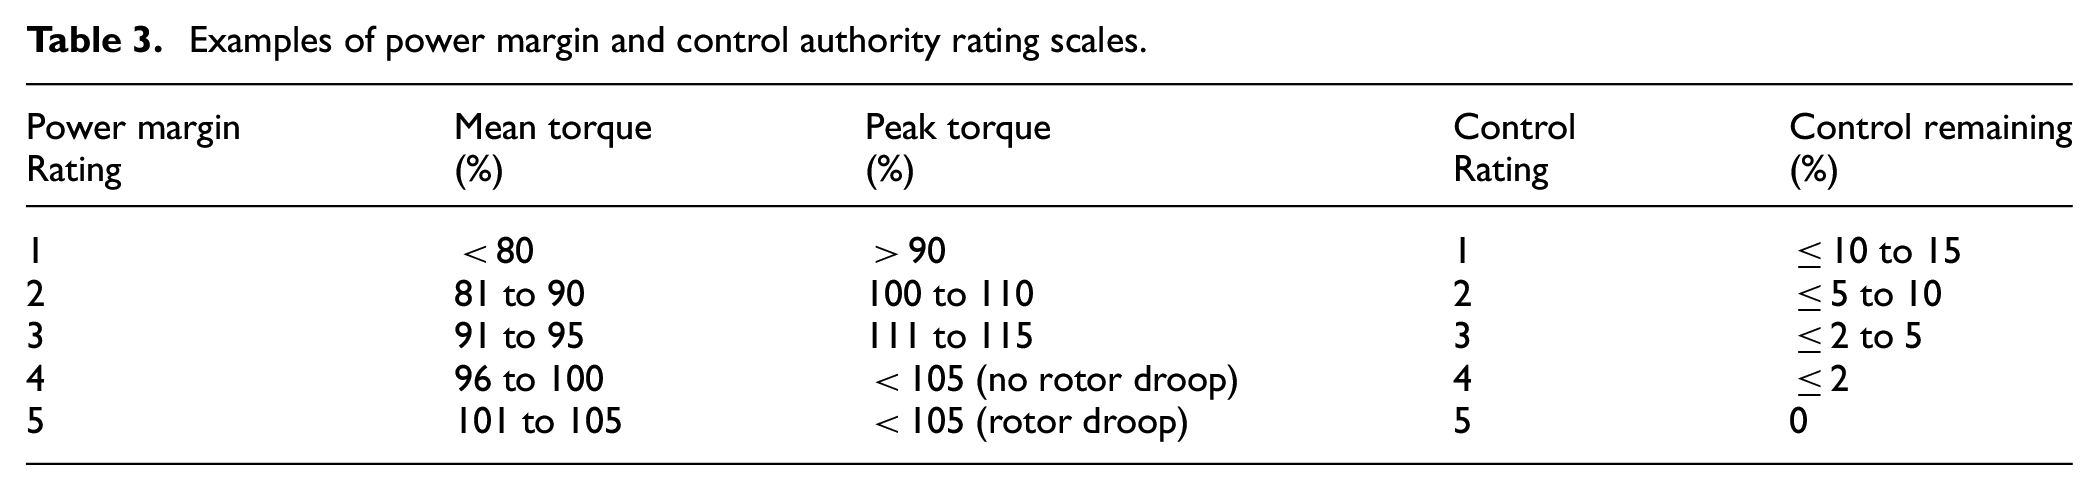
Examples of power margin and control authority rating scales.
The most common reasons for Γ to be exceeded for launch and recovery operations (a focus of this paper) are Γpower, Γanemometer, and Γpilot.
2.1.1. Limits based on aircraft power
The power limit, Γpower, is reached if the total power required (Prequired ship) exceeds the total power available (Pavailable ship) from the helicopter:

For the purposes of this framework, Prequired ship is the total power required of the aircraft in the ship environment for the given test point or condition. Power available, Pavailable ship, is the total power produced by the aircraft in the ship environmental conditions. The ideal available power, Pavailable ideal, is given by the manufacturer for the given environmental conditions, and the power available behind the ship differs from ideal power by an amount, Pexhaust gases, that comes from a reduction due to the ingestion of warm air from the ship exhaust system:

During shipboard helicopter operations, there are a number of factors that can increase the amount of power required, which can be described as follows:
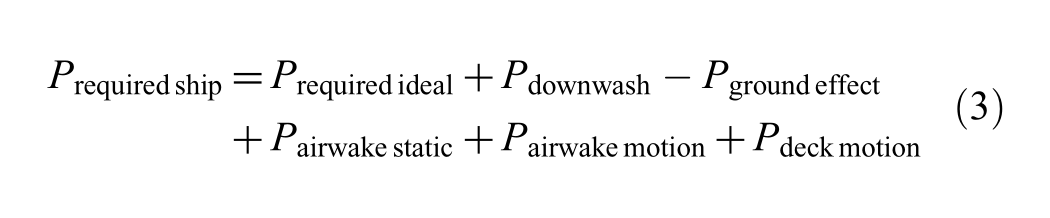
where, Prequired ideal is given by the aircraft design outside of the ship environment; Pdownwash represents an increase on required thrust due to the presence of superstructure-induced downwash, which increases the power required to maintain hover; Pground effect represents the reduction in power required while in ground effect; Pairwake static represents the changes to the power required because of airwake effects, including turbulence, velocity deficit, and lateral flow components; Pairwake motion represents the additional power required due to the impact of ship motion on airwake; Pdeck motion represents the additional power to compensate for ship deck pitch or heave acceleration.
2.1.2. Limits based on ship anemometer systems
RW measurements, typically gathered by two anemometer units located on the mast or some other elevated location, are required for determining whether the current environmental conditions are within the envelope for safe operations. The RW is the vectored sum of the true wind and the ship course and speed. RW is correlated to the flow environment over the flight deck, which is referred to as the ship airwake or WOD, although the two quantities are not the same, owing to the effect of the ship superstructure on the airwake. All practical anemometer positions are subject to reading distortions caused by the presence of the ship itself, which may render individual anemometer readings unusable for a portion of the azimuthal range. Unusable anemometer readings may result in an anemometer limit, Γanemometer, if another anemometer unit is not able to provide a reliable reading for those wind conditions. The range where the anemometer can be used is known as the “useful range.” Figure 2 shows an example useful range from a ship with two anemometers; one on each side (port and starboard) of the ship’s mast. The port anemometer is used for winds approaching from the port generate reliable readings, whereas winds from the starboard side are blocked by the mast and therefore readings from the port anemometer are unreliable.
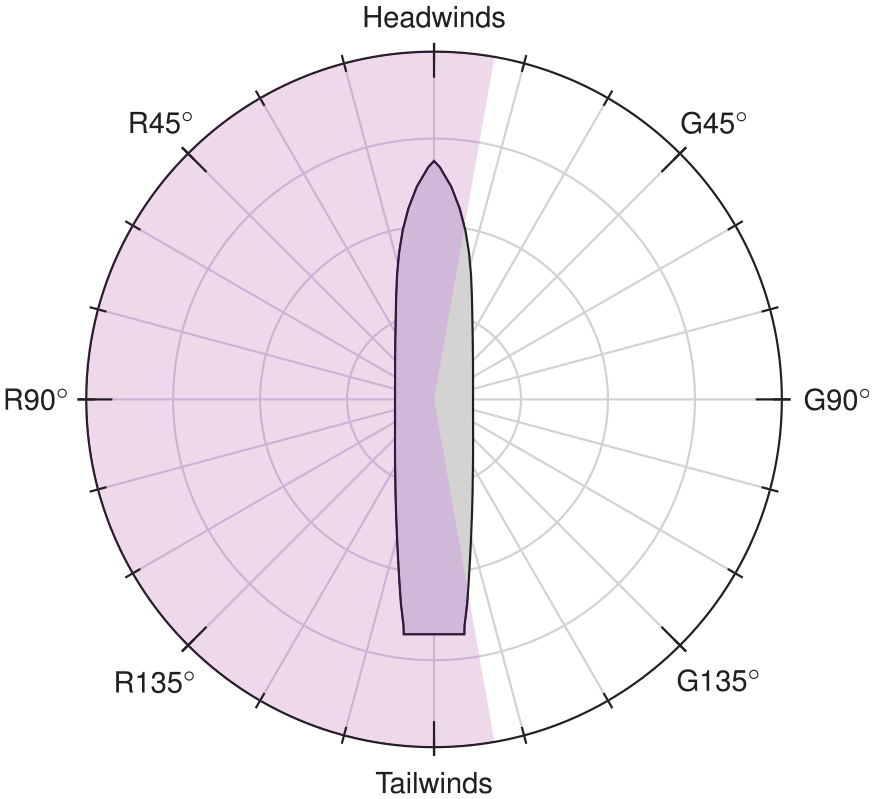
Port anemometer useful range in shaded area.
2.1.3. Limits based on pilot workload: DIPES
During FOCFT, flight events such as take-offs and landings are subjectively rated to determine the amount of pilot workload or compensation that is required to complete the event at a given condition (nominally a wind speed, wind direction, sea state, and visibility condition). This subjective rating is defined by the flying pilot using the Deck Interface Pilot Effort Scale (DIPES), which takes into consideration the representative average fleet pilot ability and the overall safety of the operation.
The pilot workload or DIPES rating assigned during flight testing is represented by Wtotal in Equation (5). The DIPES scale is shown in Figure 3, and it consists of a difficulty number assignment and an optional letter suffix 19 . In Canada, the DIPES has superseded the previously used Pilot Rating Scale (PRS) system, and it provides greater precision along with a description of any limiting factors associated with a maneuver. A DIPES rating of 1–3 indicates that the maneuver is acceptable and would allow fleet pilots to be consistently safe. A DIPES rating of 4–5 is deemed unacceptable and is associated with either an excessive or a dangerous level of an average fleet pilot workload. A limit due to pilot workload, Γpilot is defined when Wtotal changes from a 3 to a 4 DIPES rating. At the end of the FOCFT, the final WOD envelope is nominally drawn at the last DIPES 3 test points or at the interface between a rating of 3 and 4 for the range of wind speeds and directions tested, assuming no other type of limit has been reached first:

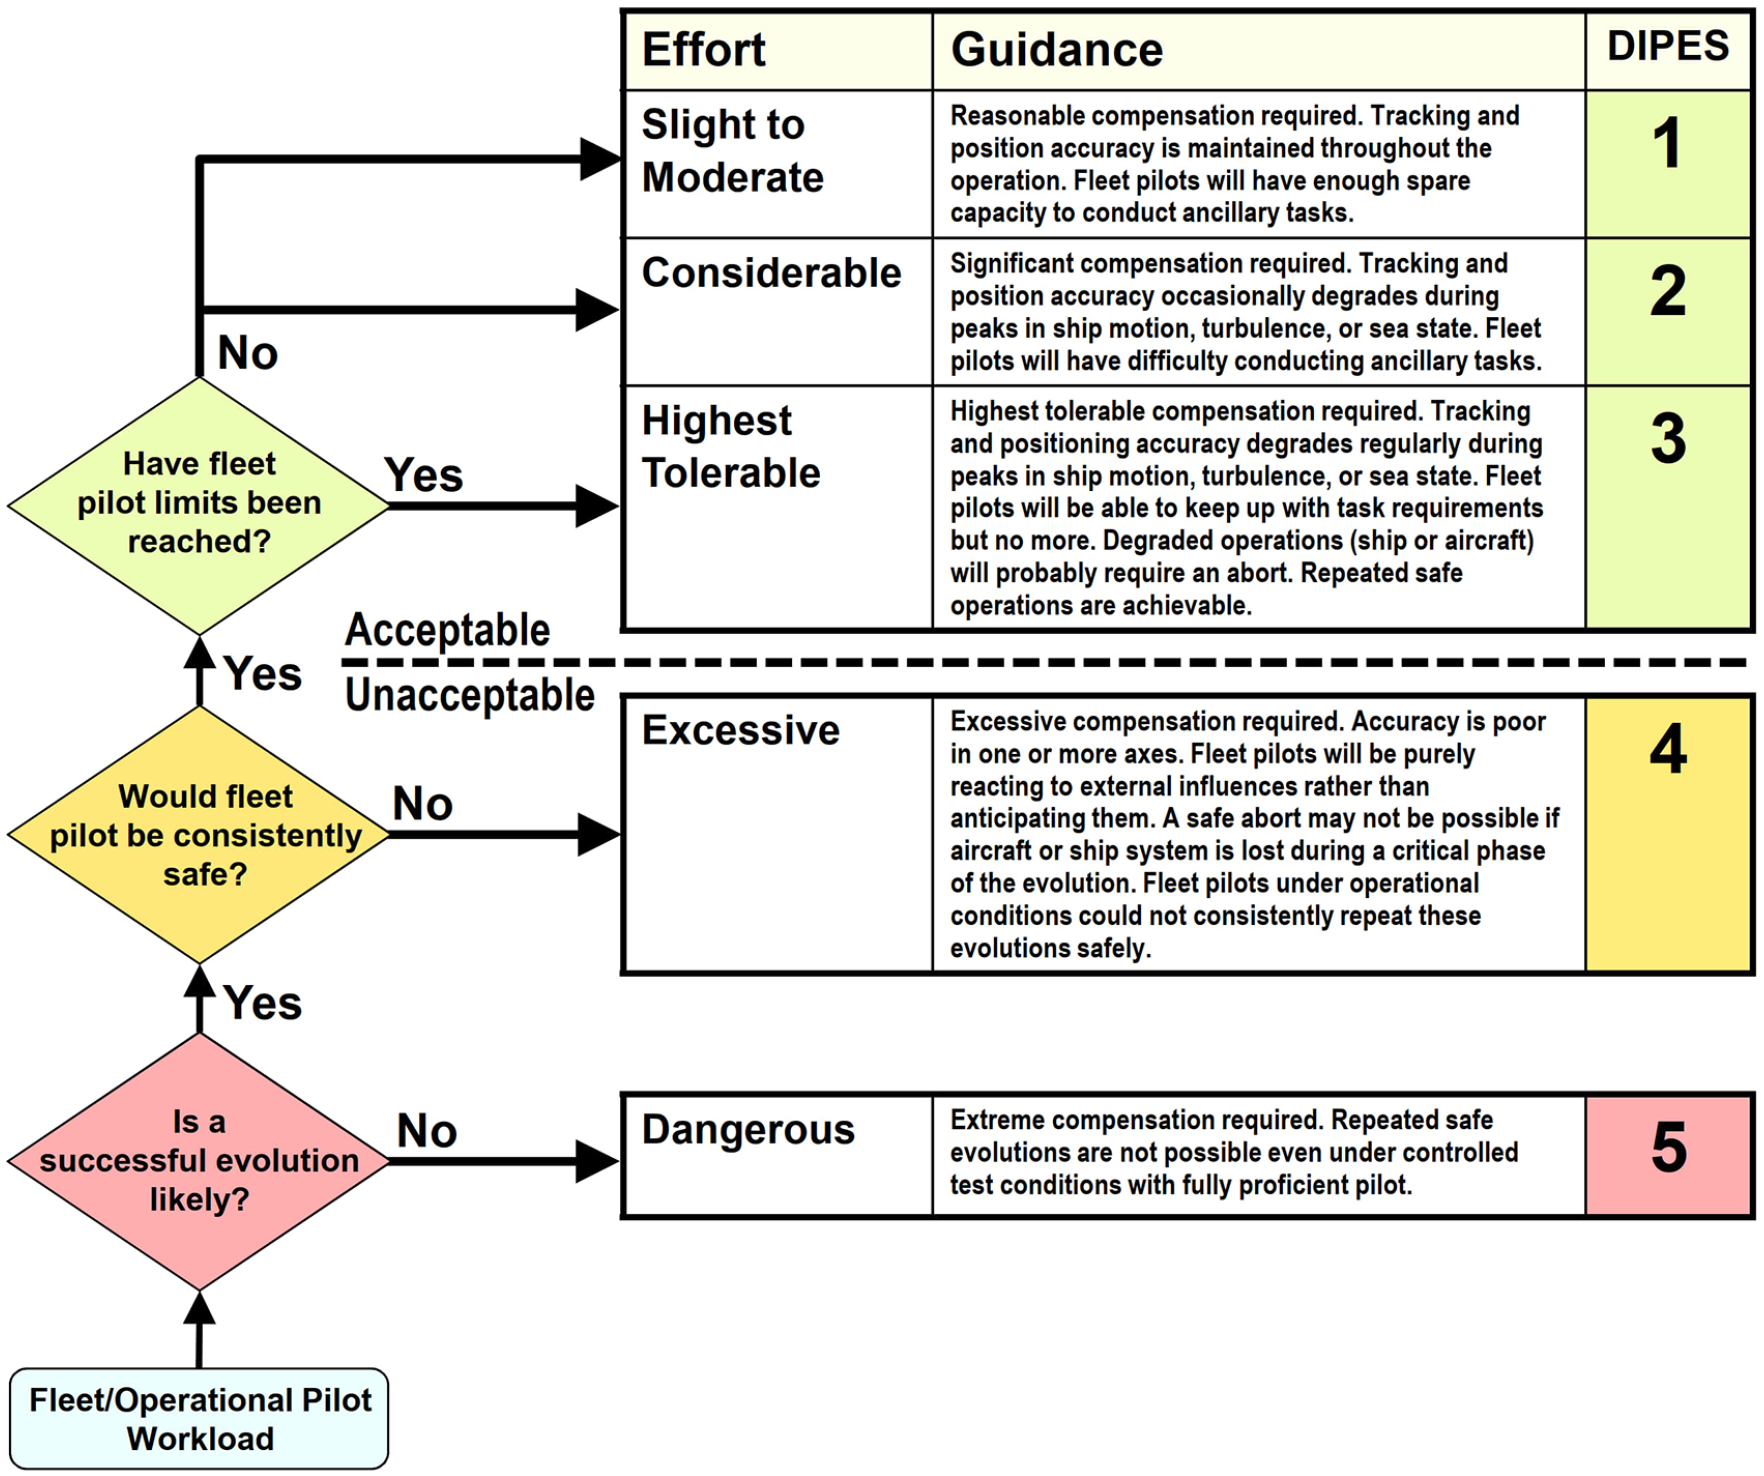
DIPES rating scale.
An aircraft with a more advanced or specifically designed control system may have a wider envelope than one with a simpler control system owing to the fact that the control system absorbs some of the workload, allowing the pilot to handle more challenging conditions. Landing augmentation, such as a hauldown system, has a similar effect, allowing the pilot to handle more challenging conditions. For this reason, hauldown systems are generally engaged in higher sea states, when more relative motion and increased turbulence demand more of the pilot’s attention.
Pilot workload is a complex function in which the attentional demand of the pilot must take into account the task loading within differing channels such as visual, auditory, cognitive and psychomotor. In general terms, a pilot’s total workload can be thought of as a function of workload contributors given as follows:
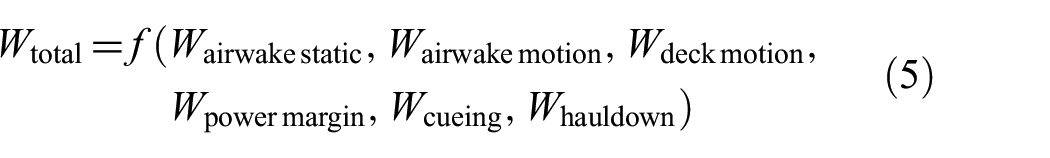
where, Wairwake static is the workload due to the baseline turbulence present in the airwake of a ship that is static (not undergoing ship motion) including the workload associated with flight in free stream air (before encountering the ship airwake); Wairwake motion is the workload due to additional unsteadiness imposed on the airwake by the ship motion; Wdeck motion is the additional workload caused by the fact that the ship is in motion, with respect to the need to follow deck motions to the extent required; Wpower margin is the workload associated with pilot management of the power margin (as power margin decreases, the pilot must attribute some capacity toward monitoring and management of power usage throughout position management); Wcueing is the workload associated with maintaining accurate position using sensory references; Whauldown represents the relief in workload associated with the stabilization of a hauldown type device.
Each workload term, W, is given as a DIPES contribution to the total workload, Wtotal. In some cases, the predominant workload variables may be Wairwake static and Wairwake motion, or in low cueing environments, Wcueing may be the predominant variable. Some workload terms affect the workload in other variables. For example, Wcueing and Whauldown affect the workload impact of the other terms. Although complex, future planned work will aim to identify the predominant terms in various conditions, and the association of the terms together.
Each DIPES rating can be appended with a suffix used to identify the cause of the increased workload. After a maneuver is completed (i.e., a take-off and landing sequence), the pilot provides a rating and also assesses the major workload contributors. Within the legacy DIPES rating scale, the suffixes are not clearly defined and therefore have led to different interpretation by pilots. For example, if the pilot’s workload was focused on lateral position maintenance due to inadequate visual cueing because of excessive sea spray, the suffixes may be L, V, and/or S from the legacy chart (not shown). 19 Although the use of the suffixes was technically correct, they may not have been consistently used by each test pilot. Therefore, it was difficult to determine an adequate link between factors in the analysis. NRC has repackaged the original suffixes into an improved list to represent the subjective comments of the pilot in a way that the combination of suffixes present a story of causes that can more readily allow the study and modeling of the terms in Equation (5). These NRC DIPES suffixes, listed in Figure 4, are defined as follows:
Workload in Position: Delta Hover Astern to High Hover (DH), High Hover (HH), descent from High Hover to Low Hover (LH), retrieving the hauldown cable up for a hover (CP), retrieving the HIFR hose from the deck (HP), HIFR hover position on port side ship (HF), and any other position noting deficiencies (O).
Control Axis: Lateral (R), Longitudinal (P), Yaw (Y), or Height (H) positioning: These suffixes are used to identify the execution of the task required pilot compensation to maintain position in a certain axis. Often the pilot will have compensation only in one axis; however, workload in multiple axes could be indicated.
Cause/Sub-Cause: The following causes could be attributing factors affecting pilot workload; Turbulence, Visual Cueing, Deck Motion and Power Margin. These factors should have associated sub-causes, which aid in documenting the root cause, as listed below. (a) Turbulence (T): Increased pilot compensation due to wind turbulence. (b) Visual Cue (V): Insufficient visual cues present within the pilot’s Field of View (FOV) to execute the maneuver successfully. Sub-causes could be Funnel Exhaust (X), Spray (S), Lighting (L), Markings (M). (c) Deck Motion (D): Deck motion is the major contributor to the compensation by the pilot. Sub-causes indicate the specific motion axis causing the workload; Deck Pitch (P), Deck Sway/Roll (R), Deck Yaw (Y), or Deck Heave (H). (d) Power Margin (C): If power margins are small, the pilot may devote a significant amount of pilot workload toward managing the power. If the pilot notes this as their significant workload, then the mean torque and peak/maximum torque should also be noted.
Clarifications: Where applicable, additional clarifications allow the details of the phenomenon to be indicated, such as SHOL turbulence rating scale, visual landing aids (VLA) rating scale or average and peak torque which can be presented in a scale as well.
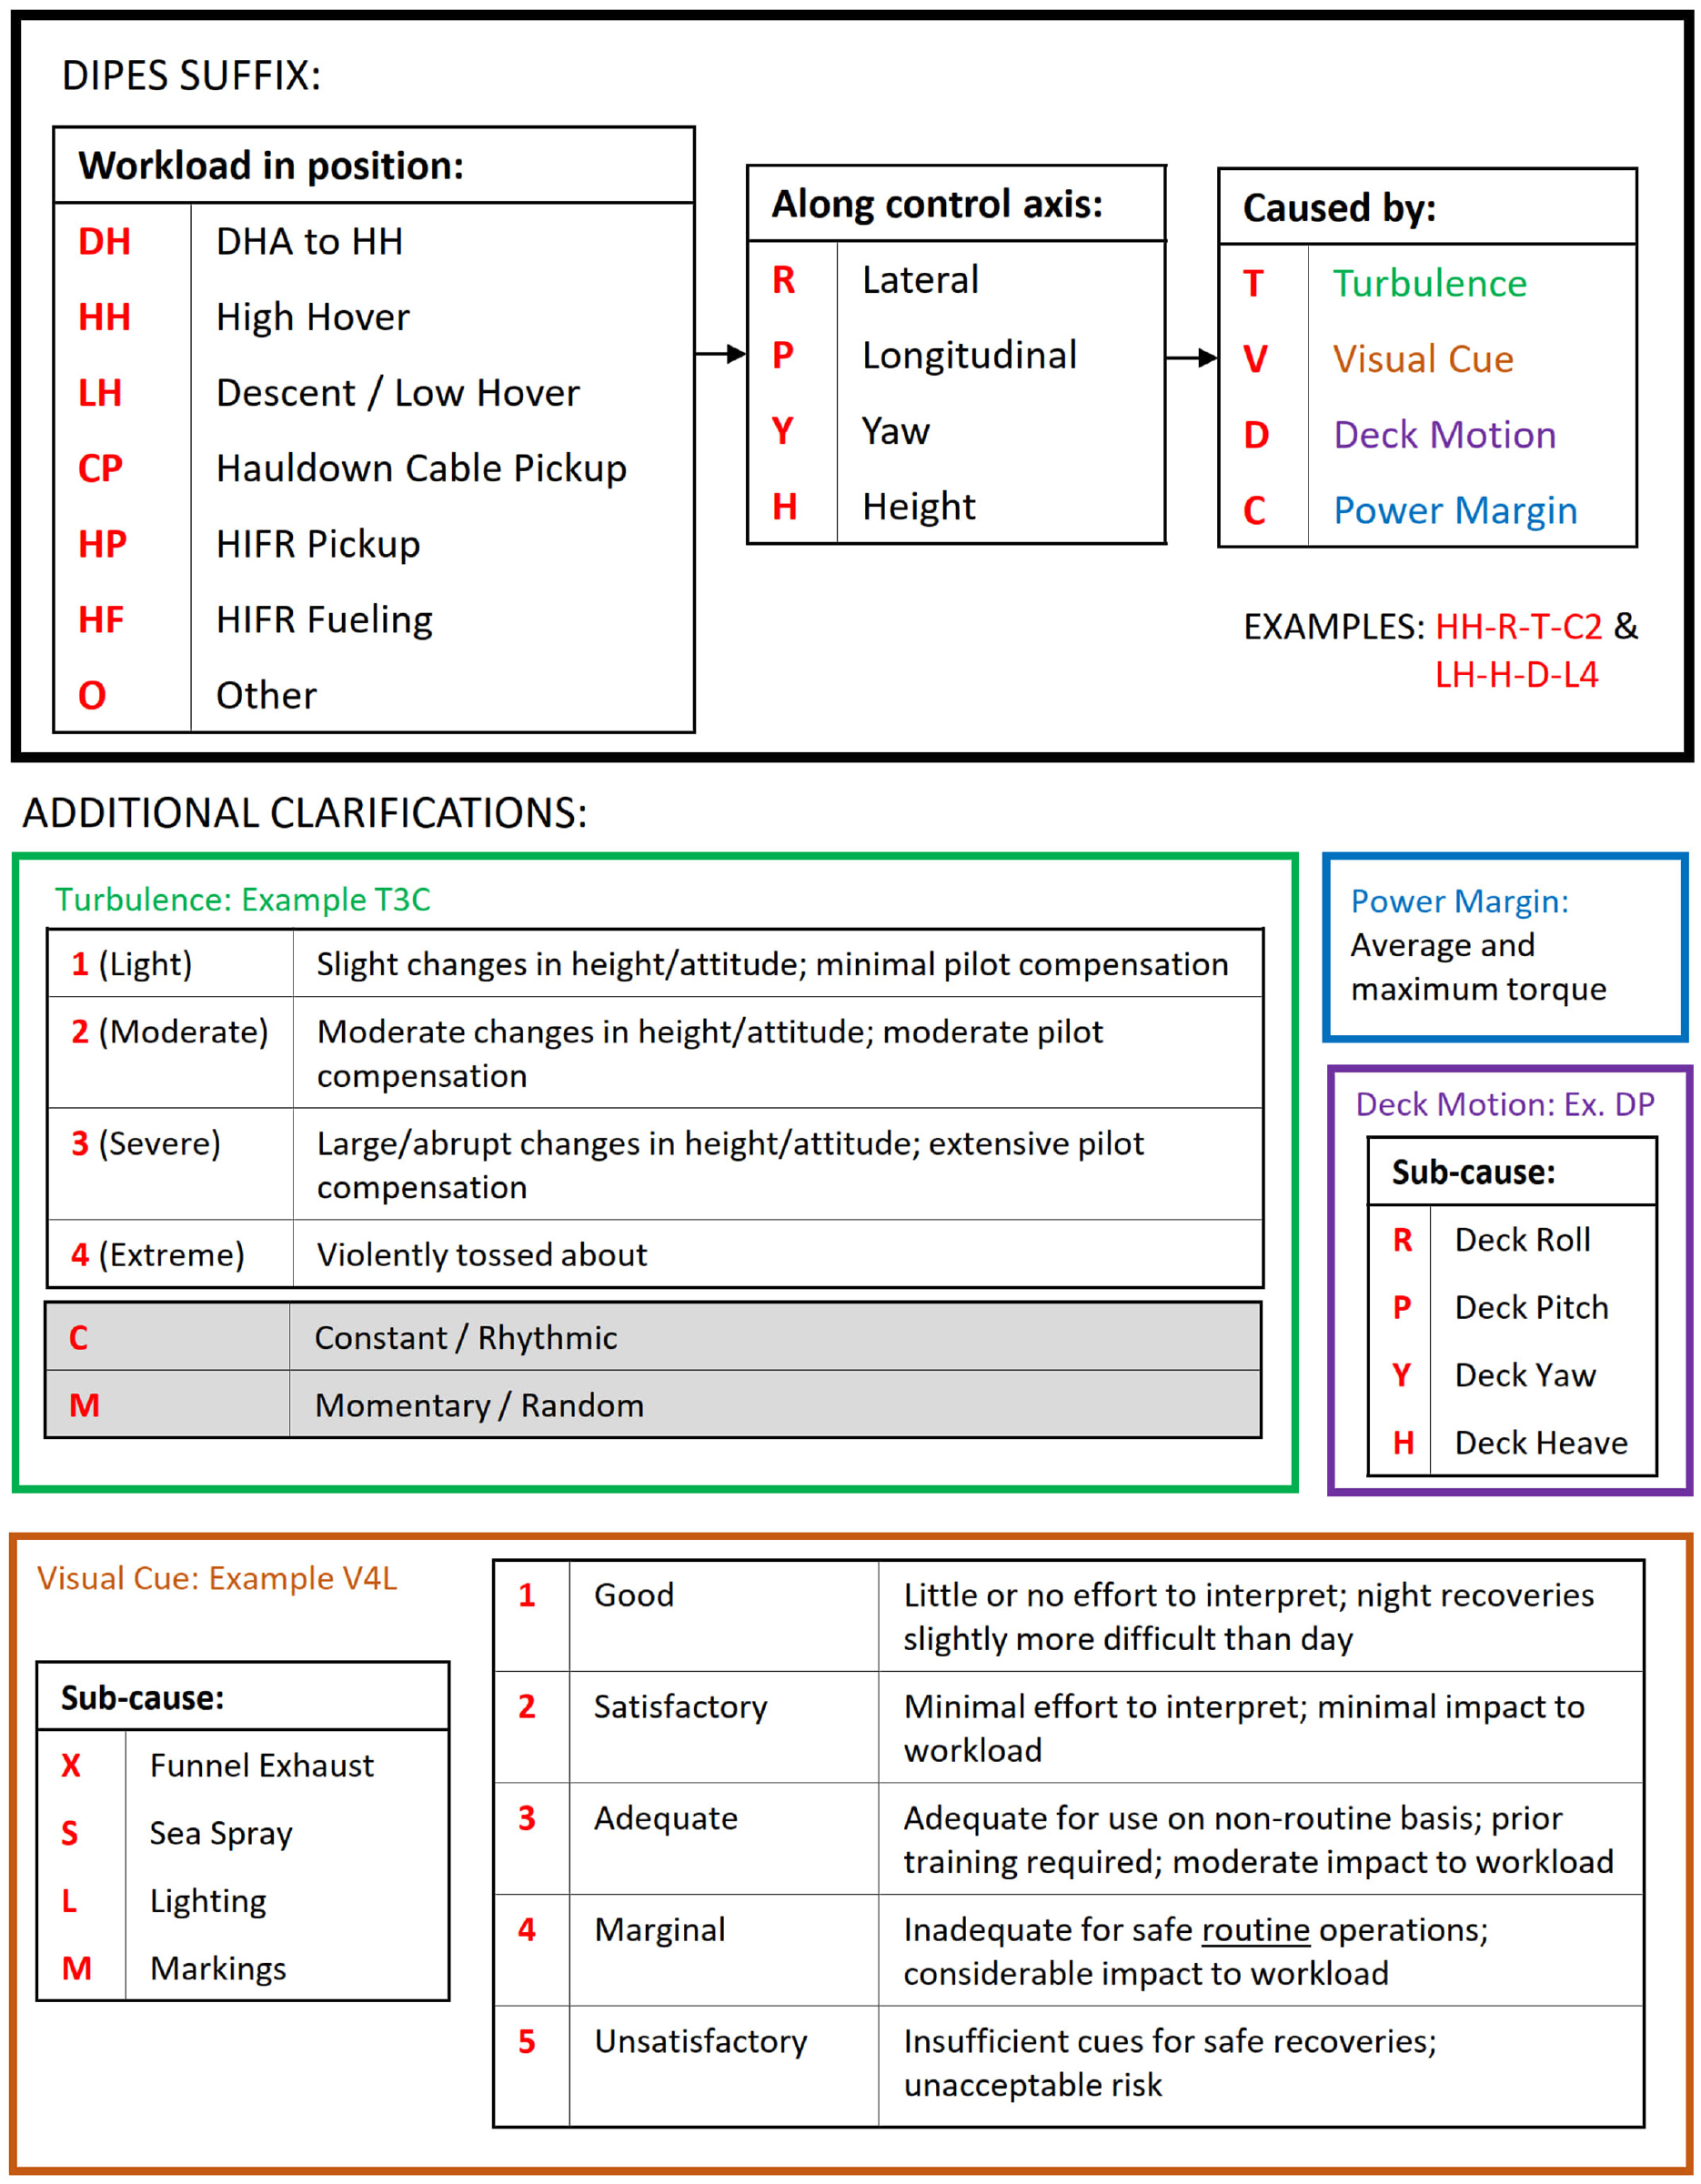
NRC DIPES suffixes.
2.1.4. Limit contributions from ship airwake and motion
As discussed earlier, the environmental conditions associated with ship airwake and ship motions are both significant contributors to operational limits, which each contribute to a number of limit types.
Ship airwake can contribute to the following operational limits:
Turbulence induced by the ship airwake can increase pilot workload: Wairwake static
Superstructure-induced downwash can increase the power requirement: Pdownwash
Lateral flows through the tail rotor affect pedal control margin and power management: Γpedal, Plateral flow
Ship motions can contribute to the following operational limits:
Ship motions can contribute to a more dynamic ship airwake in which the aircraft must operate: Wairwake motion
Ship motions can contribute to increased pilot workload associated with trying to maintain position relative to the ship: Wdeck motion.
Ship motions, particularly flight deck accelerations (FDAs), may be limited in order to prevent potential damage (such as to the landing gear) during recovery: Γstructure.
Ship motions, particularly FDAs, may be limited in order to prevent the aircraft from slipping or tipping while on the deck. This is especially important if the aircraft is either not secured or minimally secured: Γdeck motion.
3. Direct and indirect simulation and modeling approaches for the studyof SHOL
Using modeling and simulation to predict or study conditions leading to a possible operational limit requires that the output of the simulation be analyzed in the context of quantities that matter for operational limit determination. Table 1 introduced such a classification for different types of modeling and simulation (M&S) approaches, depending on whether a metric is measured directly or indirectly (i.e., derived quantity).
“Direct simulation” means the simulation directly generates the analysis quantities of interest. In this case, the simulation output is known as a “direct metric,” which represents a prediction for the quantity in reality.
“Indirect simulation” means the simulation produces a quantity that is related to, but not the same as, the quantity in reality; this indirect quantity is known as an “indirect metric.” For indirect simulation, the relationship between the prediction and indirect metric must be known for the simulation to be useful. Indirect metrics often involve modeling only parts of a system which are easier or less expensive but still useful for analyzing specific aspects of the problem.
Direct and indirect metrics are created and analyzed using a similar process. The difference is that indirect metrics are used to compare different but related simulated and real quantities, whereas direct metrics compare the same simulated and real quantities.
In general, direct measurements from validated M&S tools are best. However, some metrics are too difficult, complex, or expensive to measure directly with sufficient accuracy. Pilot workload is an example of a metric that is difficult to measure directly from simulations. Instead, more easily measured quantities such as wind speed, turbulence intensity, and/or ship motion might be generated using established M&S tools. These could then be used to indirectly estimate pilot workload for a given set of conditions.
An indirect metric requires that a reliable correlation function exists between the quantity of interest (e.g., pilot workload) and the quantity being measured (e.g., airwake turbulence). This relationship must be validated using data sets where both were directly measured, such as from real-world flight test data.
The NRC and DRDC use a combination of direct and indirect metrics for the study of SHOL. The metrics currently used or under development, the simulation tools that allow their study, and the status of the development of each metric are given in Table 4. The NRC uses a comparative approach to improve the accuracy of the conclusions drawn using metrics. Legacy ship–helicopter combinations are used as a baseline, where those platforms are well-studied and the value of the metrics for them are well-documented. When the metric data are collected for new ship–helicopter combinations, the metrics are compared with the known platform combination, and the change in the metric is used to draw conclusions about the new platform combinations compared with the known baseline. The M&S approaches used by NRC and DRDC are grouped together under an umbrella term of SHOL Analysis and Simulation (SHOLAS).
SHOLAS simulation metrics.
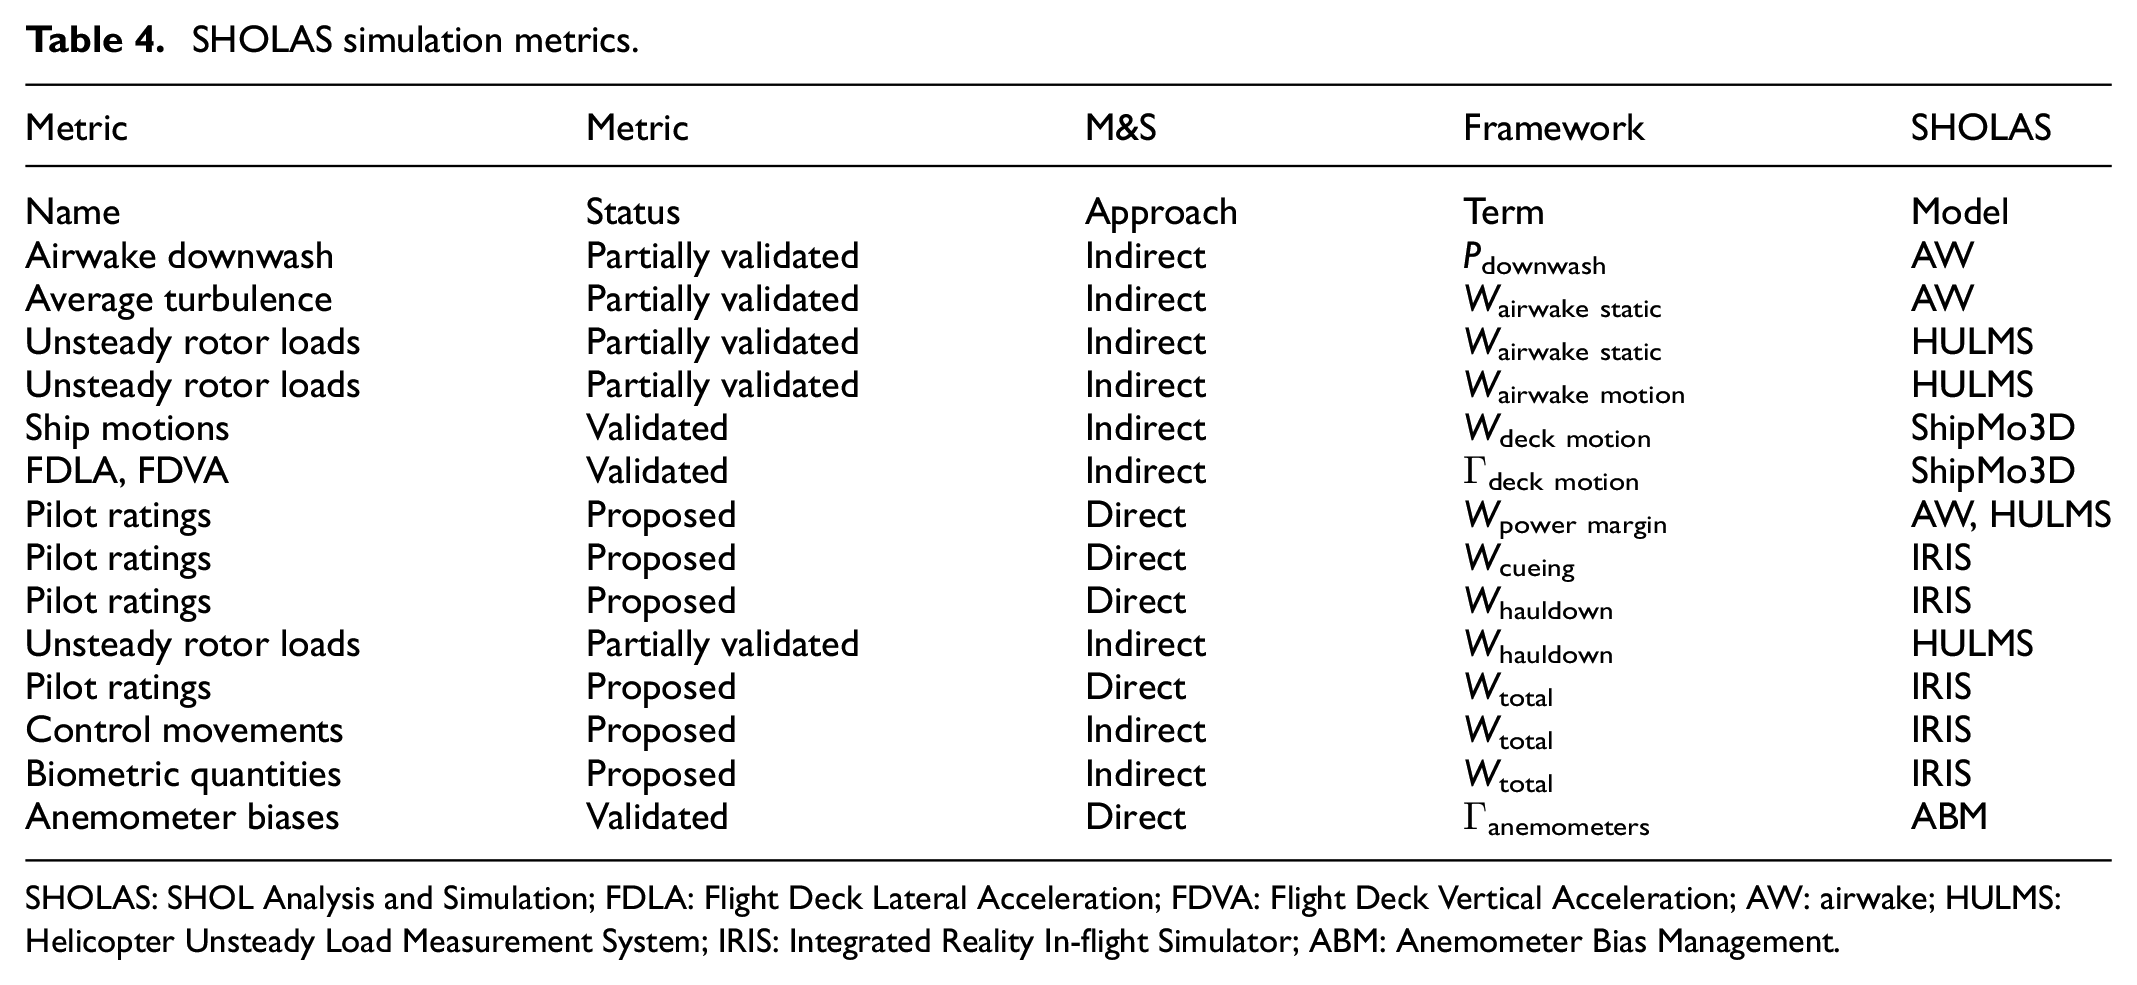
SHOLAS: SHOL Analysis and Simulation; FDLA: Flight Deck Lateral Acceleration; FDVA: Flight Deck Vertical Acceleration; AW: airwake; HULMS: Helicopter Unsteady Load Measurement System; IRIS: Integrated Reality In-flight Simulator; ABM: Anemometer Bias Management.
As the simulation tools improve and more validation data become available, it is anticipated that it will be possible to develop metrics for the other elements of the framework equations. The terms defined previously that are in the early stages of being investigated as metrics are as follows: Γcontrol, Pexhaust gases, Plateral flow, Pmomentum deficit, and Pground effect.
Currently, there are five modeling and simulation tools in development and in use at DRDC and NRC, which are described in detail along with the metrics that they provide in the subsequent sections:
ABM;
Helicopter Unsteady Load Measurement System (HULMS);
Airwake (AW);
IRIS;
Ship motion prediction software (ShipMo3D).
3.1. ABM
The NRC and DRDC have developed a suite of ABM tools which are currently being applied to existing and future Canadian ships. 20 Generally speaking, the use of two anemometers results in full coverage of the azimuthal range where wind can be accurately sensed for all conditions provided the appropriate anemometer is selected. In some circumstances, certain parts of the azimuthal range may not be reliably reported by any anemometer. In this case, an operational limit with respect to Γanemometers would need to be defined.
One tool in the ABM toolkit is to use experimental anemometer bias assessments completed at model scale in a wind tunnel setting. At NRC, this type of testing is conducted using the setup shown in Figure 5, using a fast-response four-hole Cobra probe 21 suspended above the ship model at the location of the anemometer. The Cobra probe is located at the center of rotation at the turn table, and the ship model is rotated 360° around it. This way, anemometer biases can be quickly characterized for the full azimuthal range.
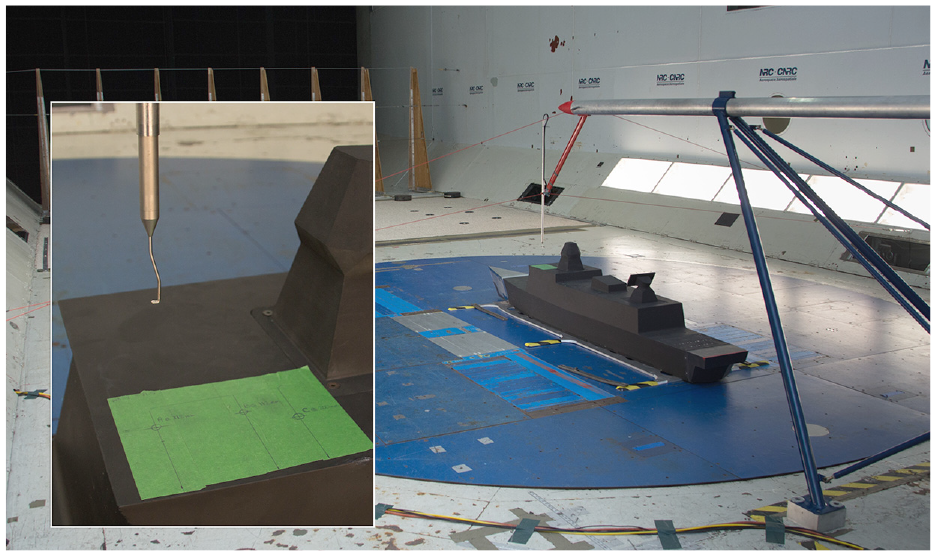
Wind tunnel setup for anemometer bias management and flow assessment on the Generic Destroyer (GD) model in the NRC 9 m Wind Tunnel. Inset shows the Cobra probe in position to measure anemometer bias.
The primary metric in Canada for defining the useful range of anemometers is the amount of turbulence induced by the ship superstructure. Turbulence levels on the order of the freestream generally indicate reliable anemometer readings whereas elevated turbulence levels generally indicate a significant and unstable impact of the superstructure on the flow. Flow speed bias is also considered, where significant momentum deficit (flow slowed compared with the freestream) is an indicator that an anemometer cannot make a reliable measurement. In general, a significant flow deficit at an anemometer location is often accompanied by high turbulence levels.
3.2. HULMS
Ship motion and ship airwake have long been identified as two of the major contributors to pilot workload during launch and recovery operations. The airwake generally affects limits for RW directions around headwinds, where the helicopter is required to operate in the wake of the ship. The range where the ship airwake has a significant impact on operational limits depends on a number of factors including superstructure size. This range could extend up to 60° on either side of headwinds.
Starting in the 1990s, NRC and DRDC developed a wind tunnel technique for assessing the impact of airwake turbulence on pilot workload.22–24 The HULMS simulation tool provides unsteady loads which have been investigated as indirect metrics compared with pilot ratings of workload for those real test conditions where airwake turbulence significantly influences the pilot rating.
A typical HULMS setup with a static ship model is shown in Figure 6(a), where an instrumented 1:50 model-scale helicopter rotor is mounted in the wake of a model-scale ship. The helicopter and ship shown in Figure 6(a) are exposed to representative RW speed and direction conditions, in the presence of a simulated Atmospheric Boundary Layer (ABL). Unsteady loads on the model-scale rotor, and sometimes on the fuselage (not shown in Figure 6(a)), are recorded for different RW conditions. The unsteady loads are reported at full-scale values based on a scaling methodology using disc loading. 24 The instrumented rotor only is exposed to the airwake for HULMS measurements with a ship in motion, as shown in the wind tunnel setup in Figure 6(b).
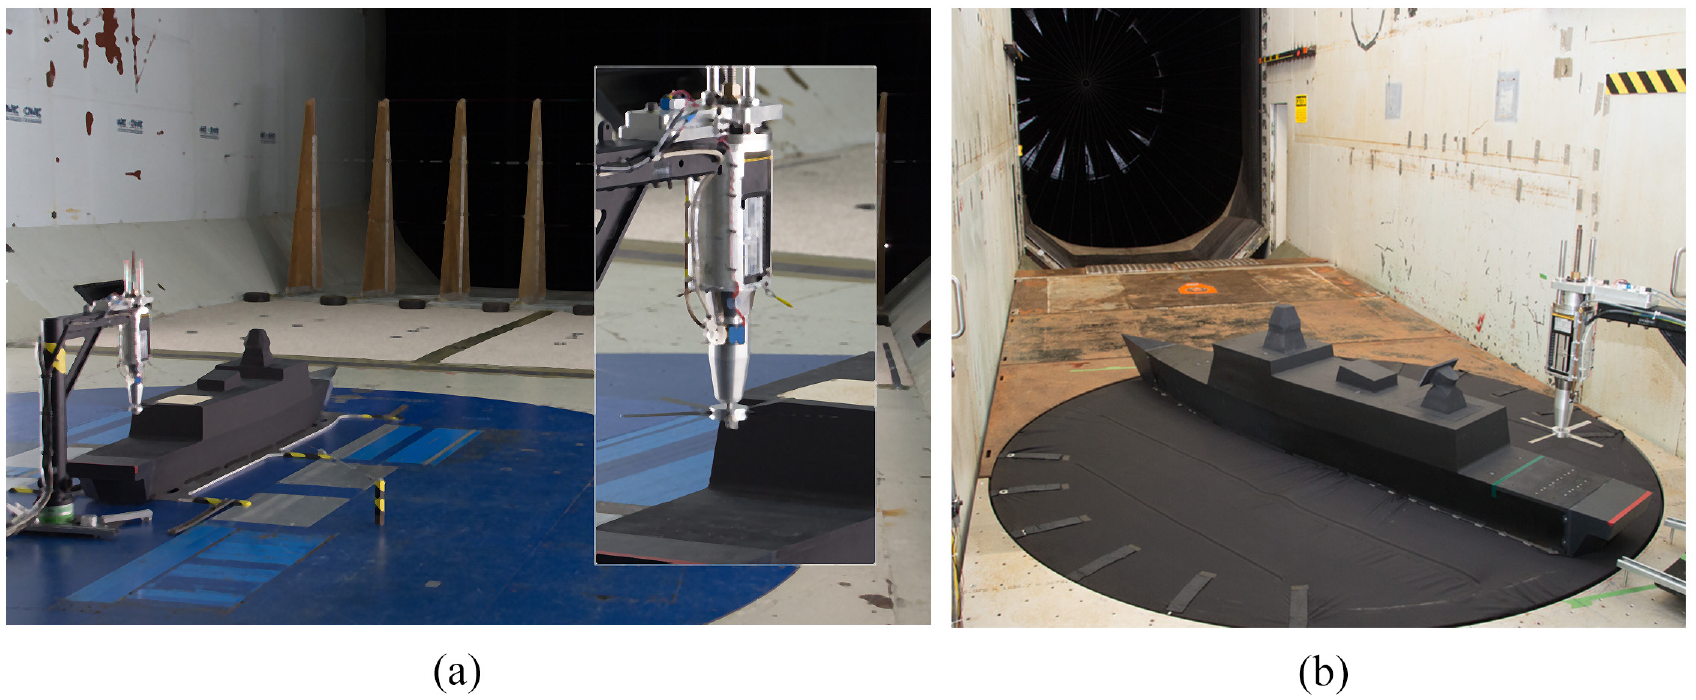
Wind tunnel setup for HULMS measurements. (a) Setup for the Generic Destroyer (GD) model in the NRC 9 m wind tunnel. Inset shows the main components of the HULMS. (b) Motion platform setup for HULMS measurements on the Generic Destroyer (GD) model in the NRC 3 m × 6 m wind tunnel.
The HULMS leverages expertise at the NRC in model-scale aerodynamic testing, and has a simulation advantage over many of the simulation types shown in Table 1 because the ship airwake and rotor downwash are naturally coupled through the correctly scaled simulation mechanism.
The HULMS system produces the following unsteady loads: fuselage forces in the fore/aft and lateral directions, fuselage moments about all three axes, rotor moments about the two horizontal axes, and rotor thrust. Although all loads have been considered as candidate metrics, to date, only unsteady rotor thrust has shown a recognizable correlation with pilot workload.
24
The unsteady rotor thrust metric used in the analysis is normalized by the weight of the helicopter
Using the CH124 Sea King flight trial data aboard the HALIFAX-class from the 1990s, a recognizably linear relationship between
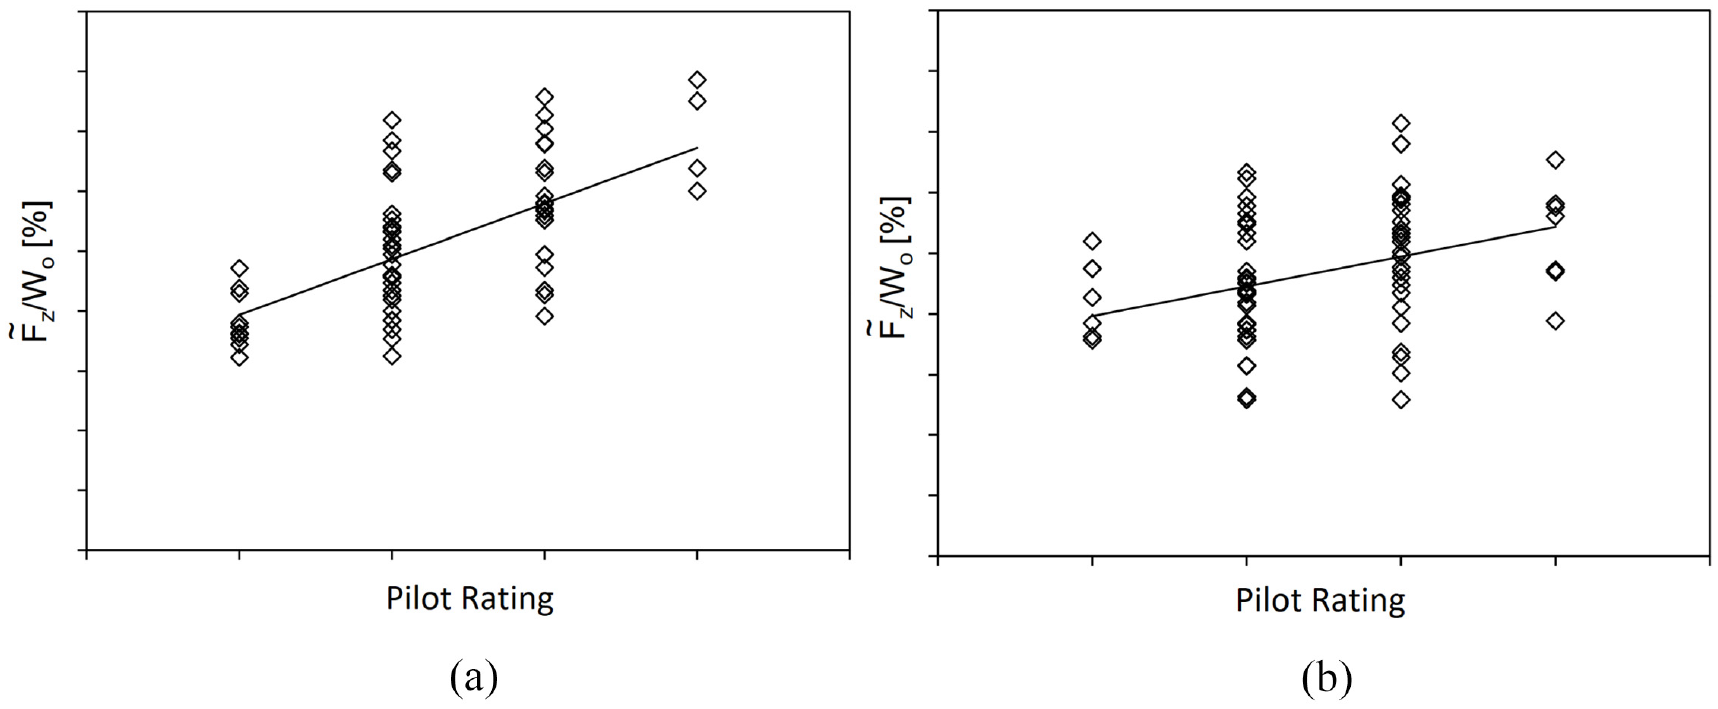
Effect of landing type on
Using this single metric, however, useful insights can be obtained. For example, the hauldown cable reduces the amount of additional workload caused by turbulence, which can be seen by comparing Figure 7(a) and (b): note in the comparison that the figure axes are the same for the two plots. Also, additional analysis revealed that sea states above 4, as defined by the test crew at the time, led to a breakdown of the observed relationship, meaning the
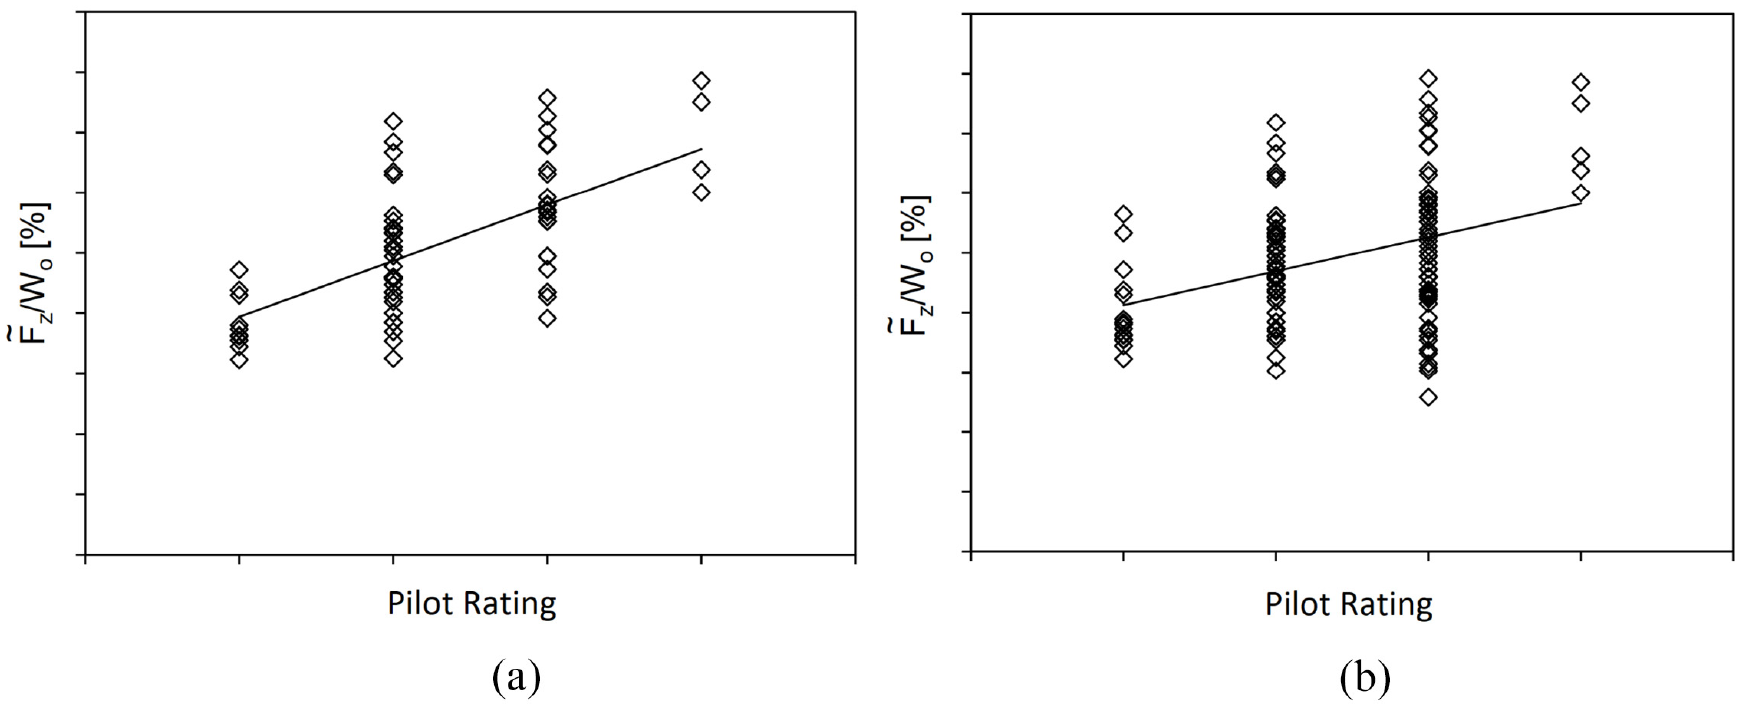
Effect of sea state on
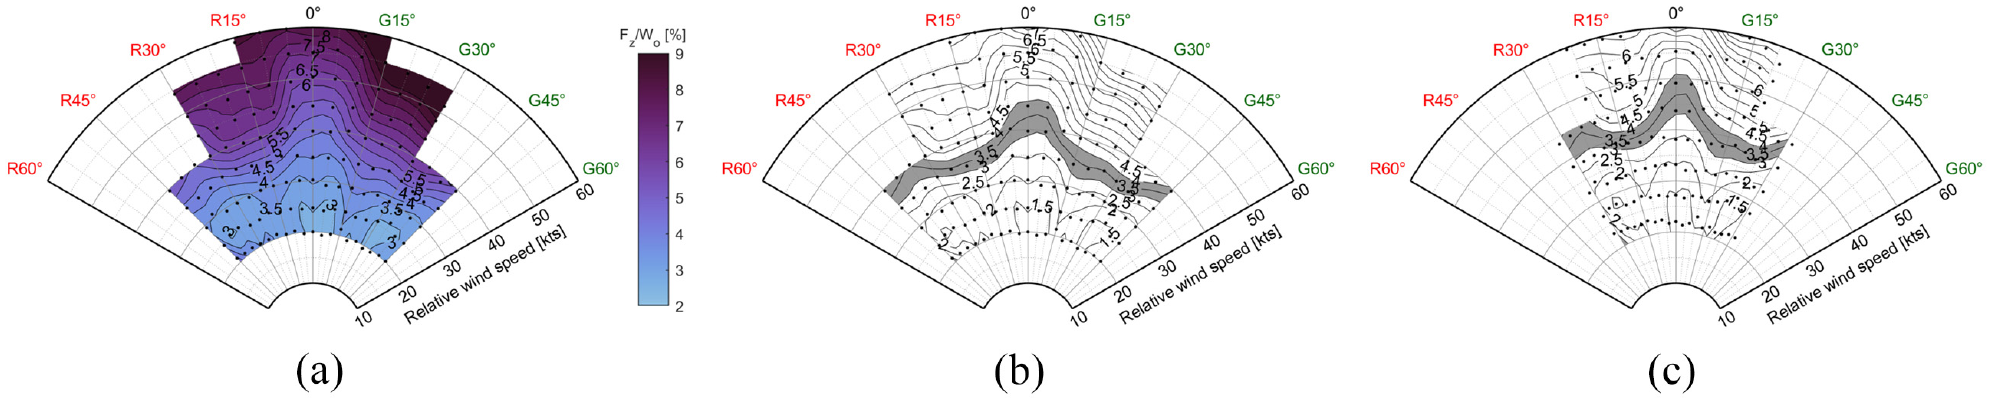
For low sea state cases, conditions for which the ship motion does not significantly contribute to workload, the pilot workload was assumed to be linearly correlated to
where the constants ba and ma resulted from a regression fit of the experimental and flight test data used to tune the metric. The subscript a refers to the fact that the metric evaluates the effect of airwake.
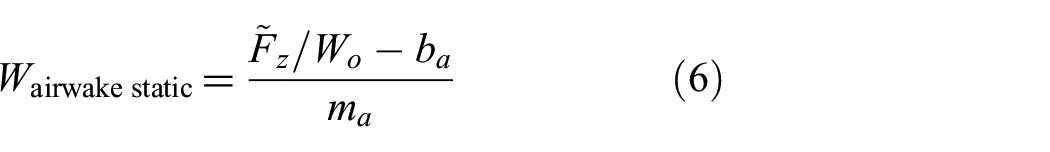
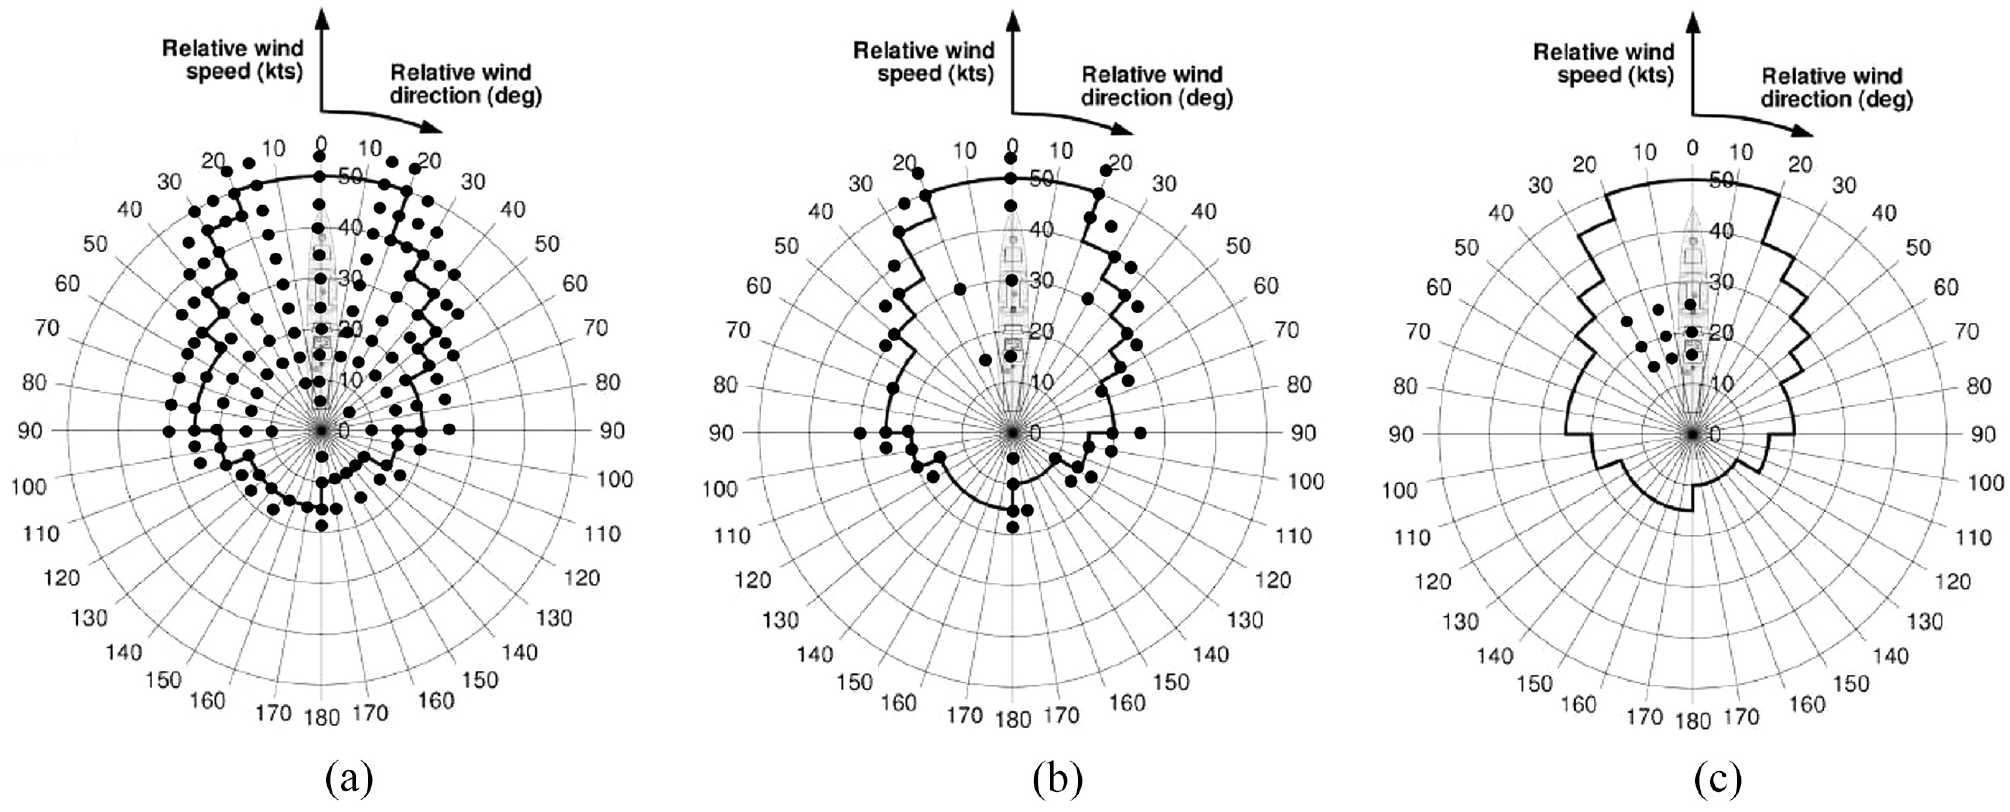
The true value of this type of model is shown in Figure 9, where unsteady loads measured behind a model of the publicly available Generic Destroyer (GD) ship geometry9,25 for a range of wind speeds and directions are shown in Figure 9(a). These measurements are then converted to equivalent Wairwake static ratings through Equation (6) using fitted values for a fictional helicopter of ba = 1.0 and ma = 1.5. This conversion is shown in Figure 9(b). A final conversion is required to account for the fact that the flow measurements on the ship are distorted by the ship superstructure. This step is required because the HULMS data are collected relative to the undistorted wind conditions, which are not available on board the ship.
Process for using unsteady loading metric to inform FOCFT using Equation (6). Actual DIPES ratings do not exceed 5.(a) Unsteady loading metric (color map from Thyng et al. 25 ). (b) Equivalent workloads (DIPES scale) using Equation (6). Wind reference: undistorted wind. (c) Equivalent workloads (DIPES scale) using Equation (6). Wind reference: anemometer readings.
Unpublished anemometer bias results for reasonable anemometer locations aboard the GD were used to develop a relationship for the anemometer biases on this ship. The result of converting the predicted Wairwake static components to the wind frame as measured on the ship are shown in Figure 9(c). The results in Figure 9(c) do not represent a predicted DIPES rating for a new flight test point; however, they could inform pilots on the potential variation in workload due to airwake.
The Sea King data from the 1990s was an important step in the development of the
In the 2010s, FOCFT for the CH148 Cyclone allowed such further development and provides an example of how improvements to flight test data allowed measurable improvements to the predictive capabilities of the M&S tools, including the addition of ship motion effects.
The switch from PRS to DIPES for recording pilot comments for the CH148 Cyclone flight trials allowed the test points to be grouped more appropriately into those highly influenced by ship airwake, although the application of the existing DIPES suffixes has some challenges as already discussed. In addition, better information about ship motion conditions was available, which allowed the investigation of the use of the
The new flight trial data were sorted, in addition to with and without the hauldown system and ship motion conditions, for day/night unaided/night aided conditions and also by flight control mode. The following conclusions are suggested by the analysis:
The characteristics of the metric relationships are largely driven by the helicopter; therefore, a relationship must be defined for each helicopter for which the metric is required. Likewise, the relationship changes for different flight control modes and visibility conditions.
The hauldown cable was approximately found to relieve pilot workload by a consistent amount on the order of one DIPES point (this relationship requires a more detailed investigation since the Sea King analysis suggested a change in the slope of the relationship). The Cyclone analysis suggested that the constant workload relief provided by the hauldown cable is largely independent of flight control mode, day/night, and ship motion.
With the analysis of the Cyclone data, the
The Cyclone data also enabled a more detailed look at ship motion. From the sea trial data provided, maximum ship pitch (θ), maximum ship roll (ϕ), maximum Flight Deck Vertical Acceleration (FDVA), and maximum Flight Deck Lateral Acceleration (FDLA) encountered during each recovery were provided for each test point. The quantities were then compared with wind tunnel experimental data collected while the model ship was in motion. The experimental setup for the motion tests is described by Wall et al. 14 for airwake flow measurements, and the same setup was used to collect HULMS data for ship motion conditions. The potential for using simulation data from HULMS with and without ship motion effects considered was done by comparing flight trial data with HULMS data. This experimental setup was previously shown in Figure 6(b).
Referring to Equation (5), the various contributions of the terms Wairwake static, Wairwake motion, and Wdeck motion to pilot workload are unknown. Physically, the terms Wairwake static and Wairwake motion have a high probability of being captured by HULMS, which focuses on airwake effects. However, the pilot ratings for high sea state test points in the absence of significant power margin, visibility or cueing impacts, by nature contain all three terms. It currently remains to be seen whether the impacts of Wdeck motion are indeed separate from Wairwake motion or whether a single Wmotion term is sufficient in all practical cases. Equation (5) reveals a complex interaction of workload terms where the study of any individual contributors is likely to be incomplete and yield a suggestive model rather than a deterministic model. Nonetheless, the study of simple metrics for complex systems can reveal useful conclusions. Here, the effects of motion and the potential of HULMS metrics are examined in order to lend insight into the development of more complex models, potentially through the IRIS technology, which will be described in detail later.
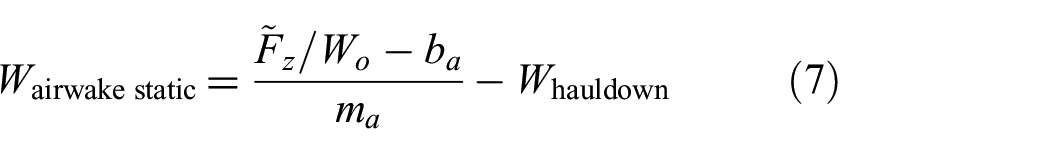
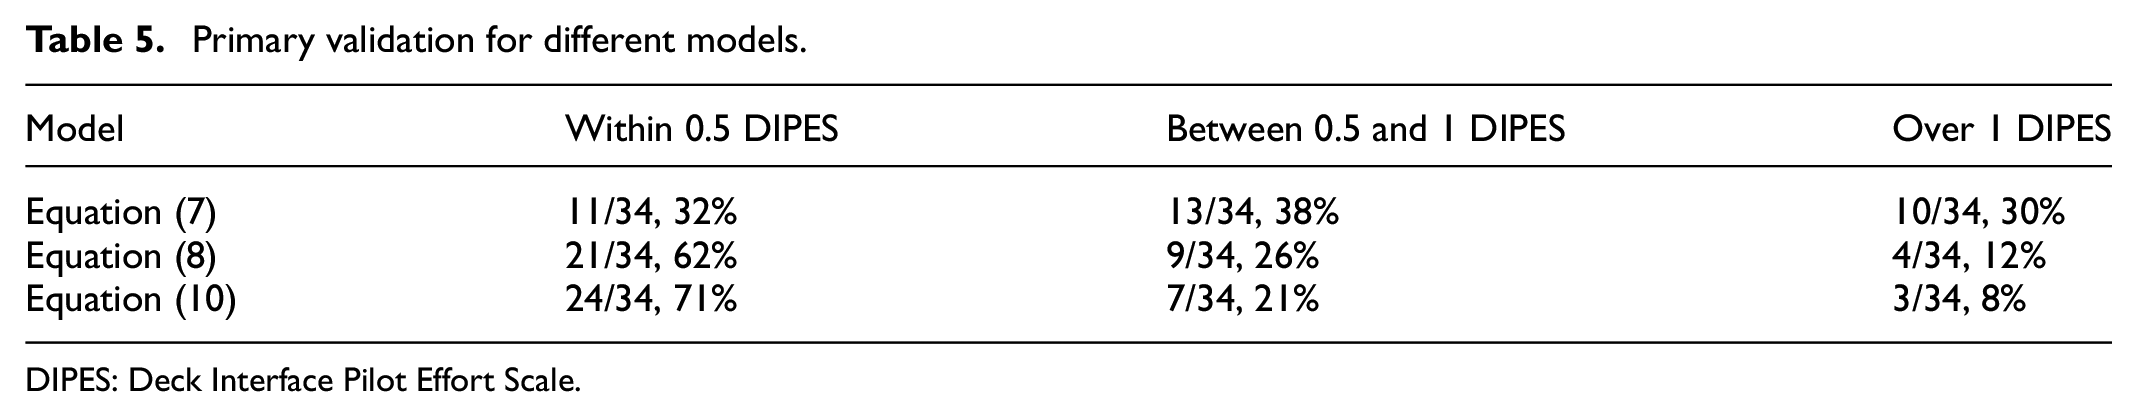
Three candidate approaches were taken for assessing HULMS-based metrics in ship motion conditions. The first approach was to apply Equation (7), developed for the low sea state conditions, directly to the cases with higher sea states. Of 34 validation flight test points in various sea state conditions, 11 were predicted to be within 0.5 DIPES of the actual pilot rating, as shown in Table 5. The low success of this approach was anticipated, given the previously highlighted conclusion that metrics for low sea states are not applicable in high sea states.
Primary validation for different models.
DIPES: Deck Interface Pilot Effort Scale.
The second candidate equation explored the idea that airwake and motion effects combine into a single model where the impacts are correlated to the
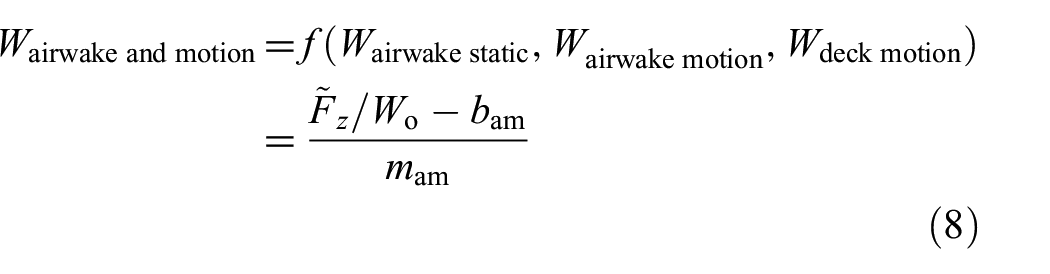
where the fitted slope and intercept values are unique for motion in a given range. Of the 34 validation flight test points, 21 predicted the pilot rating within 0.5 DIPES using this model as shown in Table 5.
The third candidate equation considered the possibility that the two motion terms can be superimposed on the Wairwake static term as follows:

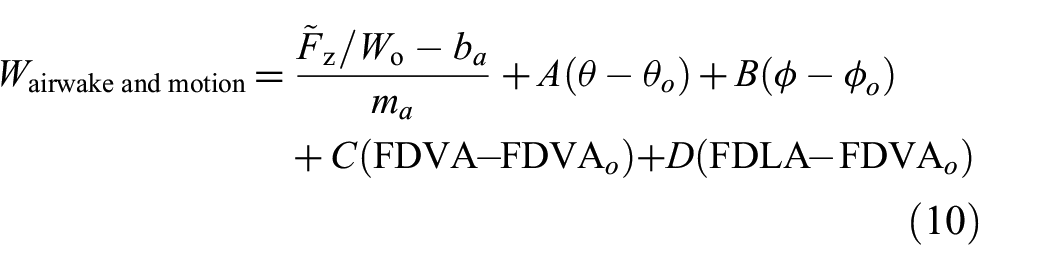
where the motion terms were selected based on the motion information that was available for each flight test data point. The naught subscripts indicate the value for each parameter below which they do not appreciably affect airwake. For destroyer-size ships, motion contributions are effectively zero for conditions at Sea State 3 and below 15 . Using the flight test data, fits from the constants A through D were done using a minimization algorithm. This model represented 24 of 34 validation flight test points within 0.5 DIPES as shown in Table 5. The following conclusions are suggested by this analysis.
The model in Equation (8) reproduces the pilot ratings from the flight trial to a lesser degree than the model in Equation (9). Both show improvement over the model for Wairwake static alone as given by Equation (7).
Using the model in Equation (10) with the experimental and flight trial data, the value for A compared with B indicated that ship motion effects of pitch influence pilot workload to a much greater degree than roll. Comparing the values for C and D, FDLA influences pilot workload much more and FDVA. The relative impacts of deck angles and accelerations had been previously studied by DRDC27,28 with different conclusions; therefore, more analysis is required to fully appreciate the impact of ship motion on pilot workload.
An attempt was made to isolate the dynamic effect of motion from the airwake effect of motion using high sea state data points that were acquired at a low wind speed. While increases in lateral acceleration are clearly associated with increases in DIPES, no clear relationship for the effects of deck motion without wind could be identified using the available data.
The HULMS portion of a ship motion wind tunnel test conducted at NRC 14 showed that the impact of significant wave height of 2 m (comparable with Sea State 4) does not impart significant extra unsteady loading on the rotor, but for higher sea states, increased loading at the motion frequency can be seen for increasing motion amplitudes.
3.3. Airwake
Over the past decade, the use of measured or calculated airwake characteristics has also been explored as a more efficient (although possibly less representative than HULMS) method for determining preliminary SHOL envelopes. Airwake (AW) measurements are flow measurements taken in the wake of the ship, over the flight deck. These results can be generated experimentally using the same setup as shown in Figure 5 but with the probe over the deck, or using Computational Fluid Dynamics (CFD). An analysis of the average vertical turbulence intensity in the high hover rotor disc area has revealed a strong correlation to unsteady rotor thrust, as shown in Figure 10. This finding is intuitive because the comparative variation in
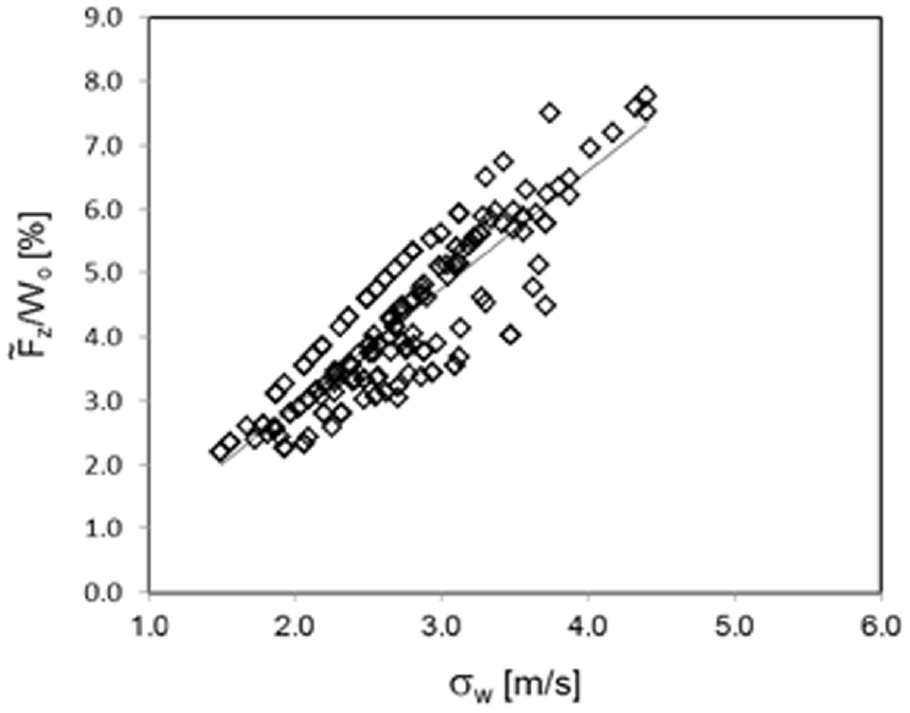
Relationship between the average vertical turbulent velocity components and the unsteady rotor thrust in high hover.
Wind tunnel airwake data can also provide insight into limits due to the aircraft capabilities, specifically Γpower and Γcontrol. The total power required during a maneuver is given in Equation (3), where Pdownwash represents an impact on available thrust due to the presence of superstructure-induced downwash. Superstructure-induced downwash can be expressed as the temporal mean flow pitch angle, which is an indirect metric for Pdownwash. Superstructure-induced downwash increases the power required to maintain hover; however, upward flow may reduce the power requirement accordingly.
As part of a previous unpublished study, the HULMS data and AW measurements were used to estimate the effect of superstructure-induced downwash on helicopter operations for ships with large superstructures, where the level of downward flow over the flight deck is much higher than smaller destroyers and frigates. Table 6 shows the superstructure-induced downwash for the same point at the approximate center of the rotor disc in high hover on four different ships. The GD is shown where the width of the GD hangar is used as a distance reference for the other ship dimensions. The downwash over three additional, tested ship geometries with the approximate relative sizes of the main superstructures given, along with the flow speed relative to the freestream and the superstructure-induced flow downwash. In the case of Ship 3, lifting deficits for medium-weight helicopters are expected to be in the order of several thousand pounds for this kind of flight deck flow.
Downwash angle for different superstructure sizes.
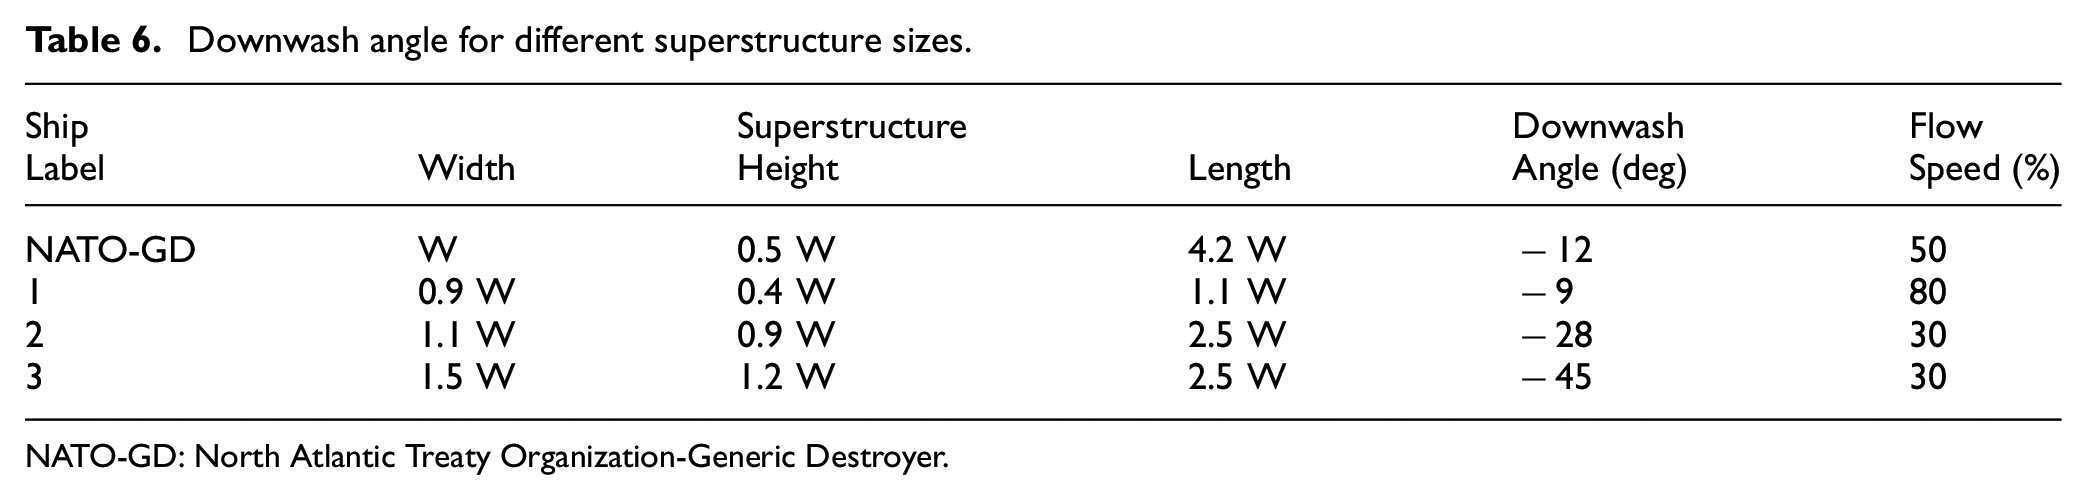
NATO-GD: North Atlantic Treaty Organization-Generic Destroyer.
Similar metrics could be used to represent a degradation in control margins due to the influence of airwake flows along any aircraft axis. In order to predict conditions for which aircraft capability limits would be reached, correlation models must be developed for each of the power variables.
3.4. IRIS
Many of the indirect metrics being explored using the HULMS and AW tools provide important insights into some of the physical factors at play and can be used to roughly predict how certain conditions may be harder or easier than others, considering a small range of changes in the test point, similar to such work as Memon et al. 29 More complete simulation tools, such as a piloted flight simulator, can allow the investigation of a more complex interplay of factors, provided the simulation includes reasonable models for each. The NRC has significant experience using fly-by-wire aircraft as a simulation platform for research purposes. Joining together in-house expertise in human factors and helicopter simulation, the IRIS concept is currently under development. The intention of the platform is to allow the specific study of the different elements in Equation (5) through the parametrization of the models used to create the shipboard environment. For example, inadequate visual cues inside and outside of the aircraft while flying at night typically increases one source of workload over a comparable day flight, which is captured in the form of the cueing term, Wcueing.
The IRIS platform utilizes a specialized research variable stability helicopter with the test pilot exposed to the visual shipboard environment using a Virtual Reality (VR) helmet mounted display as shown in Figure 11. A key component of the system is the safety pilot, who ensures the aircraft remains safe at all times while under the control of the test pilot. Although applicable to many other conditions, the flowchart focuses on flying in a shipboard environment. The simulation box represents the software used to represent the conditions for aircraft flight, such as environmental, ship design, and from those determining the ship’s relative conditions. Those conditions are replicated in a high fidelity VR environment displayed to the pilot through a helmet mounted display, which also has specialized head tracking hardware and software to permit precision head tracking in a moving platform. Given those environmental and ship conditions, actual ship motion and ship airwake data are processed into a 3D point cloud and the turbulence effects of the ship airwake are fed to the helicopter (real environment) using the fly-by-wire actuators commanded by NRC simulation software. The changes in the real environment give the pilot real proprioceptive, vestibular, and outside audio cueing. What the pilot experiences in the virtual environment now affects and changes the real environment which has been termed by NRC as Integrated Reality (IR). In this manner, the platform provides at high fidelity all the pilot cueing required to replicate more accurately pilot workload; therefore, pilot ratings, control movements, and biometrics can be used as candidate metrics to inform workload components in Equation (5). Once workload metrics are defined and validated, the IRIS platform could be used to limit predictions for new ships–helicopter combinations.
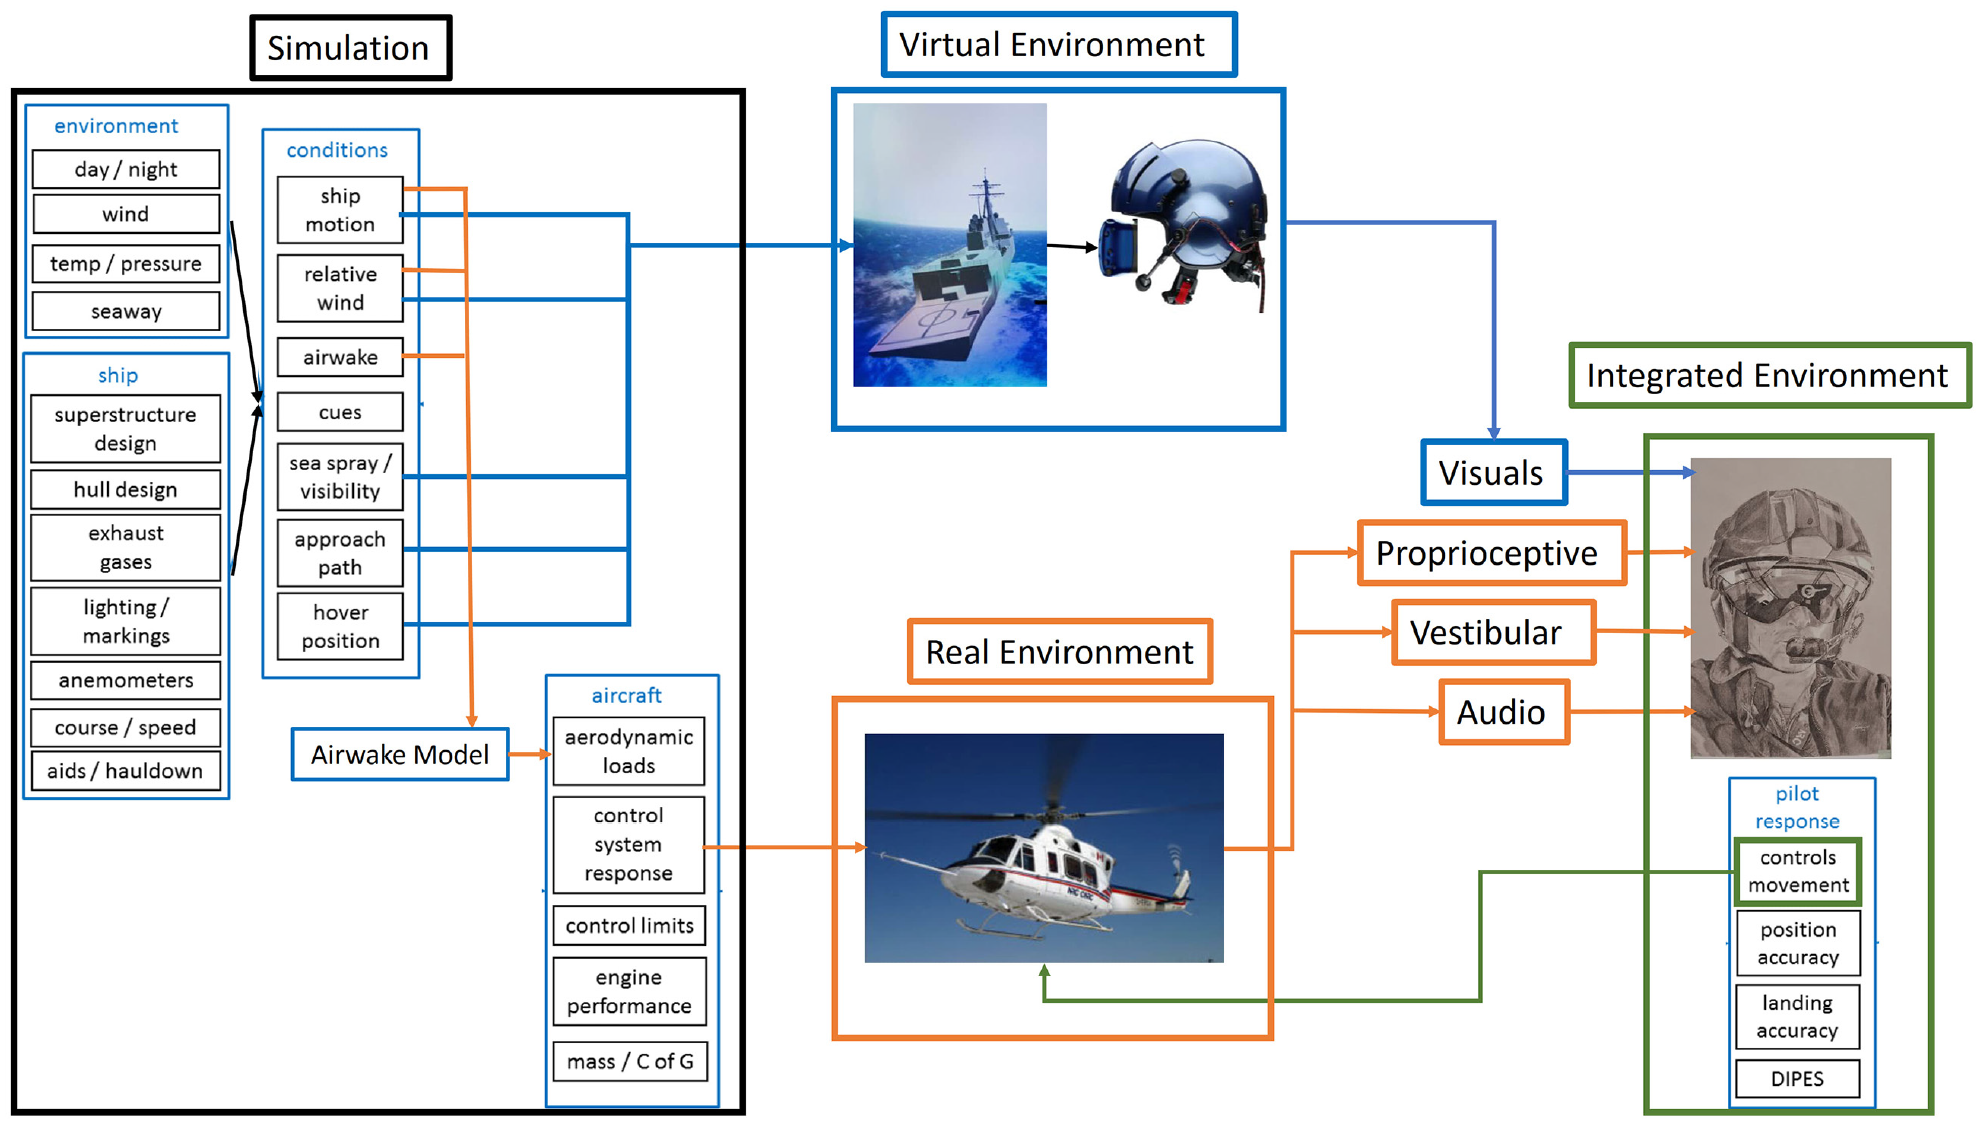
System flowchart describing the concept of IRIS.
Memon et al. 29 describe the use of a motion simulator which includes representation of additional sensory modeling elements, particularly vestibular and proprioceptive systems, which are important to increase the fidelity of the simulation and to successfully complete piloting tasks. The fidelity of the motion perceptual modalities are important to the overall accuracy of the simulation and an accurate reflection of the pilot’s workload. 30 The IRIS concept has potential advantages over fixed-based motion simulators because of its capability to provide actual proprioceptive, audio, and vestibular cueing from the variable stability helicopter; easily tunable and isolation of variables; and relatively low cost to operate and maintain. The technology has undergone feasibility and developmental flight trials, which have shown promising potential to fulfill the intension of the platform. In addition, for many piloting tasks, the IRIS platform has the capability to transform to any helicopter and flight environment through software changes (virtual environment, helicopter, and turbulence modeling).
3.5. Ship motion prediction
The six-degrees of freedom of ship motion are listed in Table 7 along with a brief description of how they might affect aspects of helicopter operations. These ship motions are defined as the oscillatory components resulting from the ship interacting with the sea waves.
Ship motion degrees of freedom.
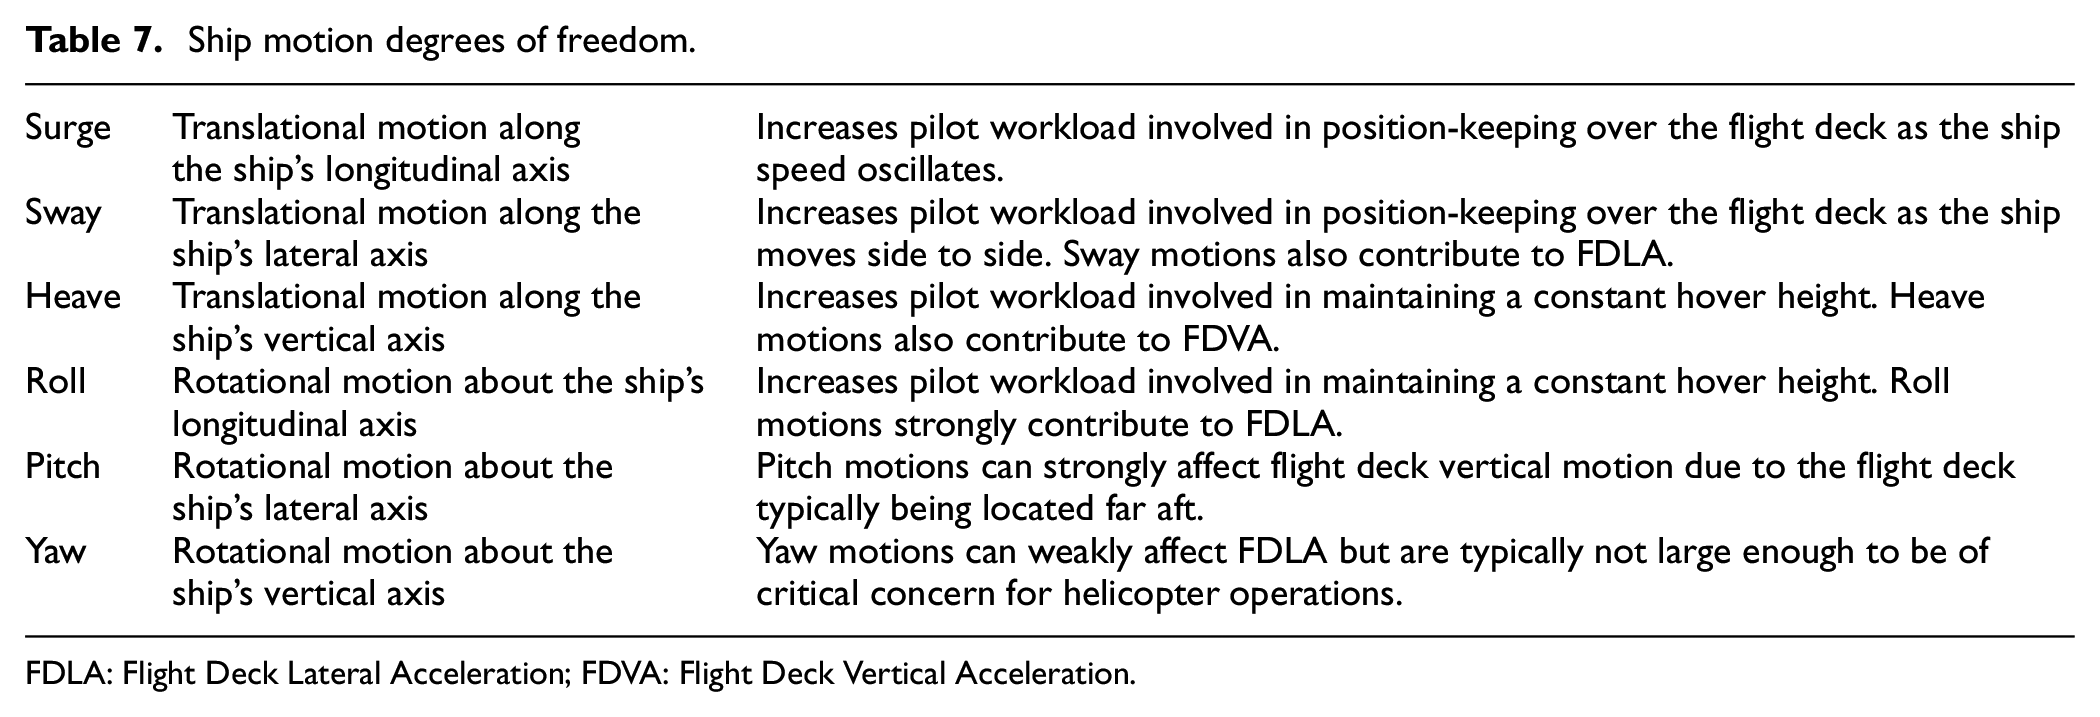
FDLA: Flight Deck Lateral Acceleration; FDVA: Flight Deck Vertical Acceleration.
FDA is measured at the center of the flight deck or Designated Landing Area (DLA). The past and present work done by DRDC and NRC has focused primarily on the vertical and lateral components of FDA, as the longitudinal component tended to be small by comparison.
FDA components have been shown to be critical parameters for helicopter operations. 28 They have been shown to contribute to pilot workload27,28 and directly affect dynamic loads of the aircraft when on deck. Work done by DRDC has shown that basing SHOL ship motion limits on FDVA and FDLA instead of roll and pitch angles can result in an increased operational envelope.
The prediction of ship motions in a seaway is a fairly mature topic in hydrodynamics and for which various approaches exist. Currently DRDC and NRC rely on the potential flow-based seakeeping prediction suite ShipMo3D.31–33 The ShipMo3D library contains several applications for calculating ship motions which vary in their methods and applicability.
ShipMo3D can generate motion predictions for a range of sea conditions from mild to severe. It is based on linear theory, which means it is less accurate for the most extreme cases when both waves and ship motions become more strongly nonlinear. For a vessel such as the GD, ShipMo3D can be expected to give accurate predictions up to a significant wave height of about 7 m—which is well within the range for helicopter operations.
Depending on the purpose of the data, either a time-domain or a frequency-domain approach might be used. For example, generating motion profiles for a virtual ship in a simulator or for a model in a wind tunnel would need a time-domain approach. For others, a frequency-domain approach would suffice where the outputs of the program are expressed in terms of RMS for each motion degree of freedom; e.g., roll, pitch, heave, and flight deck accelerations. Peak or maximum expected motions (for a given time interval, e.g., 15 min) can be estimated from RMS values assuming they follow a Rayleigh probability distribution. As shown in Table 4, the predicted ship motion outputs of greatest interest are RMS motions, FDLA, and FDVA.
4. Application of modeling and simulation tools for SHOL planning
4.1. Test concept
The inclusion of modeling and simulation into the FOCFT process necessitates a three-part test concept: SHOL Planning, Execution, and Compliance. SHOL planning consists of M&S for various aspects of shipboard helicopter operations. The results of the M&S analysis can be used to identify which test points in the trial test matrix are likely to be easily completed, marginal, or hazardous. This provides valuable information for planning and decision-making for the FOCFT trial(s). SHOL Execution involves tests with the actual ship and aircraft, which generate the data necessary for certification. Modeling and simulation cannot replace full-scale trials; however, it can provide foreknowledge of what pilots may experience in various conditions, thereby making testing safer and more efficient. It can also provide information during trials for ongoing test optimization. SHOL Compliance refers to ensuring that operations comply with the limits that are found during SHOL Execution. M&S tools can be used to make SHOL Compliance easier and more efficient, as well as enable more complex methods of expressing interconnected limitations.
SHOL Planning has four phases:
SHOL Execution has five phases:
SHOL Planning focuses on analysis and test point mitigation, while SHOL Execution begins to slowly validate data and progress the testing through a methodical test progression. The section below details a methodology for making SHOL execution more efficient with modeling and simulation tools. The tools can also be used to enable multidimensional SHOL envelopes, which would be a more complex way of expressing limits which has the potential to expand operational capability.
4.2. Testing progression
4.2.1. RW
One of the most critical variables to control throughout the SHOL-4 phase flight trials is the RW speed and direction as measured by the ship anemometer(s). From operational experience and M&S analyses, there is typically an area within this WOD envelope that has the lowest pilot workload and unsteady loads which is called the “heart of the envelope.” For frigates, destroyers, and similar ships, this is often for winds speeds in the range of 15–30 knots coming from the direction between the ship’s centerline and 30° to the port side (see Figure 12(c)).
Example SHOL WOD envelopes (adapted from Forrest et al. 34 ). (a) Example WOD envelope. (b) Example reduced WOD. (c) Example heart.
Flight trial progression is initially based on RW progression and consists of incrementally expanding from a known satisfactory test point toward higher RW speeds and greater deviation away from ship centerline and the heart of the envelope. To progress with envelope expansion, the test team can either increase or decrease the RW speed by 5-knot increments along a constant wind azimuth or the wind azimuth can be varied in 15° increments along a constant RW radial. Figure 12(a) shows an example for a full set of FOCFT test points. In the figure, the black points represent test points, and the bold black line represents the predicted edge of the DIPES-3 limit, or the 3 to 4 transition.
Using the simulation and analysis tool kit, the exhaustive version of SHOL test progression can be altered to reduce the number of test points while maintaining a similar risk level. Theoretically, simulation tools could provide an estimate of the relative contributions of specific terms in Equation (5) that lead to the overall DIPES rating.
The first few flights of the trial should be executed using the exhaustive approach, each time evaluating the accuracy of the predicted outcomes from M&S using judgment to account for the expected level of variation (i.e., confidence interval). These initial test points can then be used to determine which subsequent test points in the exhaustive method can be skipped without incurring unnecessary risk. With a mature and accurate toolkit, the test team should, at a minimum, verify the RW test points adjacent to the estimated DIPES-4 ratings. Figure 12(b) shows a SHOL envelope estimating a reduction of test points, quickly progressing to the edge of the envelope and then strategically verifying the edge.
Spreading the optimization across all the different flight envelopes (day, night unaided, night aided) and the deck operation envelopes (free deck, hauldown, HIFR, guideline, hoist), the savings are significant. Additional savings are achieved with reduced test points for high sea state conditions. These are often the most difficult to conduct because the ship has to wait for (or seek out) high sea states which occur less often as severity increases. Reduced test sets mean smaller windows are needed in these sea conditions, thereby reducing potentially lengthy delays waiting for (and/or transiting to) the weather.
4.2.2. Sea state and flight deck accelerations
As the WOD envelope expands, the sea state envelope will naturally expand. “Sea state” is a term used to characterize sea conditions defined by ranges of parameters such as significant wave height (Hs), dominant wave period, and wind speed, which are assessed by trained personnel or through instrumentation like buoys, radar, remote sensing satellites, or oceanographic models. However, the use of sea states is not recommended for SHOL definition mainly due to competing definitions for sea state scales such as the Douglas Sea Scale, the World Meteorological Organization (WMO)35,36 sea state code, or the NATO STANAG 4194 sea state scale. 37 The parameter range for a given sea state can also be too broad to be of practical use. For example, Sea State 6 of the NATO scale covers significant wave heights from 4 to 6 m. It is recommended that if sea conditions are specified for tests or operations, explicit parameter ranges (e.g., 4.5 m<Hs<5.5 m) should be used instead of sea state scales to reduce ambiguity and increase fidelity.
Ship motion predictions are used for planning during FOCFT. Ship motion profiles are generated based on current or forecasted sea conditions. These, along with wind data, are used to determine which points in the test matrix will be achievable and also to identify the required ship speeds and courses. On FOCFTs conducted by the RCN, planning with wind and ship motion predictions is done several times a day using the best available environmental data: once in the morning to plan for that day’s tests, updated again at midday should conditions be seen to be changing, and at night using forecasts for the next day. They are also performed using forecasts for different operational areas in order to seek out those most likely to have conditions needed for the test points. When the test matrix for a FOCFT includes large ship motions, then this planning is essential both to ensure that tests proceed incrementally and to minimize delays when waiting for weather.
Although knowing the sea conditions is important, the actual test progression should not be based on sea state parameters directly as very different ship motions can occur in the same sea conditions depending on the ship speed and course through them. As discussed earlier, the currently preferred method of test progression is by incrementing ship motion, specifically FDLA and FDVA. To control flight deck accelerations, the test team must select the targeted RW test point, which will drive a specific ship course and speed. Then, using motion prediction tools as previously discussed, the team can input the ship course and speed, and the predictive tools will estimate the corresponding flight deck motions. The model for the term Wmotion in Equation (5) can provide insight into the level of workload that will be associated with different ship motion conditions.
4.3. Multi-dimensional SHOL envelopes
General fleet ship–helicopter operations can also benefit from similar planning tools as used on FOCFT by providing ship crews with information on predicted ship motions for the current sea conditions. This functionality is available as part of the DRDC Flight Deck Motion System (FDMS) used on RCN helicopter-carrying ships. The core function of the FDMS is to ensure compliance to an established SHOL by providing real-time information on wind and ship motions relative to the limits for the current evolution. However, it also contains predictive capabilities using the ShipMo3D library. Similar to planning tests during a FOCFT, this capability can be used to select the best or best-compromise ship course and speed to reduce ship motions while also ensuring the WOD remains within its envelope.
The SHOLAS toolkit has the potential to lead to SHOL compliance tools like FDMS38,39 and to create multidimensional SHOL envelopes, which will increase operational capability, by seeking better integration of limiting factors. For example, while ship motion and wind limits are currently represented separately, a dynamic representation of wind limits that change depending on the motion condition would most likely lead to greater capability. While limits associated with different helicopter weights and operational modes already exist, the concept of multidimensional SHOL envelopes would require displaying information on a digital platform, like FDMS, so that algorithms could be used to give real-time limit information, which takes into account current conditions.
5. Concluding remarks
NRC and DRDC have formed the framework and analysis approach intended to standardize SHOL testing using modeling and simulation tools to reduce risk and increase efficiency for FOCFTs. Although many variables play a role in defining the operational envelope, the most common reasons for Γ to exceed for launch and recovery operations are Γpower, Γanemometer, and Γpilot. To evaluate these limits, there are five modeling and simulation tools in development and in use at DRDC and NRC: ABM, HULMS, AW, IRIS, and ship motion prediction software (ShipMo3D). Evaluating Γanemometers through the use of ABM will highlight the use of two anemometers which results in full coverage of the azimuthal range, where wind can be sensed for all conditions provided the appropriate anemometer is selected. Through the use of HULMS, airwake, and ship motion prediction software, the margin to Γpower can be estimated. Each year the toolkit expands with greater understanding of the variables, which define the limits of the ship–helicopter interface. The future expansion includes an examination of Γpilot and pilot workload during flight testing (Wtotal) through the use of IRIS. This unique simulation capability is being developed to allow the isolation of each workload term. Understanding the power and pilot workload algorithms together will significantly assist in informing early design changes and flight test hazards.
Footnotes
Acknowledgements
The National Research Council (NRC) and Defence Research and Development Canada (DRDC) would like to acknowledge the contributions of Steve Zan (NRC), Jim Colwell (DRDC), the late Stephan Carignan (Department of National Defence (DND) and NRC), and Dany Duval (DND) for early groundwork on which the framework and models in this paper are based.
Funding
The author(s) received no financial support for the research, authorship, and/or publication of this article.