
Abstract
Social network analysis (SNA) is a tool for the operations researcher to understand, monitor, and exploit social and military structures which are key in the intelligence community. However, in order to study and influence a network of interest, the network must first be characterized; preferably to a known network model that captures a mixture of graphical properties exhibited by the social network of interest. In this work, we present a novel statistical method for both characterizing networks via a Binomial-Pareto maximum-likelihood approach and simulating the characterized network using a graph of mixed Barabási–Albert (BA, scale-free) and Erdös–Rényi (ER, randomness) properties. Characterization is performed through a combination of hypothesis tests and method of moments parameter estimation on Pareto and Doubly Truncated Binomial distributions. Application on real-world networks suggests that such networks may be characterized with a mixture of scale-free and random properties as modeled through BA and ER graphs. We demonstrate that our simulation methods are able to capture the degree distribution and density of the networks examined. These results demonstrate that this work establishes a statistical framework upon which network characterization and simulation may be accomplished, thus enabling the adaptation of such methods when generating, manipulating, and observing networks of interest.
Keywords
1. Introduction
Social network analysis (SNA) is a tool for the operations researcher to understand, monitor, and exploit social, political, and military structures which have been key intelligence considerations through the ages. Indeed, throughout the years, analysts have charted the alliances, coalitions, and military order of battles for centuries in order to derive factors providing operational advantages. SNA tools, with its mathematical and statistical foundation, enable analysts to monitor, understand, and exploit network structures. In addition, the nature of warfare has evolved. While the classic image of the end of a war includes the unconditional surrender of a foe, this has not been the case in modern warfare. Warfare has shifted from “War between the people” (nations fighting to a distinct victory) to “War among the people” (non-nation states waging indefinite warfare). 1 The recent Joint Concept for Human Aspects of Military Operations (JC-HAMO) 2 recognizes that such wars “among the people” coupled with the need to “win the peace” require the consideration of human effects in executing military operations. JC-HAMO goes on to point out that in planning conflict and building the peace, it is necessary to consider the social, cultural, physical, informational, and psychological elements that create a desired effect on behavior. Building on the use of SNA in counter terrorism studies, it is the application of an analysis approach that can aid future joint planning. An understanding of SNA approaches will continue to be of value in the intelligence preparation of the battlespace, but with the adoption of the joint concept on human effects in planning operations, it will also be a planning analysis tool. Today, the intelligence and operational communities widely use SNA in order to analyze relationships between individuals within groups of interest. 3 In some cases, SNA is used in this context to monitor and possibly influence a network of interest. From a security and defense standpoint, individuals within the network may represent friendlies or potential threats, or as applied to non-humans, could represent relations among assets or critical resources such as a network of computers, the power grid, or water sources. Regardless of the network itself, it is not possible to understand, monitor, and potentially act upon a network of interest without first characterizing the underlying structure of the network. Thus, such relational data are present in many critical resources, computer infrastructures, and organizational social groups of interest, and most commonly, such relational data are represented structurally as a network. Using the network structure, the data can be graphed via nodes and connected by edges in order to visualize and analyze the data. Examples include agents (nodes) and the operatives with which they communicate (represented via edges) in an organized crime network, individuals executing code on a computer network which is tracked through the computer’s Internet protocol (IP) address (node) and its connections (via edges) to other computers, or drones in a cooperative network. Invariant to the network of interest, continual observation and analysis of the data are enabled if the associated graph of the data (represented via nodes and edges) can be characterized to a specific or known network model for reproduction, simulation, and augmentation during analysis. A known network model allows the data to be studied and acted upon to observe behavior in its graphical form.
These network models are built upon known graphical properties of the network, mostly related to how nodes are connected to each other, such as scale-free, random, or small world properties. The scale-free property has been observed to represent many social, physical, biological, and man-made phenomena4–7 and was first discovered in networks as described by De Solla Price. 8 One well-known graphical model that exhibits the scale-free property was proposed by Barabási and Albert. 4 Their model is governed by the concept of preferential attachment in which new entities are more likely to form connections with those that are already well connected in the network. Random properties can be found in graphical models such as that proposed by Erdös and Rényi, 9 and the small world property, in which nodes are closely connected, can be found in graphical models such as that proposed by Watts and Strogatz. 10
Although there have been other more complicated models for graphical properties established in the literature, such as random graphs, 11 the Barabási–Albert (BA) model has been widely studied due to its simplicity and its scale-free property. More recently, although, and despite the claim that the scale-free property is inherent in many real-world networks, Broido and Clauset 12 have shown that scale-free networks are indeed rare, and most networks are at most partially scale-free. This conjecture is what has motivated our research; that many real-world networks may partially possess properties such as the scale-free property. Identification of the scale-free property for even a portion of the network is important, particularly if the remainder of the network can be characterized through noise or randomness (or other identifiable and tractable properties).
Characterization of relational data into a network model must, therefore, be capable to identify and capture several network properties. Most characterization into a known network model is accomplished mathematically, mainly through applications of graph matching and classification methods. 13 Many such methods have been developed. 14 For instance, the methods found in Broido and Clauset 12 may be used to determine if the entire network is scale-free; however, as for most mathematical methods, it is an involved computational process which becomes compounded if the method is applied to the various sub-networks of a network, that is, under the idea that a network is only partially scale-free, such methods would need to iteratively test for structures associated with the scale-free property on each sub- or partial network. We propose that a shorter, more rapid test based upon statistical theory may provide a means to test both the entire network and, through simple construction, identify portions of the network that could in fact follow known properties such as the scale-free property.
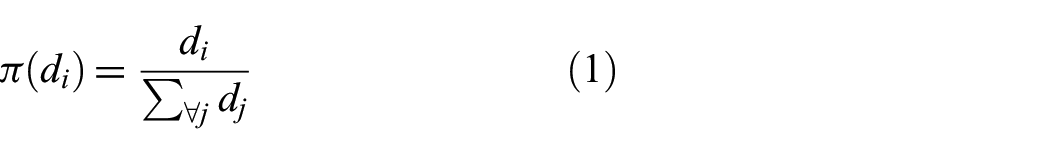
Statistical methods use known graph properties to characterize a network. These methods are useful because once a network is represented as a graph, the distribution of graphical properties such as the graph nodal degrees may take on a specific structure. For instance, the networks that are scale-free possess a unique property in which the distribution of the network degree associated with the nodes of the network follows the power law distribution. Furthermore, the degree distribution for well-known network models such as the BA and ER is known. In particular, it has been shown theoretically that the degree distribution of the BA
4
model follows a Pareto distribution with a parameter of
Therefore, this paper establishes a statistical framework upon which network characterization and simulation may be accomplished by presenting a novel statistical method for both characterizing networks via a Binomial-Pareto maximum-likelihood approach and simulating the characterized network using a graph of mixed BA and ER properties (scale-free and randomness). The network characterization method is used specifically to (1) test a set of observed network data for its scale-free property through tests of hypotheses based on the Pareto distribution and (2) to model any inherent noise (randomness) by fitting a Doubly Truncated Binomial distribution using method of moments estimation. This framework is useful for researchers who want to characterize and monitor networks, as it provides a means by which to computational model networks and to detect changes and evolutions within the network more efficiently through identification of network properties via statistical tests. As such, statistical methods can be applied to characterize a network, or a portion of a network, as a mixture of network properties. Even characterizing a portion of the network may be of use as an entire network may not be of interest as much as portions of the network. Furthermore, the network can be partitioned into those portions exhibiting known properties and that portion for which properties need to be developed and newly characterized.
In order to demonstrate our proposed statistical framework for network characterization and simulation using multiple network properties as discussed, we derived the associated tests of hypotheses and demonstrated their usefulness for network characterization and then illustrated our proposed method for simulating a network with a mixture of properties. Therefore, this paper is organized as follows: first, the BA model and the representation of its degree distribution via the Pareto distribution are described. Then, we derive the test of hypothesis for each of the parameters of the Pareto distribution followed by the Union-Intersection Test (UIT) for simultaneously testing these parameters. A simulation of the BA network is conducted in order to calculate the power of the individual tests as well as the UIT for determining if a network or a portion of a network follows the scale-free property. Then, we demonstrate our statistical framework for network characterization and simulation by first describing a method for characterizing a network as a mixture of network properties, specifically demonstrated for a mixture of scale-free and randomness properties as exhibited via the degree distributions associated with a BA network (scale-free) and an ER network (randomness). Characterization is performed through a combination of hypothesis test on Pareto and method of moments parameter estimation on Doubly Truncated Binomial distribution. We then follow up with a proposed method for simulating a characterized network as a function of both the BA and ER networks. Finally, we apply our framework on real-world networks in an attempt to test the extent to which the networks exhibit both the scale-free and randomness properties and to study how well our methods for characterization and simulation describe the empirical networks as a mixture of properties. We conclude with a discussion on our statistical framework and the implication that they present to network modeling.
2. Background
In this section, we will review previous works in network analysis and modeling. Specifically, we will introduce the works of Barabási and Albert 4 and Erdös and Rényi 9 and discuss the two basic types of network model used in our approach. In addition, we will review a method of estimating a parameter of the Doubly Truncated Binomial distribution used in our model. We then introduce a select number of network measures that will be used to study the goodness-of-fit of our model.
2.1. Network models
2.1.1. BA model
The BA model is based on two mechanisms that govern the scale-free property of real-world networks: (1) networks expand continuously by the addition of new nodes and (2) new nodes attach preferentially to other nodes that are already well connected. The BA model operates by first starting with an initial number of nodes,
is the probability that node
The nodal degree of the BA scale-free graph can be derived using the mean field theory as described by Barabási and Albert.
4
Let
The probability density function (PDF) for a given node having degree
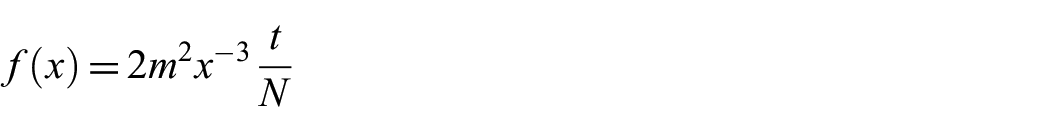
where
Thus, for finite
2.1.2. ER model
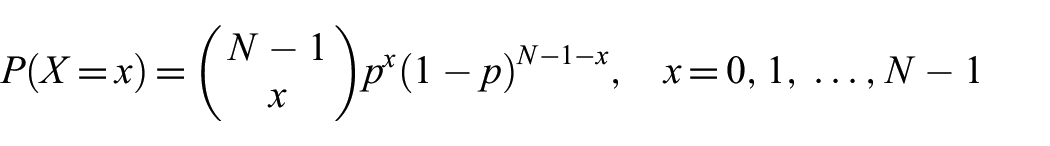
The first commonly used random graph generating model was proposed by Erdös and Rényi,
9
where a graph is generated by an algorithm that connects any pair of nodes via an edge with probability
and the Poisson distribution:
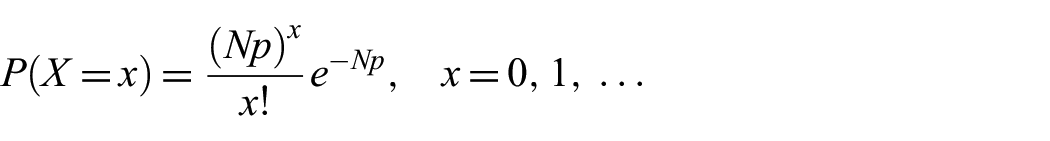
as
2.1.3. Mixed models
When modeling complex real-world networks, it may be useful to consider a mixture model. A mixture model allows each node in a network to be distributed according to a mixture of components belonging to distributions of interest. For instance, a network may be a mixture of scale-free and random components. One example of this generative model is the Stochastic Block Model (SBM) as defined by Nowicki and Snijders. 20 For our purpose, we are interested in a mixture of the BA and ER models since they contain known network characteristics. Therefore, following the ideas of Schmidt and Morup 21 who discuss the likelihood of a network taking a certain form given the components to which the nodes belong, we will be estimating the network model to which each node belongs using an SBM for degree distributions of the BA and ER network models.
2.2. Estimating the parameters of the Doubly Truncated Binomial distribution
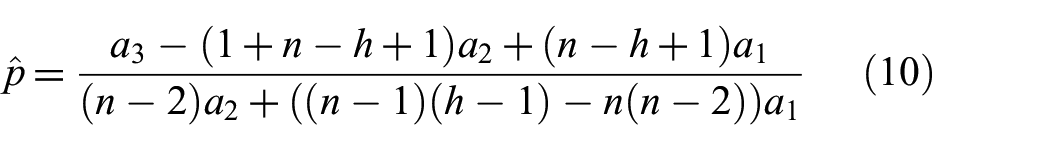
It is well known that the degree distribution of an ER graph is a Binomial distribution.9,16 However, our approach only examines connected graphs; therefore, a degree of zero is impossible. In addition, our mixture approach will also force the ER representation of the network on the lower portion of its degree distribution, essentially placing an upper bound on the degree distribution. Shah
22
derived a method of moments estimator,
where
2.3. Network measures
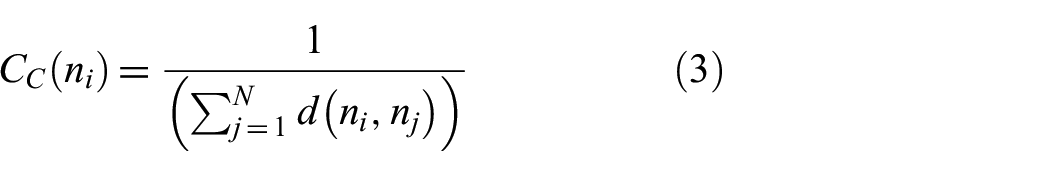
Although our work focuses on the degree distribution of a network, we now define several other network measures that we compute for comparison in our data example in a later section. Closeness is a measure of how close a node is to all other nodes in the graph, and it is defined as the inverse of the sum of pairwise distances
Betweenness measures the involvement of a node within the direct interactions between two other nodes (nodes in the middle). Node betweenness index is the sum of the probabilities of the shortest path that goes through node
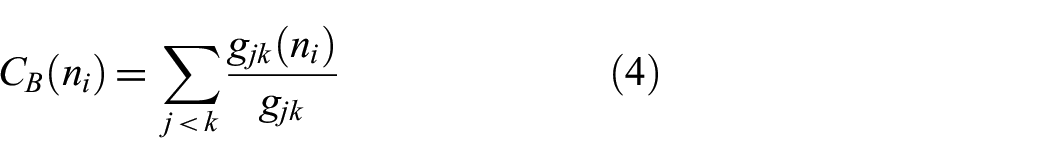
where
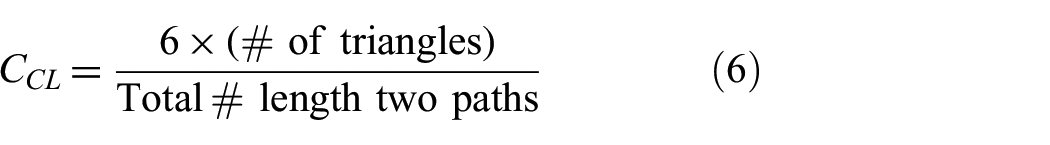
The clustering coefficient for a given node measures the number of connections among the node’s neighbors, 10 and is related to the transitivity concept in the social network literature, where transitivity implies the idea of “a friend of a friend is a friend.” It is defined as the proportion of local relationships among neighbors compared to the potential that all of the neighbors are connected. The mathematical formulation is given by:
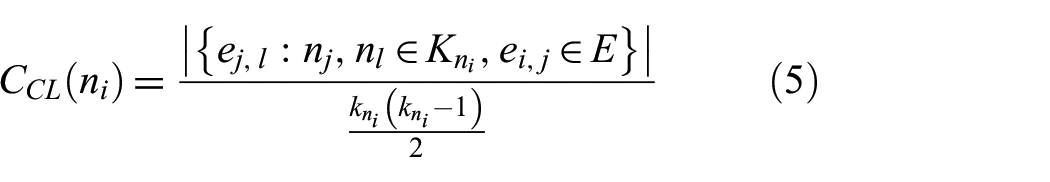
where
3. Methodology
In this section, we will introduce a network characterization method that utilizes the degree distribution of the BA and ER networks. The characterization method is a combination of statistical tests of the Pareto distribution and method of moment estimator of the Doubly Truncated Binomial distribution. The results of these tests from the network characterization are then used in simulating a realization of the network.
3.1. Statistical test of hypothesis for the Pareto distribution
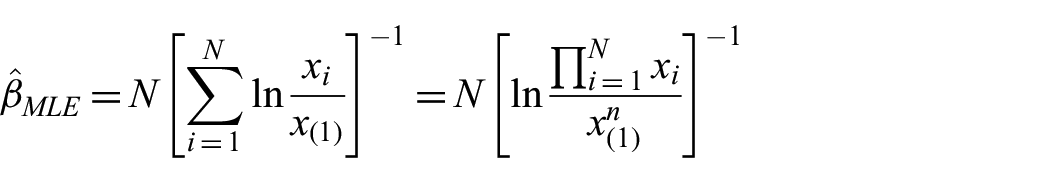
Given a random sample of size
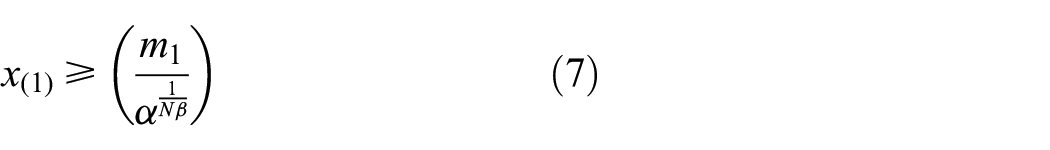
3.1.1. Statistical test of hypothesis for parameter m of a Pareto(m, β) distribution
Let
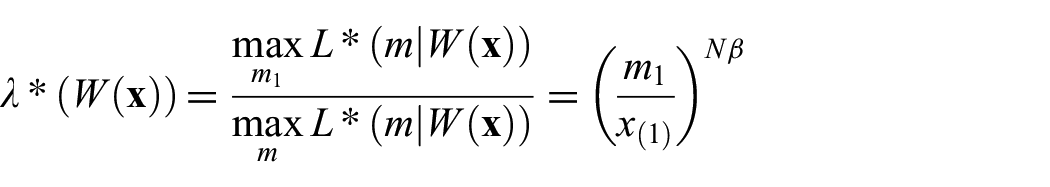
which has a rejection region of
A detailed power analysis for this test was conducted by Mohd-Zaid.
24
The power of the test on
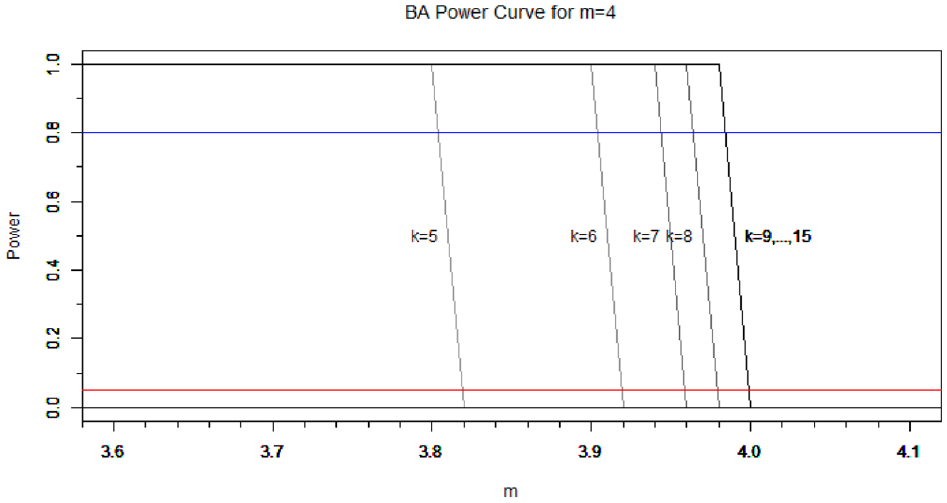
Power curve for the test on
3.1.2. Hypothesis test for parameter β of a Pareto(m, β) distribution
Consider a simple two-sided test,
The power of the test for
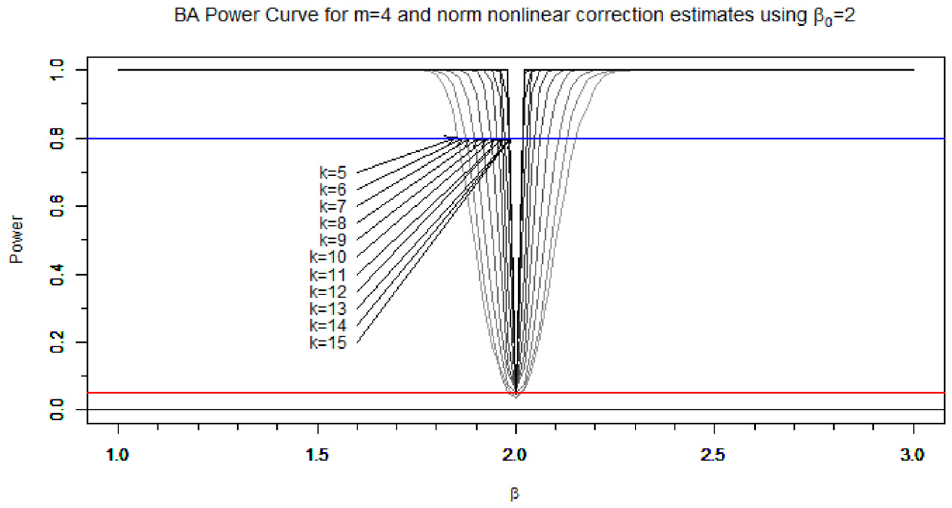
Power curve for the test on
3.1.3. UIT for both parameters of Pareto(m, β)
A UIT can be formed if the null hypothesis can be expressed as an intersection. In this case, we can test for
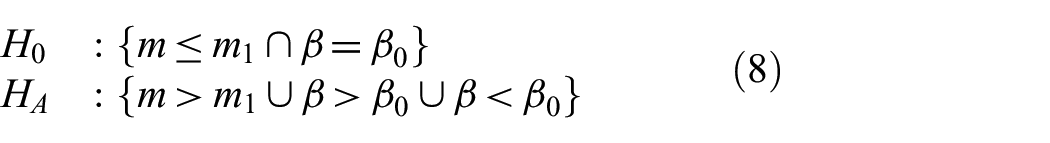
If we define
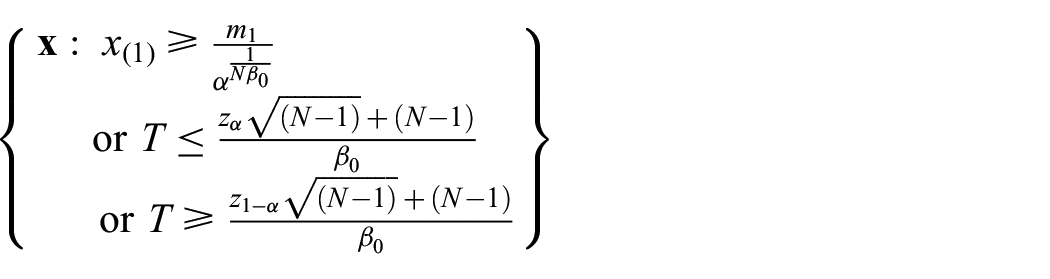
If
As shown by Mohd-Zaid,
24
the power of the UIT is an improvement over the individual tests except when
3.2. Correction for the test on simulated BA network
Network data were simulated to calculate the power of each test. A data set comprised of degree distributions of simulated BA networks for various parameter and size combinations was generated using the igraph package in R. 25
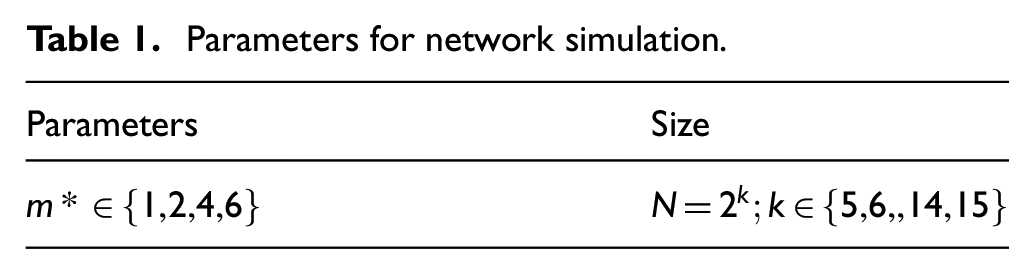
The parameter selection for the simulation is listed in Table 1, where 1000 independent networks were generated for each of the 44 combinations of graph parameter and sizes.
Parameters for network simulation.
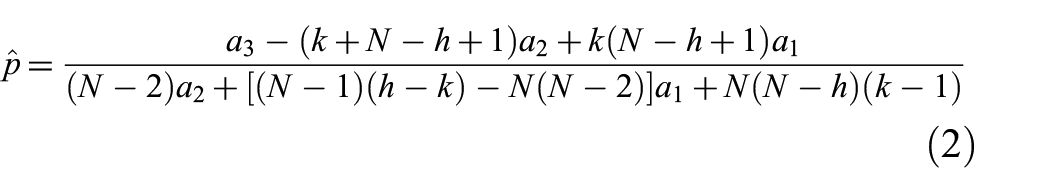
From this point forward, we will let
Although there is a bias in the sample mean and variance from the empirical distribution of
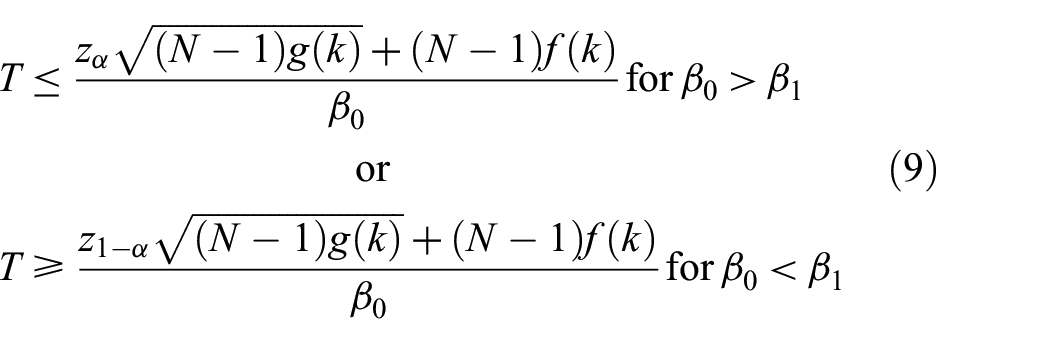
which rejects
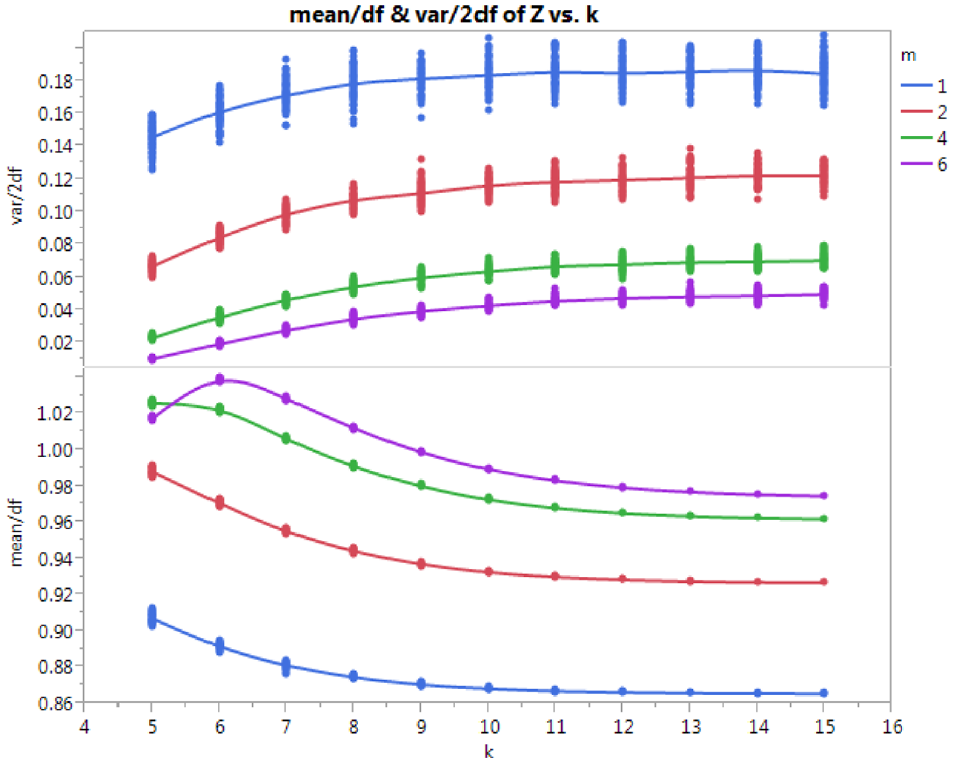
Top: ratio of
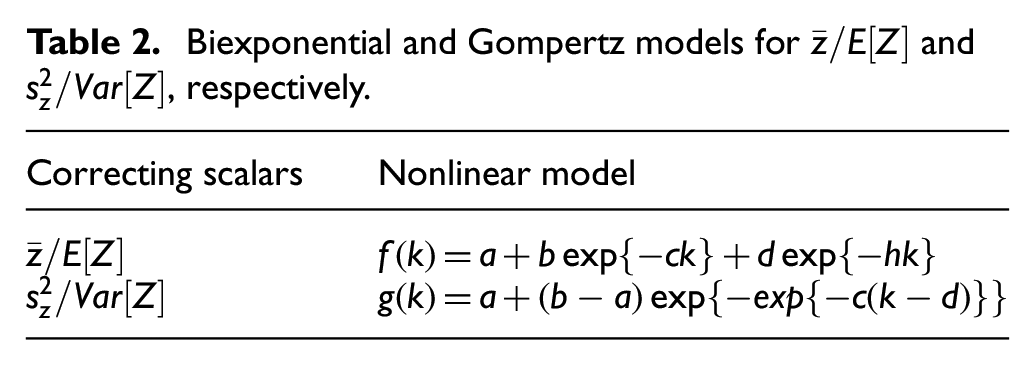
Biexponential and Gompertz models for
Parameter estimates for
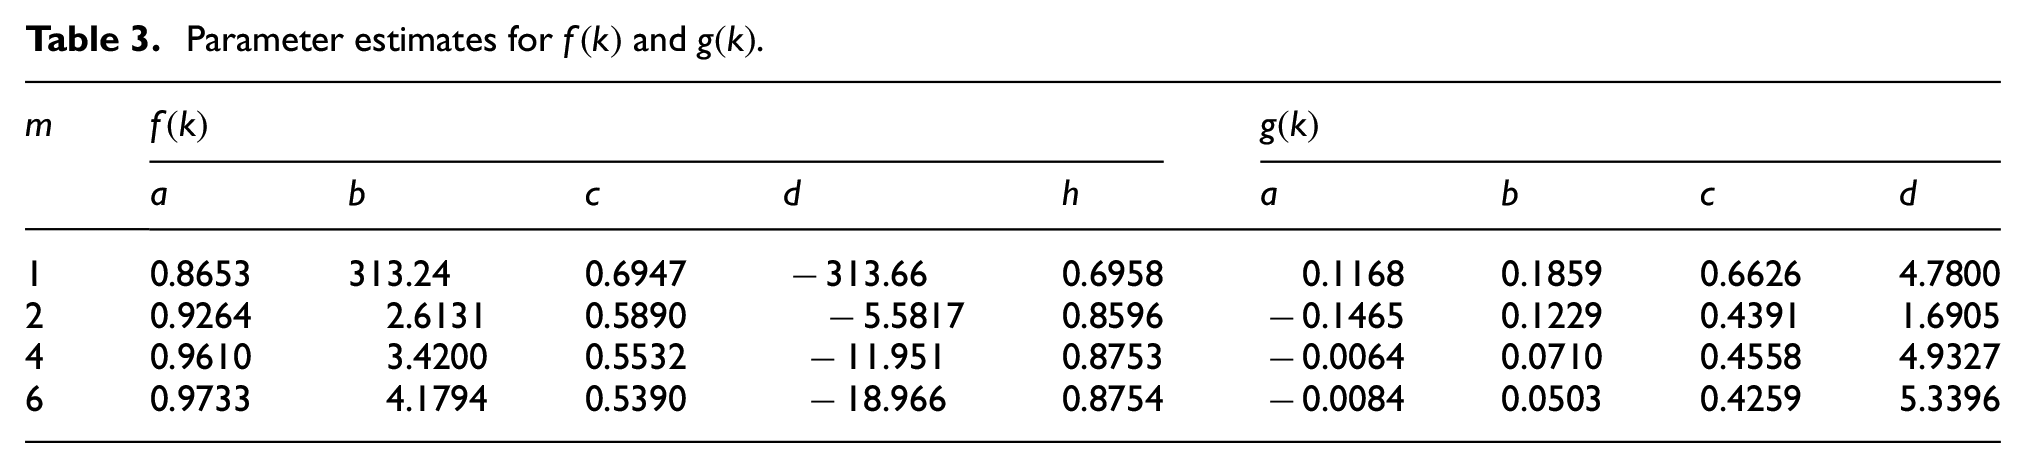
The power of each test of hypothesis in Equation (9) for the BA network was evaluated assuming an
If
Using the appropriate values from Table 3 for
Due to the findings in Li et al.,
26
Bubeck et al.,
27
and Mohd-Zaid et al.,
28
the power of the test for
The power of the UIT for BA networks is an improvement over the individual tests except where it is stationary at 0.05 when
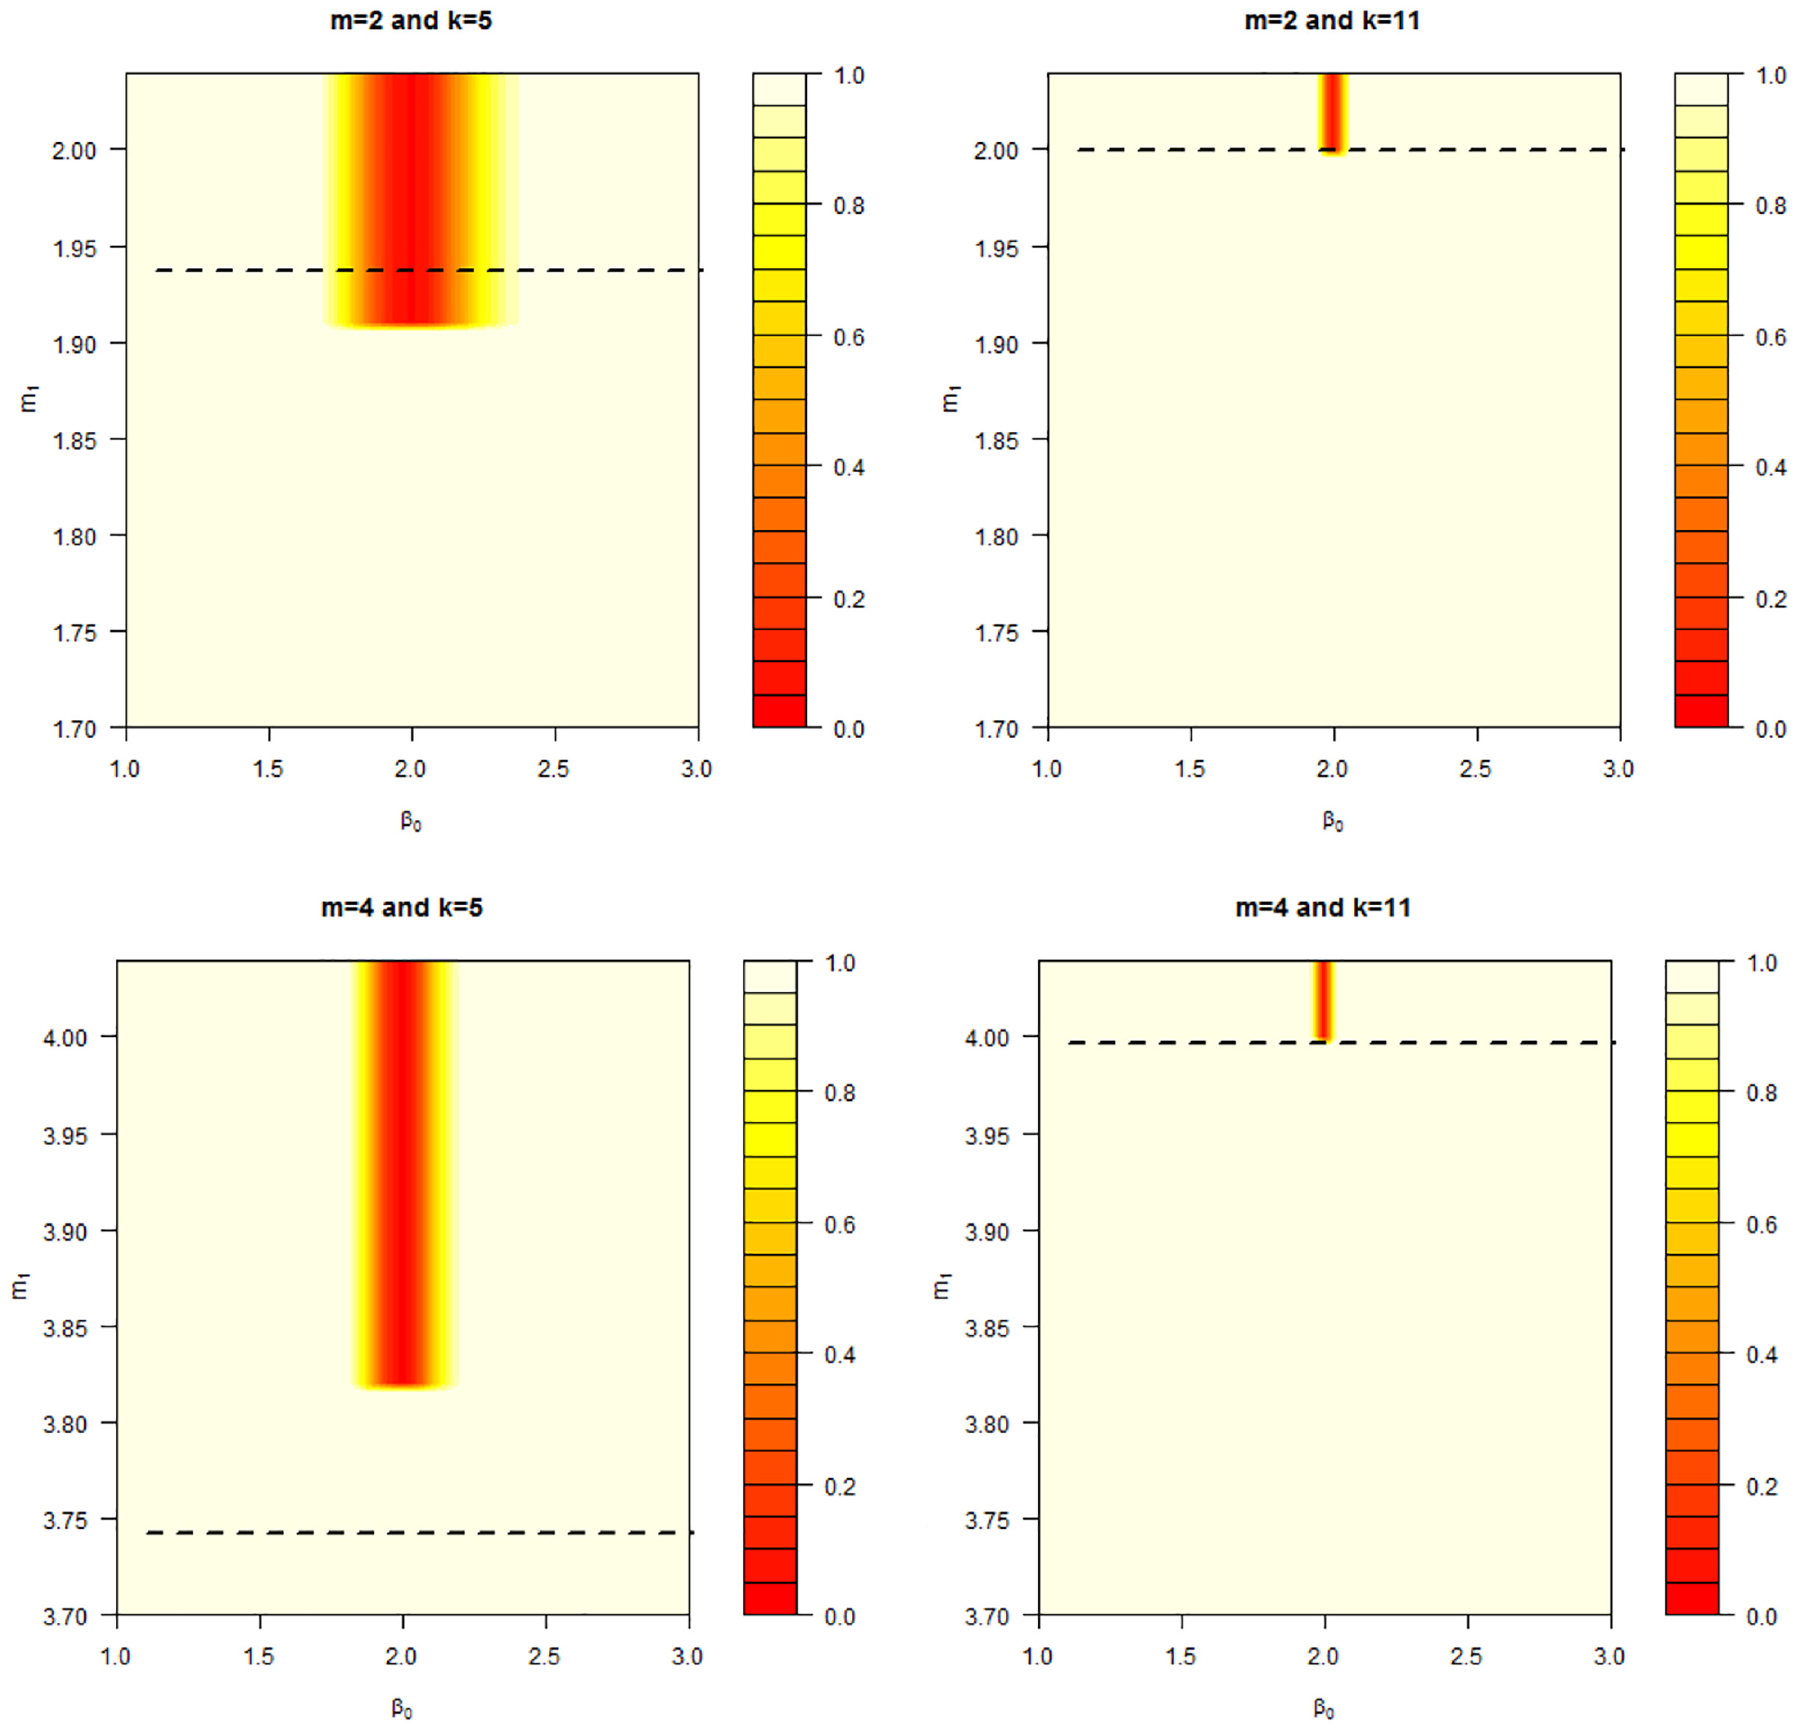
Contour plot of the power for the BA UIT for
4. Mixture model approach for characterizing scale-free networks
We will now propose a method that takes advantage of well-known degree distributions for the BA and ER networks. Each network model creates networks with degree distributions that can be approximated by the well-defined Pareto and Binomial distributions as previously described. However, we take a stepwise approach by first testing a proportion of a network’s degree distribution using our proposed UIT. This is performed in order to characterize said proportion of the network and model it using the BA model by assuming that it has the power law characteristics. The remainder of the degree distribution is then assumed to follow a Doubly Truncated Binomial distribution from the ER randomness property, and the parameters of the distribution are then estimated through the maximum-likelihood approach.
The UIT from section 3.2 is used by hypothesizing a value for
For the lower portion of the degree distribution where the degrees are smaller than
such that
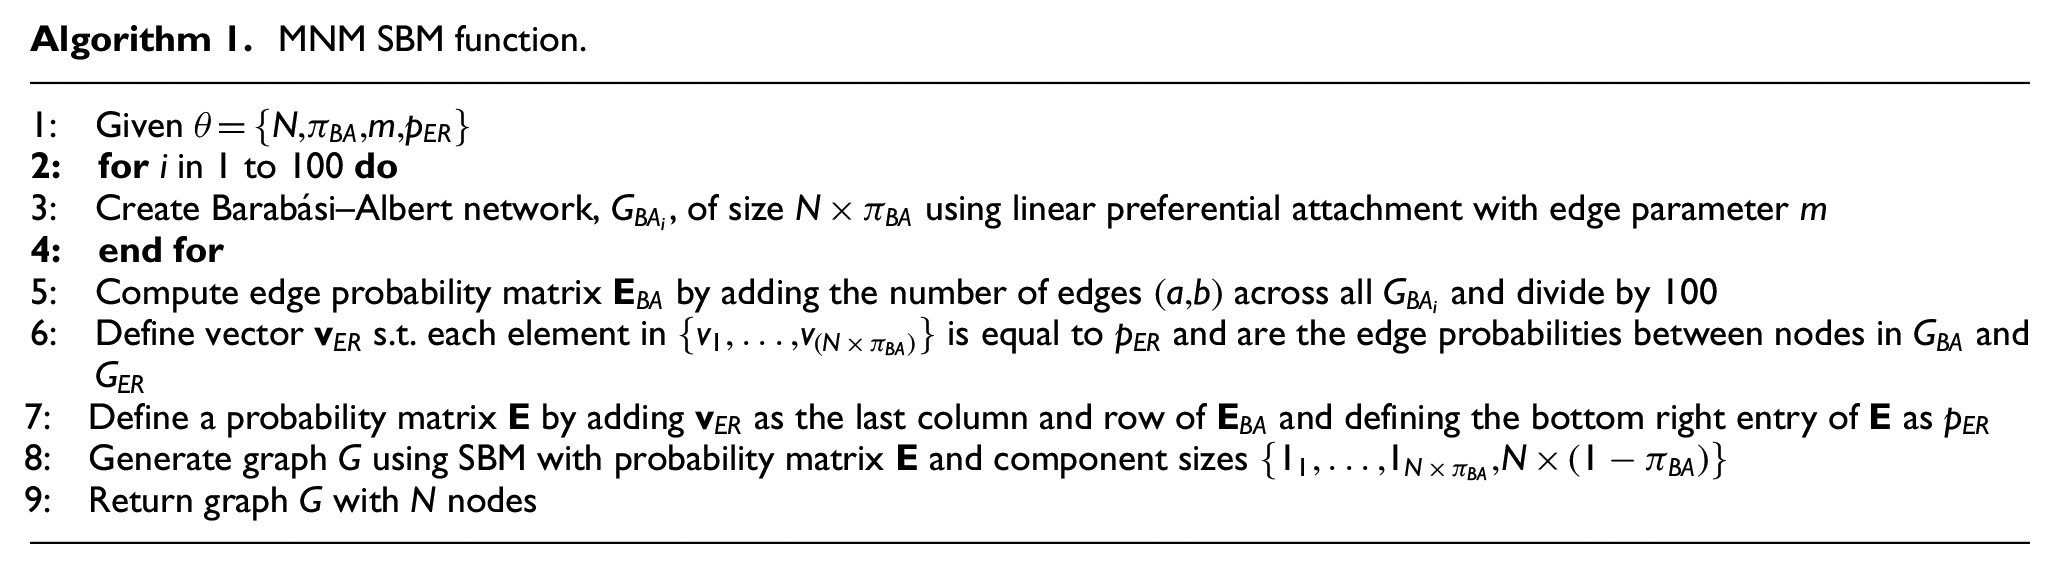
In order to investigate the goodness-of-fit of our characterization method described above, we propose a network simulation algorithm that takes into account the estimated parameters of the degree distribution. Schmidt and Morup
21
proposed a Markov Chain Monte Carlo method to derive a model for the infinite mixture model using a limit of a finite parametric model. The SBM creates graphs with communities which we will use in the simulation of a characterized network. This algorithm generates a network of a given size that preserves the degree distribution of the characterized network. Algorithm 1 outlines the process for network generation using an SBM approach.
20
Using SBM, a network is generated via a probability matrix that defines the edge probability between a specified number of components (here as BA and ER) and the edge probability within each component. In this process, the edge probability matrix of the BA network of size
MNM SBM function.
We now illustrate an application of the characterization and simulation methods on the well-known Zachary’s
29
Karate Club data set. This network describes the relationship between 32 students and 2 teachers in a karate school. Members are connected if they attended a common activity such as going to the same class. This network is undirected and weighted; however, we will not consider the weights on the degrees for our purpose. The club is split into two factions, each led by one of the teachers. In the characterization part, applying our UIT on the degree distribution of the network resulted in a best fit of
For Part II, we then simulated 1000 networks using Algorithm 1 with parameter set
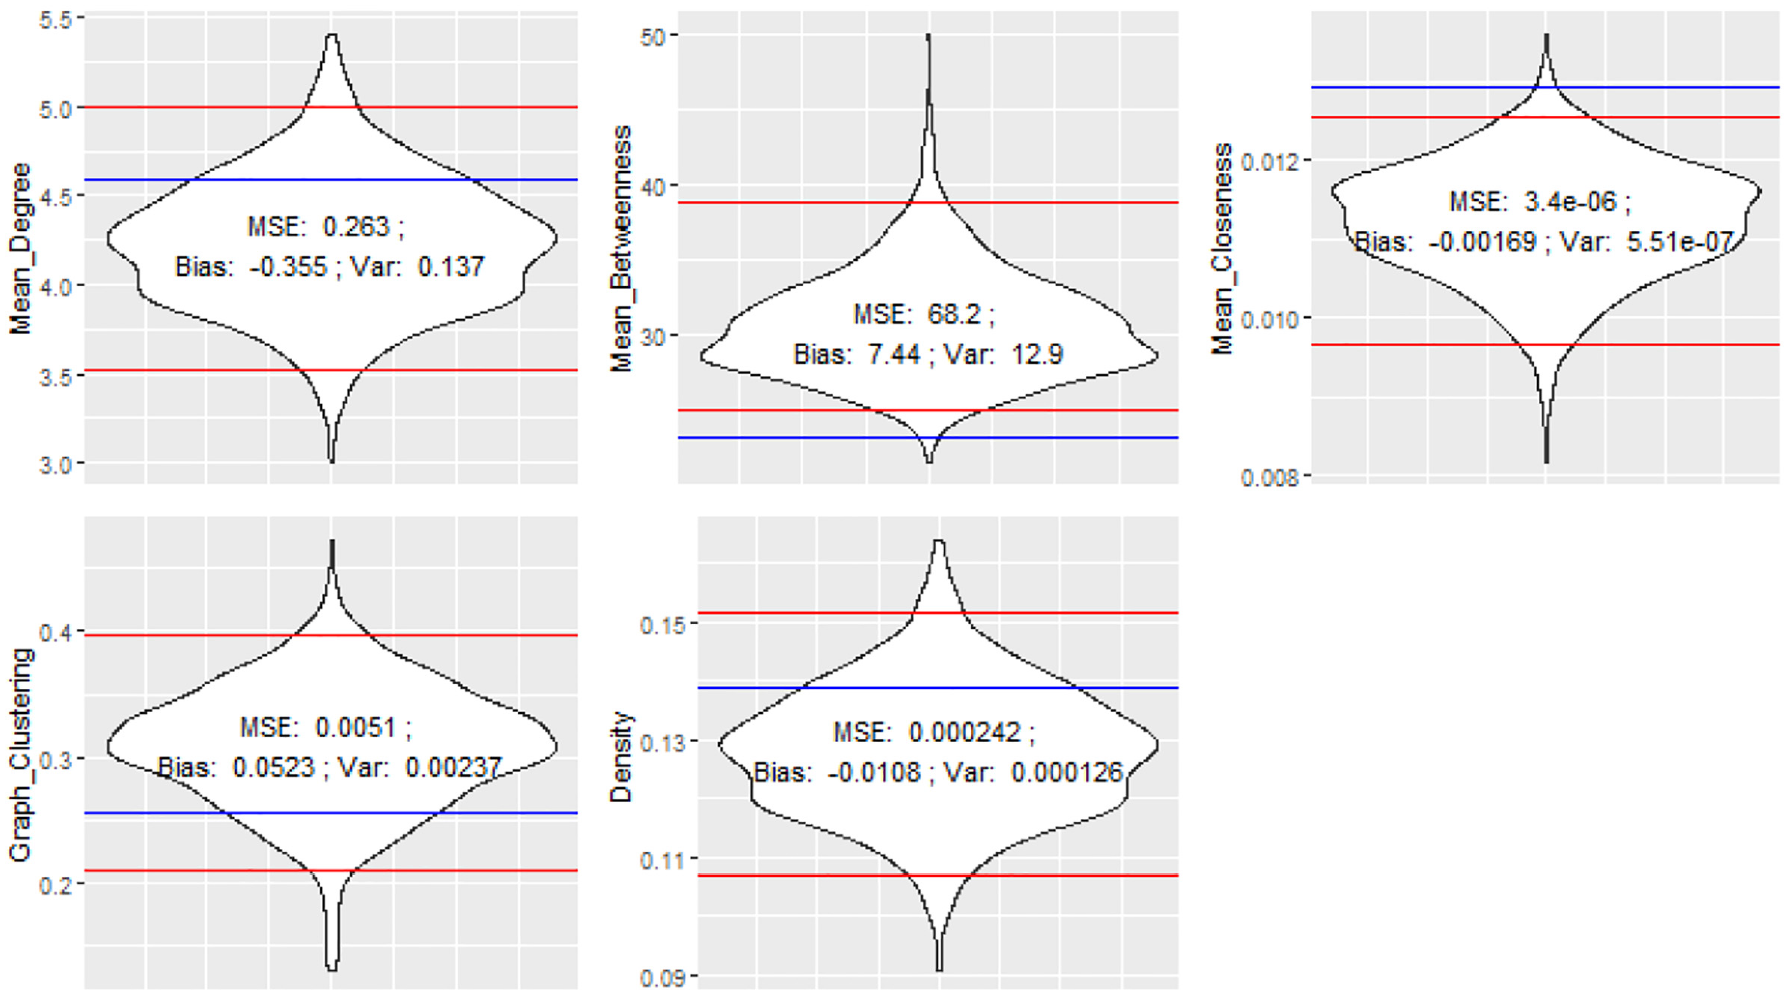
Violin plots of the bootstrapped network measures of simulated Karate Club network.
MSE, bias, and variance of bootstrapped network measures for Karate Club.
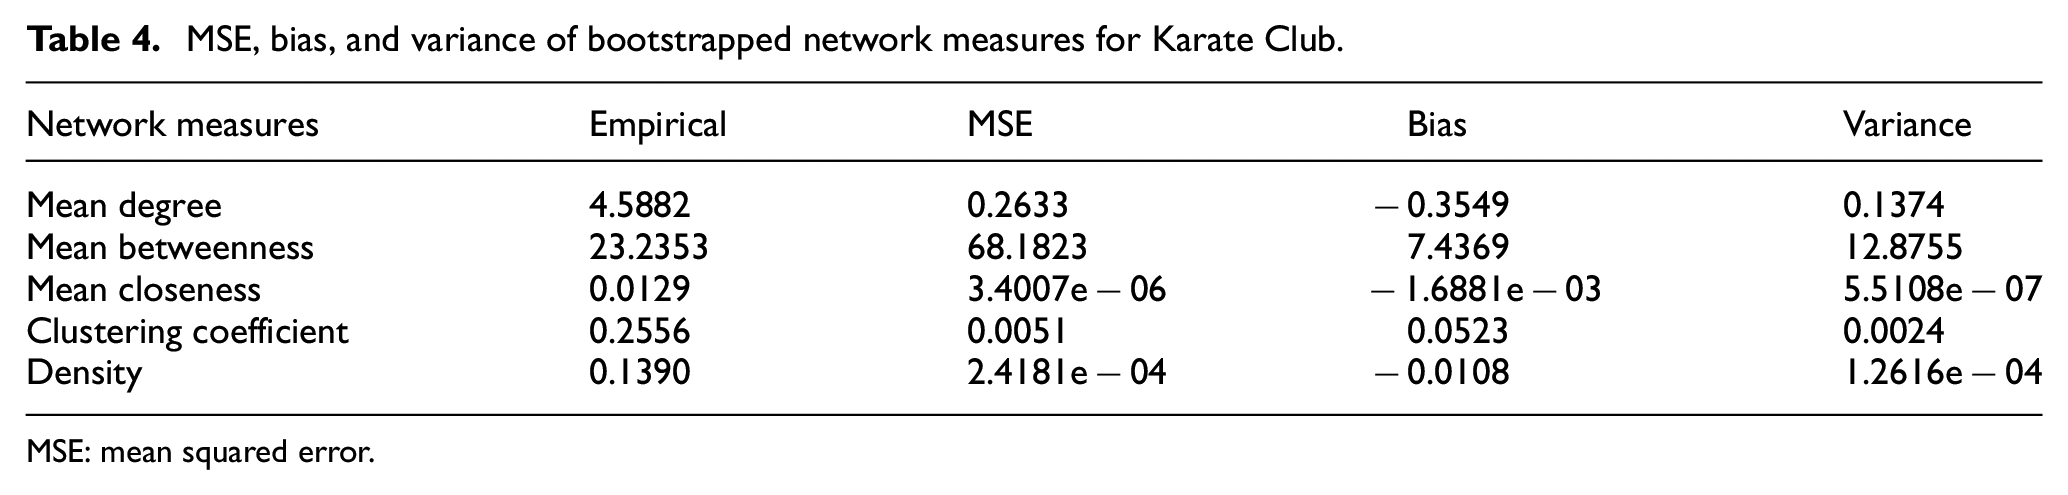
MSE: mean squared error.
5. Application on real-world networks
We applied our characterization and simulation methods to real-world data sets in order to see the usability of our methods.
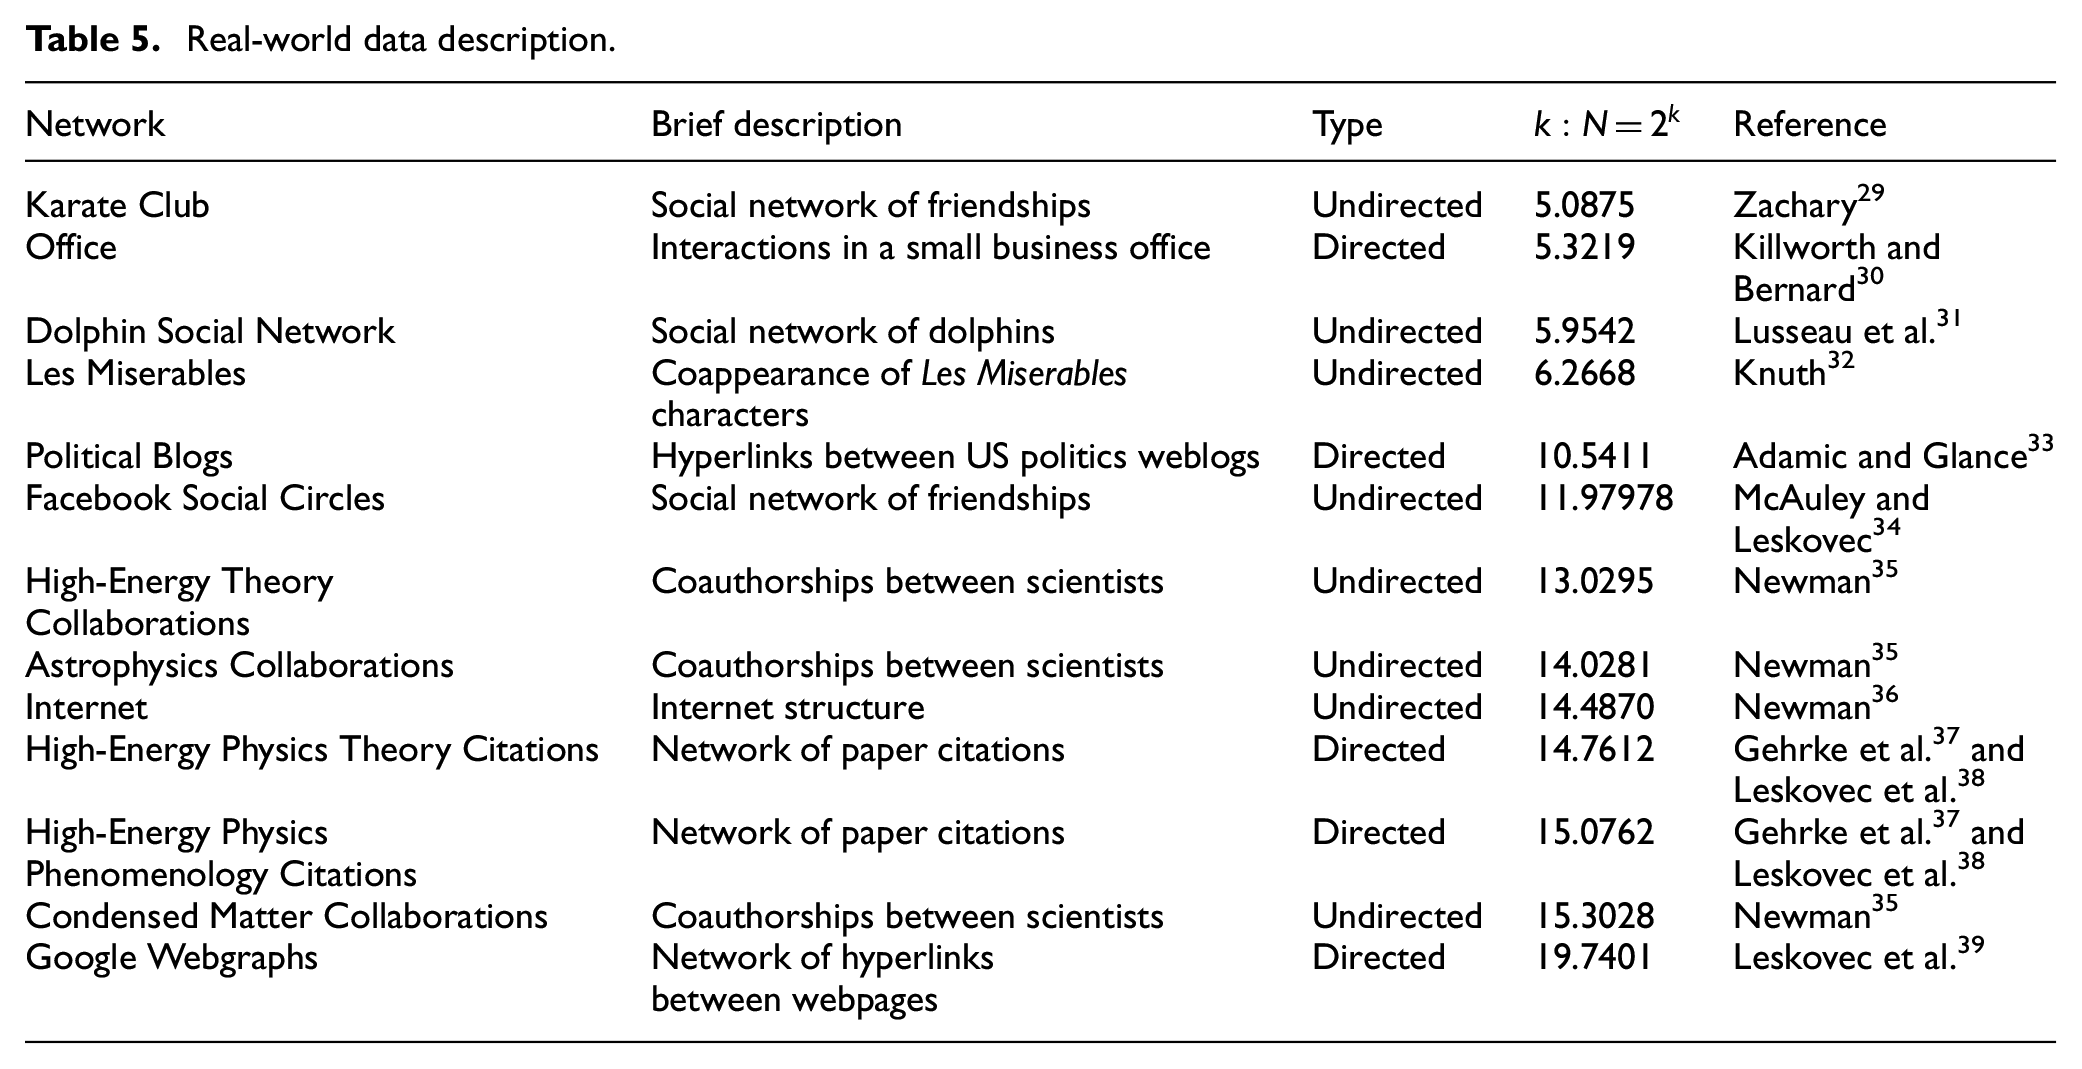
As previously stated, identification of the scale-free property for even a portion of a network is important for characterizing and monitoring networks, and our approach allows those networks or sub-networks to be modeled through a BA graph. The data sets summarized in Table 5 consist of networks of various sizes that are available in the literature36,40 from a variety of fields that are believed to be scale-free. It should be noted that all of these networks were treated as undirected networks for the analysis.
Real-world data description.
The UIT was then conducted by hypothesizing that
z-statistic and
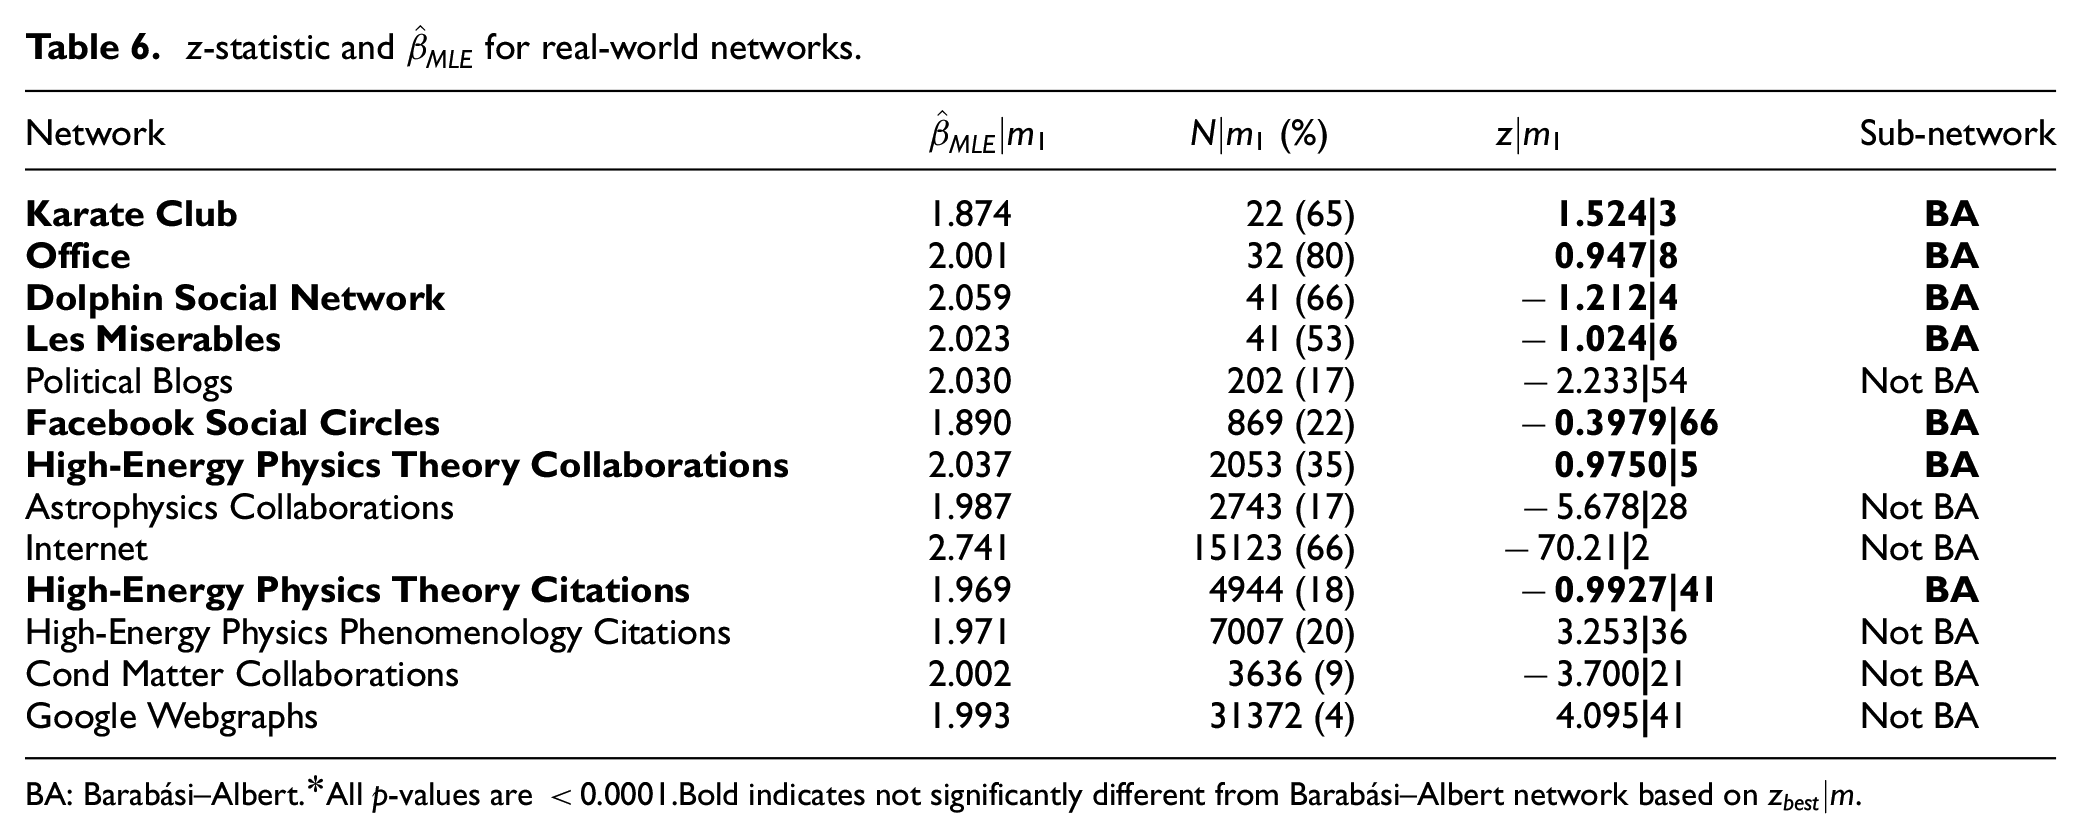
BA: Barabási–Albert.
All p-values are <0.0001.
Bold indicates not significantly different from Barabási–Albert network based on
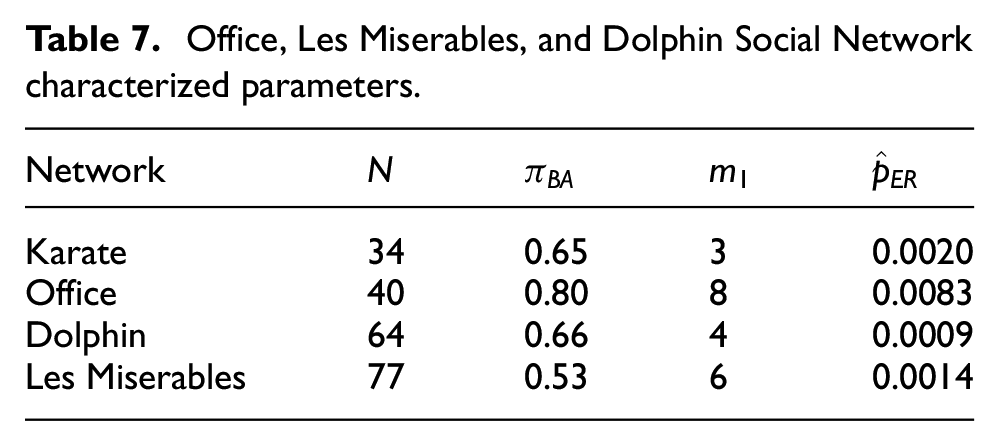
As previously motivated in the introduction, there are scenarios where the study of smaller networks is of interest. Using Office, Les Miserables, and Dolphin as examples since they are all fairly small networks with at most 77 nodes, we apply the same simulation procedure as we did on the Karate network with the networks’ respective parameters as shown in Table 7. Note that, although not shown here, we also found that the Dolphin network could have also been characterized with
Office, Les Miserables, and Dolphin Social Network characterized parameters.
Empirical measures and goodness-of-fit of simulated networks.
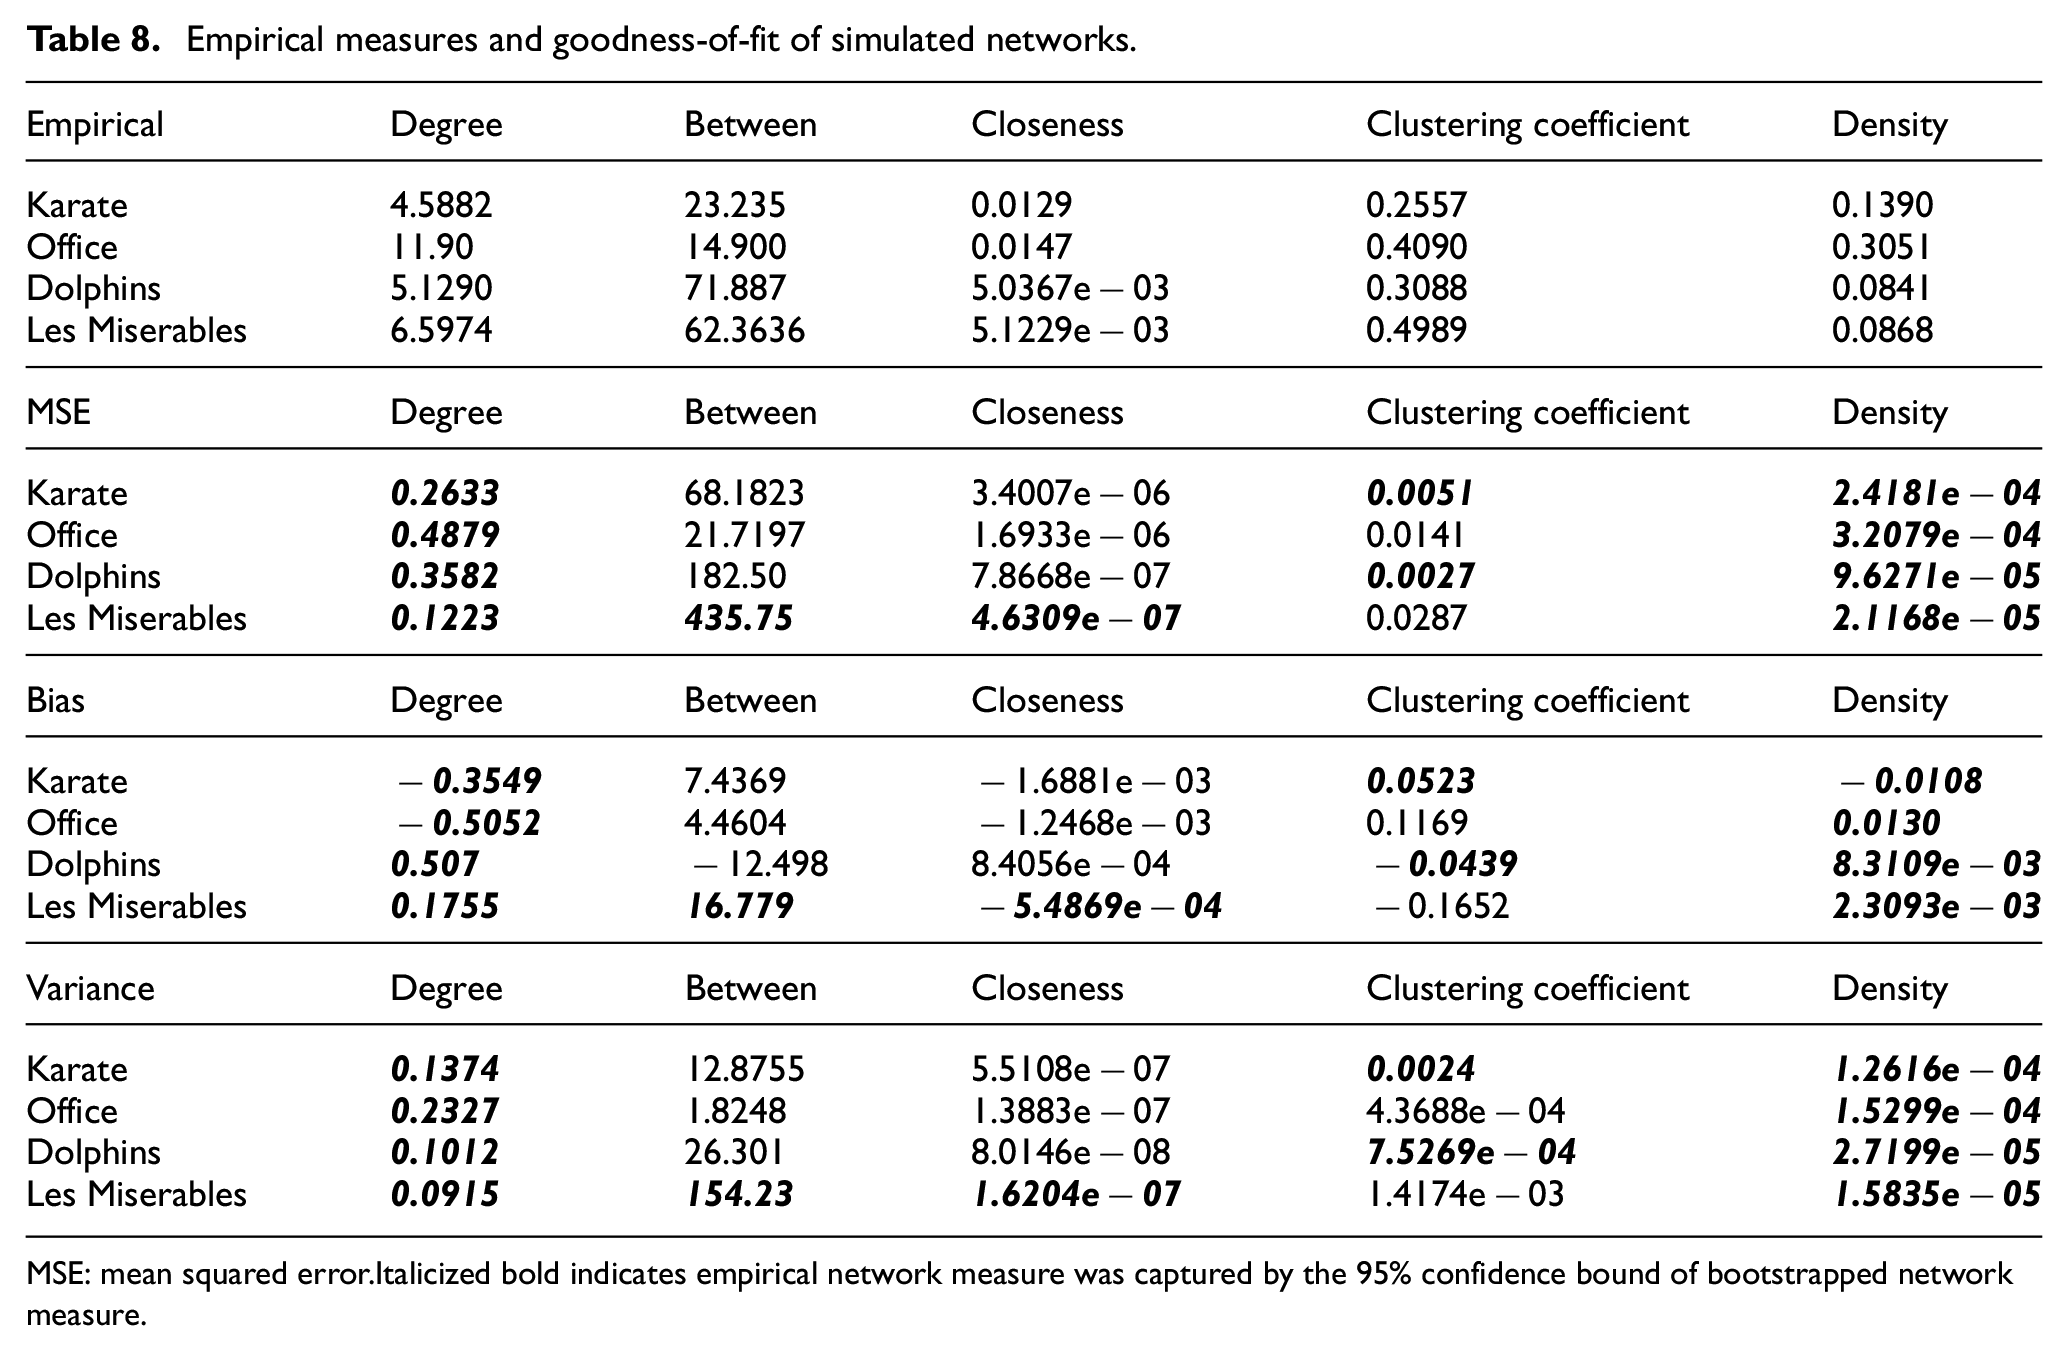
MSE: mean squared error.
Italicized bold indicates empirical network measure was captured by the 95% confidence bound of bootstrapped network measure.
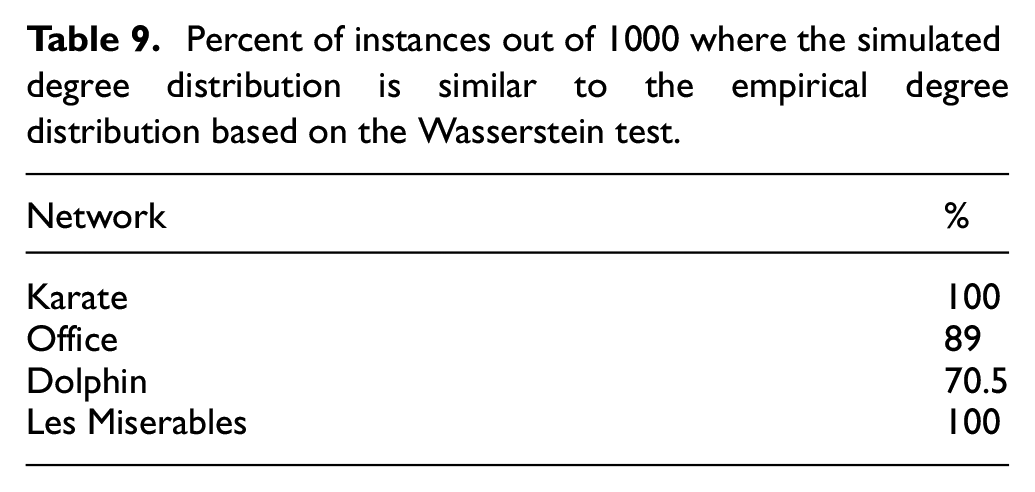
In addition to the goodness-of-fit measures based on the distribution of simulated network measures, we also compared the degree distribution of each simulated network with the degree distribution of the empirical network using the Wasserstein test
41
at
Percent of instances out of 1000 where the simulated degree distribution is similar to the empirical degree distribution based on the Wasserstein test.
6. Conclusion
The purpose of this paper is to establish a statistical framework to characterize and simulate a network using a mixture of network properties, and our semiparametric mixture model approach for characterizing and simulating a network shows promising results. Our simple approach of first characterizing the network and then simulating the network using the fitted parameters was able to capture the degree distribution and density of the empirical networks. For some networks, it was also able to capture other characteristics of the empirical networks such as clustering coefficient and density. Our approach also opens possibility to create larger mixture of network properties by including other network models that are said to characterize other real-world networks such as the Watts–Strogatz model, or test another network model as the basis of the characterization step. While useful in and of itself, the approach also provides a basis to generate test cases in the characterized class to be used in design of experiments and other operational analyses. Such mixture network models might be able to truly characterize any real-world model and is the focus of future research. It is now also possible to adopt the result obtained by Blaha et al. 42 to visually display the real network using our approach that might give more insight to the real network. This can be done by studying a collection of simulated characterized networks and using the methodology used by Blaha et al. 42 to study the most efficient way to visualize the network that will provide as much insight as possible to the network analyst. Although the data sets used in this research were not focused specifically on military and defense applications, our approach and findings can be applied to such applications. For instance, the central actors identified in sub-networks are often of interest in SNA defense applications such as identifying key or leading figures in organizations of interest. Similarly changes in degree distribution may indicate the loss or addition of devices on a cyber network. Therefore, providing analysts with these statistical tools to model and track such changes is paramount to the intelligence preparation of the battlespace and in the planning of military operations.
Footnotes
Appendix 1
Funding
The author(s) received no financial support for the research, authorship, and/or publication of this article.