
Abstract
This paper advocates for causal models of the emergency management cycle (EMC) for decision support in epidemic or pandemic scenarios. The model capability is demonstrated for the case of the COVID-19 attack at the NATO flagship USS Theodore Roosevelt in early 2020. Computational intelligence is a reasonable approach for dealing with uncertainties such as low reliability of information and source credibility. The proposed EMC causal models enable the development of countermeasures for epidemiological attacks using the notion of gaps in the four EMC phases: mitigation, preparedness, response, and recovery. In particular, the EMC problem can be formulated and formalized as bridging the identified technology–society gap, e.g., mitigation of risks and biases; and machine reasoning can be incorporated at any level of the EMC decision-making. Using available real-world data on the USS Theodore Roosevelt outbreak, we show how machine reasoning mechanisms can help the captain to make more reliable decisions in critical epidemiological situations.
Keywords
1. Introduction
An epidemic attack in a military unit is rather a “closed set” scenario. On the other hand, it is a part of a global epidemiological situation characterized by a rapid spread of disease to a large number of people in a given population, or region, within a short period of time.
The recent COVID-19 attack on the NATO flagship, USS Theodore Roosevelt (USS TR), in early 2020 prompted the discussion about the decisions made under uncertainty such as unknown infection fatality and prevalence rates. One fact is certain: no situational awareness support based on reliable scientific data analysis was available to the captain.
This paper aims at answering the question “How can computational intelligence (CI) help the leadership team of military units such as the USS TR make reliable decisions under critical pandemic attacks?”
Logistics and infrastructure in military units, unlike civil communities, are closed but robust. This makes it simpler to implement various countermeasure technologies, such as tracing crew members and their social contacts. These are unique possibilities for monitoring and control of the epidemiological situation. In this paper, we make use of those constraints in our approach to building an intelligent decision support system (DSS) that would assist the captains in making reliable decisions in critical epidemiological situations.
The COVID-19 pandemic highlighted many technologies and social gaps in the emergency management cycle (EMC), 1 a mechanism to respond to disasters such as pandemics. Those gaps are yet to be addressed by designing the DSS for various stages of the EMC.
Our results are introduced as follows: (1) we provide a background and offer a brief overview of EMC in fighting epidemics and pandemics; (2) we identify gaps in the existing EMC and explain the core of decision support for EMC; and (3) we introduce the DSS model for the case of the USS TR outbreak and provide experimental results.
2. Background
2.1. Epidemiological management doctrine
Figure 1 illustrates the contemporary epidemiological management doctrine. Decision at any phase of the EMC is based on information provided by the following technologies:
current epidemiological situation (state) profiling technologies called epidemiological surveillance (ES);
proactive epidemiological situation profiling technologies called epidemiological intelligence (EI).
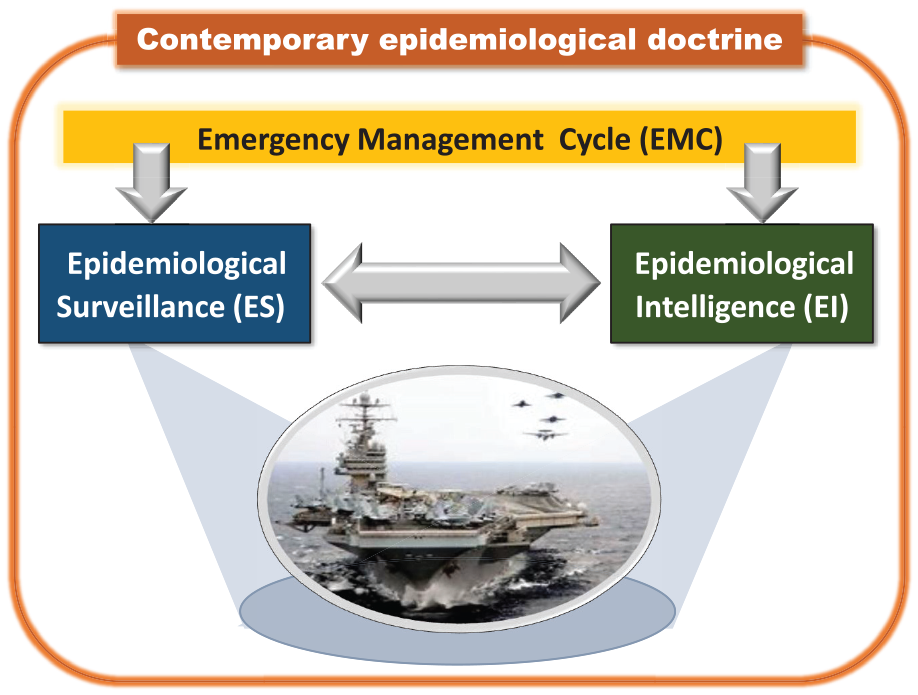
Epidemic attack detection, recognition, and countermeasure according to the contemporary epidemiological doctrine: joint landscape is provided (1) by proactive profiling using EI resources and (2) current state profiling using ES resources through the EMC phases. The source of the USS TR image is Wikipedia.
Given a military unit such as a USS TR under an epidemic attack, the captain has to make a decision based on two kinds of reported data: (1) on the current state of the crew, e.g., how many cases of deceases related epidemic are confirmed, 2 and (2) on early warnings of public health emergencies and potential threats. 3
2.1.1. ES models
The COVID-19 outbreak provided valuable lessons and unveiled critical disadvantages of the existing ES models. The ES model’s outcomes need to be further translated to become usable for human decision-makers. There is a technology gap between the existing models and the decision-making process, and it can be filled in by CI support in the decision-making process. The CI tool needs to be based on causal models that account for uncertainties, as well as perform fusion and forecasting on those uncertainties.
In this study, we identify the gaps in the EMC in both technical and conceptual domains (Figure 2). This paper addresses the key research question: How can we bridge these gaps using the DSS concept? We follow a well-identified trend in academic discussion on the future generation DSS. 4
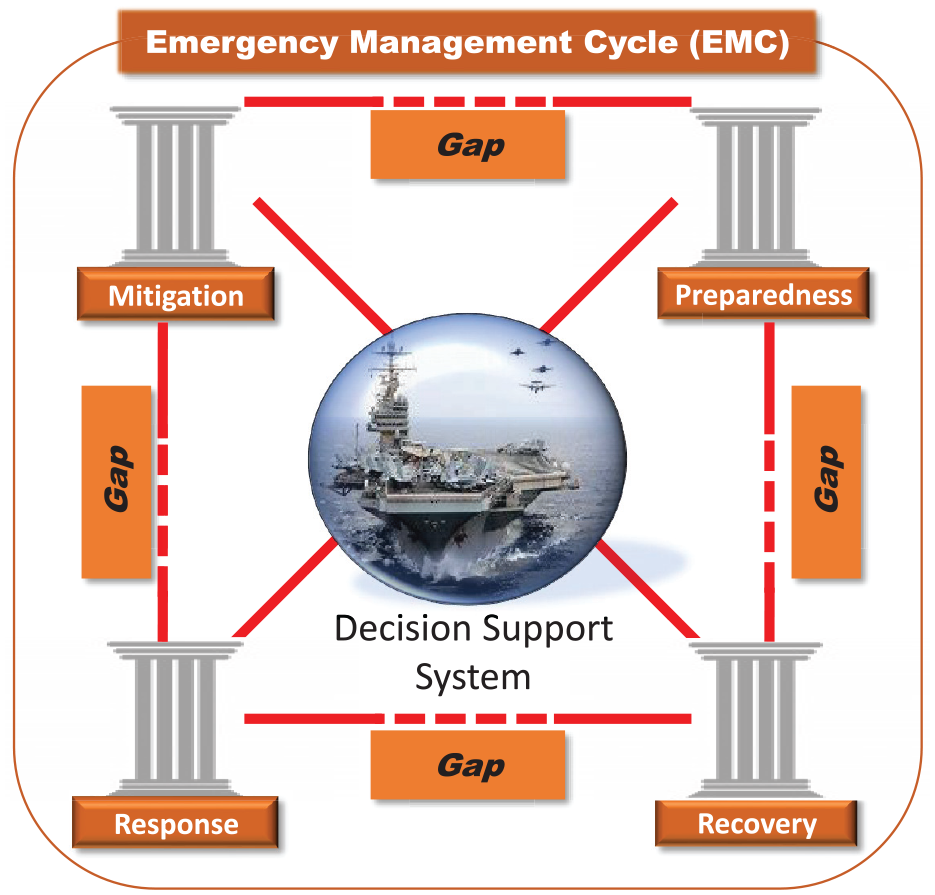
Technological gaps in the EMC between all causal phases: (1) mitigation (preventing steps), (2) preparedness (precaution measures), (3) response (immediate actions), and (4) recovery (actions to return to normal mode). Source of the USS Theodore Roosevelt image is Wikipedia.
The answers to the above challenges lie in the usage of the CI approach called machine reasoning, namely, causal models such as causal networks. These causal models operate using probabilities, thus accounting for uncertainties, and enable knowledge inference based on priors and evidence. 5 This approach has been applied to risk assessment in multiple areas of engineering and business, 6 risk profiling in identity management,7,8 medical diagnostics, 9 and very recently to the analysis of COVID-19 risks such as fatality and disease prevalence rates. 10
The causal models shall be the core component of the system that will support human decisions made during an infectious disease outbreak by assessing the different risks associated with the outbreak.
The system concept was once known as an “expert system.” Such a system provides certain automation of reasoning (though mainly based on deterministic rules rather than causal network approach) and interpretation strategies to extend experts’ abilities to apply their strategies. 11 Examples of contemporary DSS include personal health monitoring systems 12 and e-coaching for health. 13
2.1.2. EI models
EI is a systematic event detection aimed to detect early warning signs of public health emergencies. 2
Epidemiological models14,15 are based on mathematical models that utilize both the biological knowledge and mechanism of the epidemic or pandemic and the available statistical data that represent the phenomenological part of the model. They aim at estimating the outbreak risks and transmission routes, incubation and infectious periods and their statistical distributions, length of latency, inferred transmission chains, etc. They are generally divided into individual-based models (based on individual characteristics such as age, spatial location, gender, and immune status), and compartmental models (based on the states of subjects being susceptible, infectious, immune, and recovered).
2.2. Introduction to the USS TR outbreak
2.2.1. Epidemiological measures
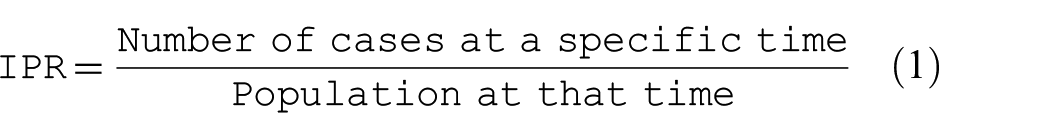
The infectious disease risk known as infection prevalence rate (IPR), is defined as the proportion of the number of current cases at a specific point of time to the population at that time 16 :
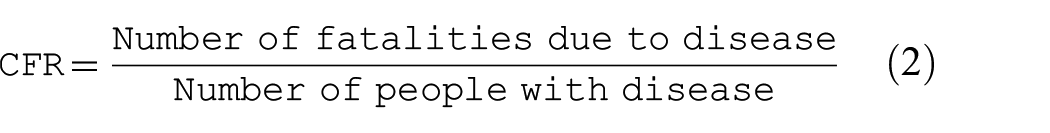
A metric for measuring the seriousness of the disease is the case fatality rate (CFR). It is defined as follows:
The infectious disease risk called an attack rate, also known as incidence rate, is defined as the proportion of the new cases at a certain point in time to the population at that time 16 :
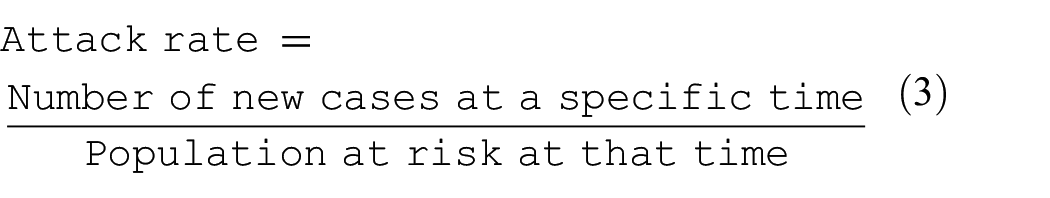
Note that the population at risk is a fraction of the population, i.e., those who are not yet infected.
2.2.2. Epidemiological situation and commander’s response
The first three subjects have self-identified themselves; they have lost the sense of smell, but were sent back to work; three others tested positive and were quarantined. On March 25, a total of four infected sailors were taken away by a helicopter. We assume that only infected sailors were quarantined in the following few days, as indicated in the denominator of the attack rates in Table 1. On March 29, the captain lifted the quarantine. As of May 5, 1156 crew members have tested positive. This is about 24% of the initial population; taking into account evacuations, this number might be higher.
Observed infection risks within the first six days of the first identified cases at the USS TR.
2.2.3. Critical analysis
Critical analysis of epidemiological attack (Table 1) and the Commander’s response led to the following conclusions.
The commander made decisions under deep uncertainties such as unknown infection, unknown spreading characteristics, unknown fatality rate, and unknown period of contagion.
The commander was in need of reliable decision-making support when given uncertain, incomplete, imprecise, and possibly conflicting information, both qualitative and quantitative. Thus, the modeling and simulation (M&S) approach is the only way to help the commanders better manage situations under uncertainty.
2.2.4. Vision of horizon
Our work makes a step forward to prepare for future epidemic attacks and proposes an intelligent DSS with M&S of various epidemiological scenarios. We project the EMC onto the DSS life cycle; we state that such DSS must be operational at the mitigation, preparedness, response, and recovery modes distinguished in the EMC doctrine. According to the DARPA’s program, 17 intelligent tools such as the DSS, must satisfy the requirements such as interpretability and explainability, i.e., the recommended decisions should be understandable to the user. This DSS has been created using the data of the current COVID-19 attack of the USS TR, and can potentially be instrumental in assessing the epidemiological risks for both military and civil “closed” communities such as ships or isolated city clusters. We experimentally show how a commander can be supported in a few typical scenarios such as assessing the effectiveness of the preventive measures and other analyses of the epidemiological landscape.
3. Problem formulation and contribution
The struggle with the COVID-19 outbreak worldwide revealed many technology–society gaps in the EMC. This paper contributes to bridging the gaps, and consider a particular pandemic case in a closed-set scenario such as the case of the NATO flagship USS TR. The management decisions have been widely discussed in the media and some data have been made available.
Central research question:
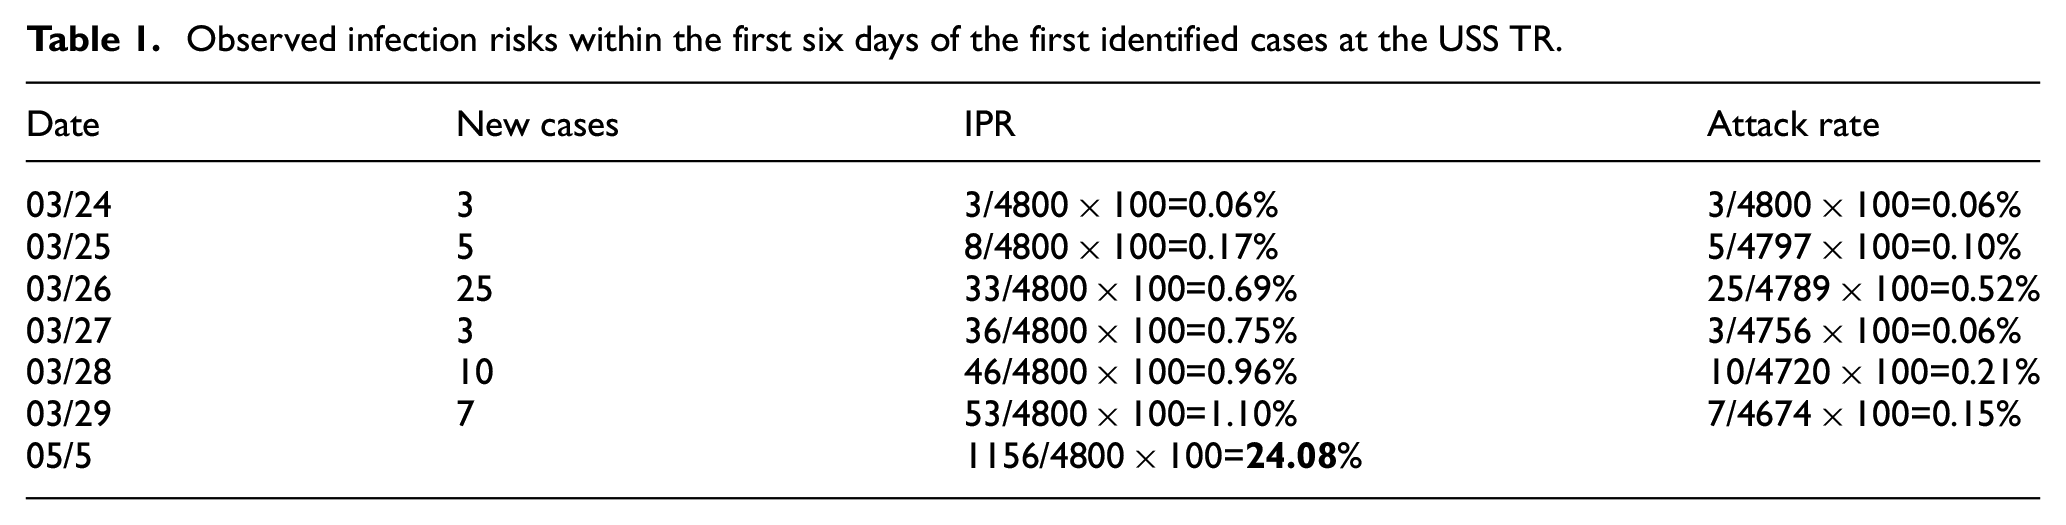
We propose the following strategy to answers the above question (Figure 3):
Step 1: Problem formulation as the EMC causality landscape.
Step 2: Problem specification as gap identification.
Step 3: Problem description using the causal networks.
Step 4: Solution using machine reasoning.
The strategy for the solution is a four-step process, starting with a causal description of the EMC landscape (Step 1) and proceeding to design a DSS with a machine reasoning mechanism (Step 4). Intermediate Steps 2 and 3 identify the gaps and build a causal network as the DSS core.
3.1. Limitations
The data used in this case study is obtained after the fact of the epidemic outbreak, the reasoning is evidential, and, thus, reactive rather than proactive. It stands to reason that when using these data as the situation develops, new knowledge is accumulated and can be used for predicting the effect of future outbreaks.
3.2. Contribution
The key contribution is the novel causal landscape for the EMC and its translation into a DSS built on machine reasoning.
4. EMC phases, causality, M&S
The EMC of a civilian community or a military unit includes the following epidemiological phases: mitigation, preparedness, response, and recovery. 1 The countermeasure applied at any of these phases can be a success or failure, caused by the existing technology and societal gaps.
To illustrate these gaps, we provide a graphical notion of the standard EMC concept in Figure 2. This representation reflects the causal-and-effect relationships between the EMC phases.
4.1. EMC as a system of systems model
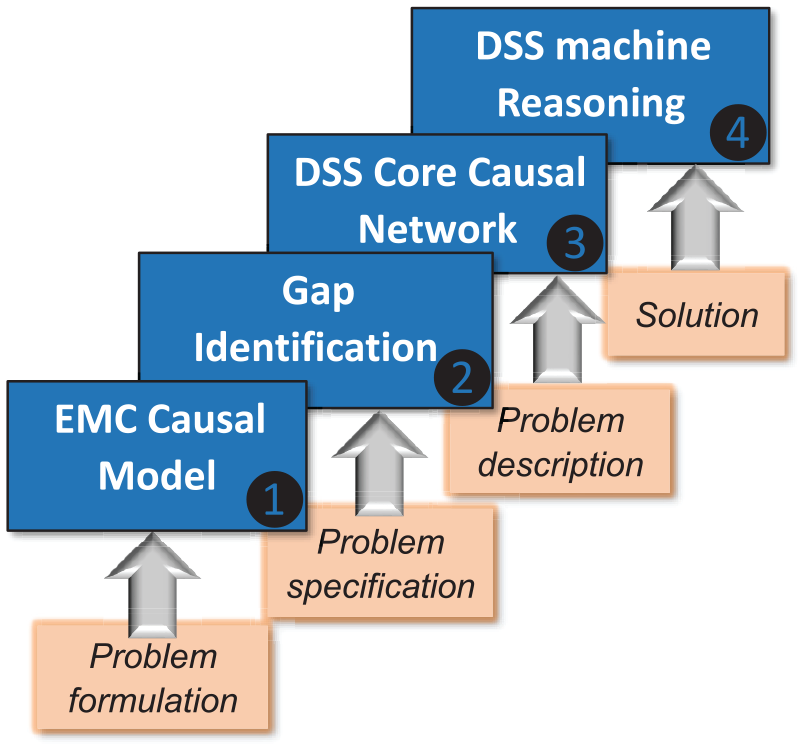
The causal landscape of the EMC is represented by the following hierarchy of networks as shown in Figure 4. Each EMC phase is represented by its corresponding modeling networks and simulation principles. The mitigation phase consists of the states such as reliability of assessment resources, losses, and planning; the preparedness phase includes risks of various strategies, the trust of precautionary measures, as well as the risk of biases in data processing and decision-making; the response phase is represented by the risk decision states; the recovery phase is a causal network of recovery actions. Hence, Figure 4 represents the system of systems (SoS) architecture that is characterized by operational and managerial independence of each EMC phase, evolutionary development, geographic distribution, and emergent behavior. 18 Specifically, the EMC of the DSS is characterized by the following properties.
Complexity: Interactions between the components are complex. This requires a well-structured M&S, e.g., an arbitrary state of the response phase is in a causal relationship with the selected states from mitigation and preparedness phases.
Concurrency: The number of the EMC states is large; the states may be concurrent, e.g., in modeling, a given state of the response phase may be concurrent with the R&D processes from both the mitigation and preparedness phases.
Specificity: The number of application scenarios is large, and each of them requires a particular simulation, e.g., each epidemiological scenario is a subject of particular consideration.
Adaptivity: The EMC is adaptive by nature, that is, the structure of the EMC and its configuration can be changed in order to reach better performance, e.g., using the parameters such as vaccination and virus spread characteristics.
Each EMC phase (mitigation, preparedness, response, and recovery) can be represented by a causal network. The EMC phases are related as shown by the red lines.
A system with these properties, i.e., the EMC, is a typical discrete event system that requires a modular and hierarchical formalism for the modeling. A proven universal modeling platform for a such system is DEVS, a Discrete Event system Specification. 19 In this work, SoS includes the intelligent components with adaptability properties that are combined on the DEVS platform. Zeigler et al. 19 formulated the requirements to the development of the healthcare M&S infrastructure: most of them are acceptable for the EMC such as organizational structure and ontology, macro behaviors, a large spectrum of models, and high quality of data.
4.2. Epidemiological profiling of military units
From an epidemiological point of view, military ships such as the USS TR are unique environments that demand specific technological and societal solutions and countermeasures:
− they are closed-set infrastructure that includes purpose, specific, isolated spaces, as well as heat, ventilation, and air conditioning system;
− any contacts between crew members can be traced efficiently due to the specified daily routines;
− the population (crew) statistics such as age, race, gender, and health status are known.
These unique characteristics make it easy to implement advanced tracing technologies, including wireless sensing, continuous health status monitoring, and reliable isolation for quarantine. This is also one of the reasons to consider the handling of the COVID-19 outbreak as a motivational example in our work.
5. DSS reasoning mechanism
The core of the proposed DSS is a causal network that allows us to perform reasoning. The reasoning operations are defined as follows.
(1) Prior data representations and assessments, such as statistics and distribution of data after an outbreak that has already happened, as well as the pre-existing conditions. In causal modeling, the priors are represented by a corresponding probability distribution function.5,20
(2) Causal analysis is based on the “cause–effect” paradigm.5,20 Another advanced tool is Granger causality analysis, usually used to analyze time series and to determine whether one can forecast the other. 21
(3) Reasoning is the ability to form an intelligent conclusion or judgment using the evidence. Causal reasoning is a judgment under uncertainty performed on a causal network.5,20
(4) Prediction. In complex systems, meta-learning and meta-analysis can be used to predict the overall success or failure of the predictor. The most valuable information is in the “tails” of the probabilistic distributions.22,23
5.1. Classes of causal networks
A causal network is a directed acyclic graph where each node denotes a unique random variable. A directed edge from node
A recent review 24 described the various types of causal networks that are deployed in machine reasoning, e.g. Bayesian, imprecise, interval, credal, fuzzy, and subjective networks. The type of causal network is chosen based on the given DSS model and a specific scenario. The choice depends on the scenario as well as the CUT as a carrier of primary knowledge. Various causal computational platforms for modeling several systems were compared, in particular, Dempster–Shafer versus credal networks 25 and Bayesian versus interval versus Dempster–Shafer versus fuzzy networks.7,8
In our study, among various causal networks, we have chosen to use Bayesian causal networks. Our motivation for this choice is driven by the fact that the Bayesian (probabilistic) interpretation of uncertainty provides acceptable reliability in decision-making.
In a Bayesian network, the nodes of a graph represent random variables
Probabilistic reasoning on causal (Bayesian) networks enables knowledge inference based on priors and evidence has been applied to diagnostics for precision medicine. 9 Recently, COVID-19 risks analysis was performed using the Bayesian inference to learn the proportion of the population with or without symptoms from observations of those tested, along with observations about testing accuracy. 10
5.2. Risk assessment
In ES, the risk is simply a rate such as the infection incidence rate, also known as the attack rate, and the IPR. 16 Another component for risk assessment is the CFR. In this study, CFR is treated as a hidden variable in the DSS due to the lack of information regarding the fatalities on the USS TR. The risk measures are used in ES in simple forms such as “high-risk group,”“risk factor,” and “systematic difference in the enrollment of participants.” 26
In DSSs, risk and other “precaution” measures such as bias and trust are often used to evaluate a cognition-related performance. 27 The DSS is expected to provide the experts with detailed assessments of epidemic scenarios and make the decision process more transparent and explainable. For example, syndrome surveillance consists of real-time indicators for a disease allowing for early detection. 26
The experts seek advice from the DSS in answering the following questions.
What are the risks given the state of the disease outbreak and the health care resources?
How reliable are the surveyed or collected data?
What kind of biases are present or expected in data collection, algorithms, and CI decision making?
The risk in the decision-making context is defined by the US National Institute of Standards and Technology (NIST)
28
as “a measure of the extent to which an entity is threatened by a potential circumstance or event, and typically is a function of: (i) the adverse
In particular, risk of a decision upon a certain action is a function

Acceptance of the cognitive DSS technology by human decision-makers is determined by the combination of bias, trust, and risk factors.29,30 Other contributing factors include belief, confidence, experience, certainty, reliability, availability, competence, credibility, completeness, and cooperation.31,32 In our approach, the causal inference platform calculates various uncertainty measures 27 in risk and bias assessment scenarios.
5.3. NATO standards for the decision support
Risk, trust, and bias manifest themselves in various ways, such as the reliability of information sources (e.g., infection survey data) and the credibility of the information (e.g., testing procedure accuracy):

This relationship can be represented as follows.
(a) Source reliability as the quality of being reliable, or trustworthy, is related to (1) risk as a function of potential adverse impact and the likelihood of occurrence, (2) confidence in the quality, and (3) bias as a systematic over- or under-assessment of the parameter of interest.
(b) Information credibility is the reputation impacting one’s ability to be believed. In ES and EI, in particular, it can be associated with the credibility of infection testing technology.
The above metrics of uncertainty closely resemble the ones known as the Admiralty Code defined in the NATO Standardization Agreements such as STANAG 2022 and STANAG 251133 (Figure 5). NATO uses the Admiralty Code to resolve conflicting scenarios in human–human, human–machine, and machine–machine interactions. The reliability of the recommended decisions can be increased by using more reliable sources and creditable information, or it can be diminished due to a lowered reliability of the source and/or credibility of the information. For example, scenario
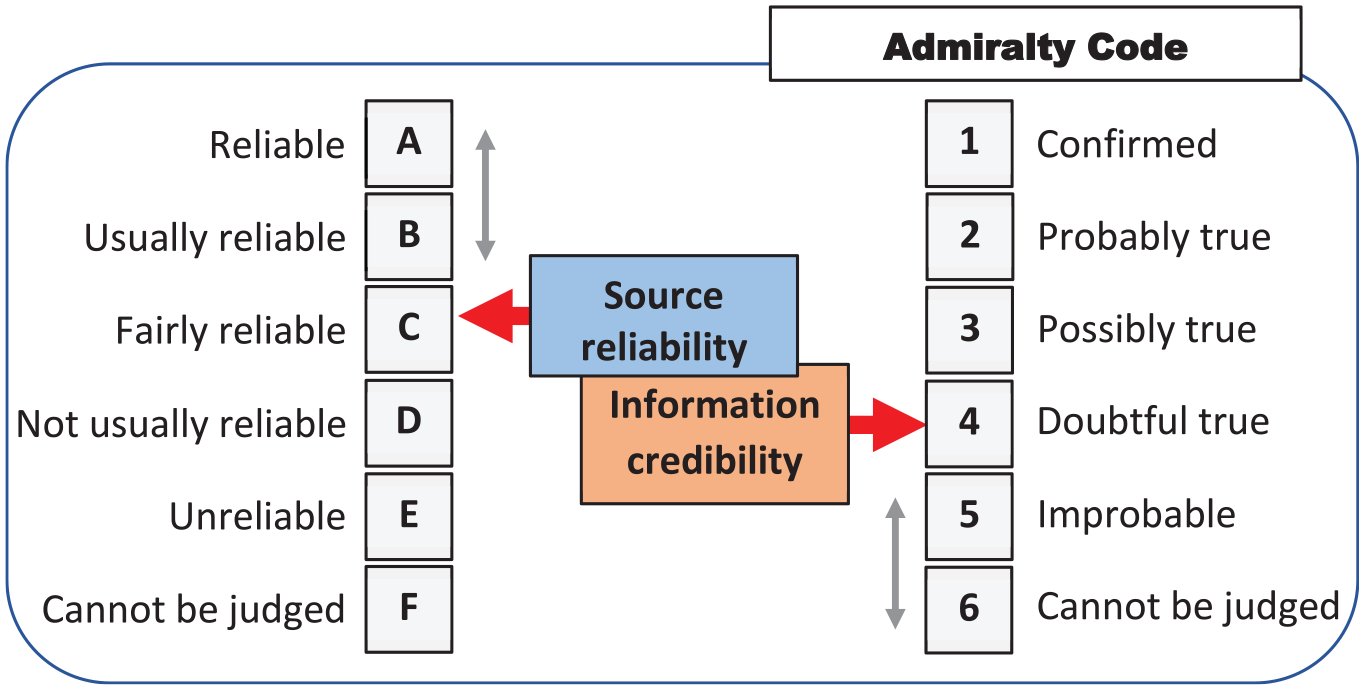
The manifestation of risk, trust, and bias via assessments of the reliability of the source and the credibility of information using the admiralty code.
6. EMC causal model for USS TR
During the time of deployment of the USS TR around March 2020, an outbreak of COVID-19 occurred that affected marines (younger healthy adults). Approximately a quarter of the service members were determined to be infected with COVID-19. An investigation conducted by the US Navy and CDC during April 20–24 includes a study on 382 voluntary service members. 34
6.1. Three-level causal hierarchy interpretability
A causal network is a directed acyclic graph in which each node denotes a unique random variable. A directed edge from node
Partitionable: any causal network can be represented by a set of smaller networks, i.e., decomposed. 35
Updatable: this is an inherent property of causal network. 20
Tractable: efficient learning in scenarios of partially observed data. 36
Robust: interpretable uncertainty caused by different ways of formalization.7,24
Interpretable: three-level causal hierarchy ensures this property. 5
Concept compatible: deep learning can support causal reasoning in order to achieve a synergy of various CI concepts. 37
The formalism of the interpretable DSA is represented by Pearl’s three-level causal hierarchy interpretability. 5
−
−
−
Three-level causal hierarchy interpretability is an inherent property of the DSA. Note that interpretability and explainability are the central requirements to all intelligent tools. 17
In our study, we created a fragment of a causal network based on the available data (Figure 6). The main risk assessed in the DSS using the causal network is the IPR. The other risks are shown as hidden variables (gray color), since there was not enough data reported on the case to include them in the numerical analysis. Those hidden risks include the reliability of testing related to errors in conducted serological tests. We combine the variables in the network according to the EMC phases as per Figure 4, although not all variables of influence are included in this study. In particular, the iterative process between the EMC response and recovery phases in Figure 6 is simplified and introduced only by factor “infection rate.” In reality, as we observe the unfolding pandemic, this process is represented by a set of harmonized epidemiological measures including the infection and vaccination rates, the cost of restrictions, and societal factors.
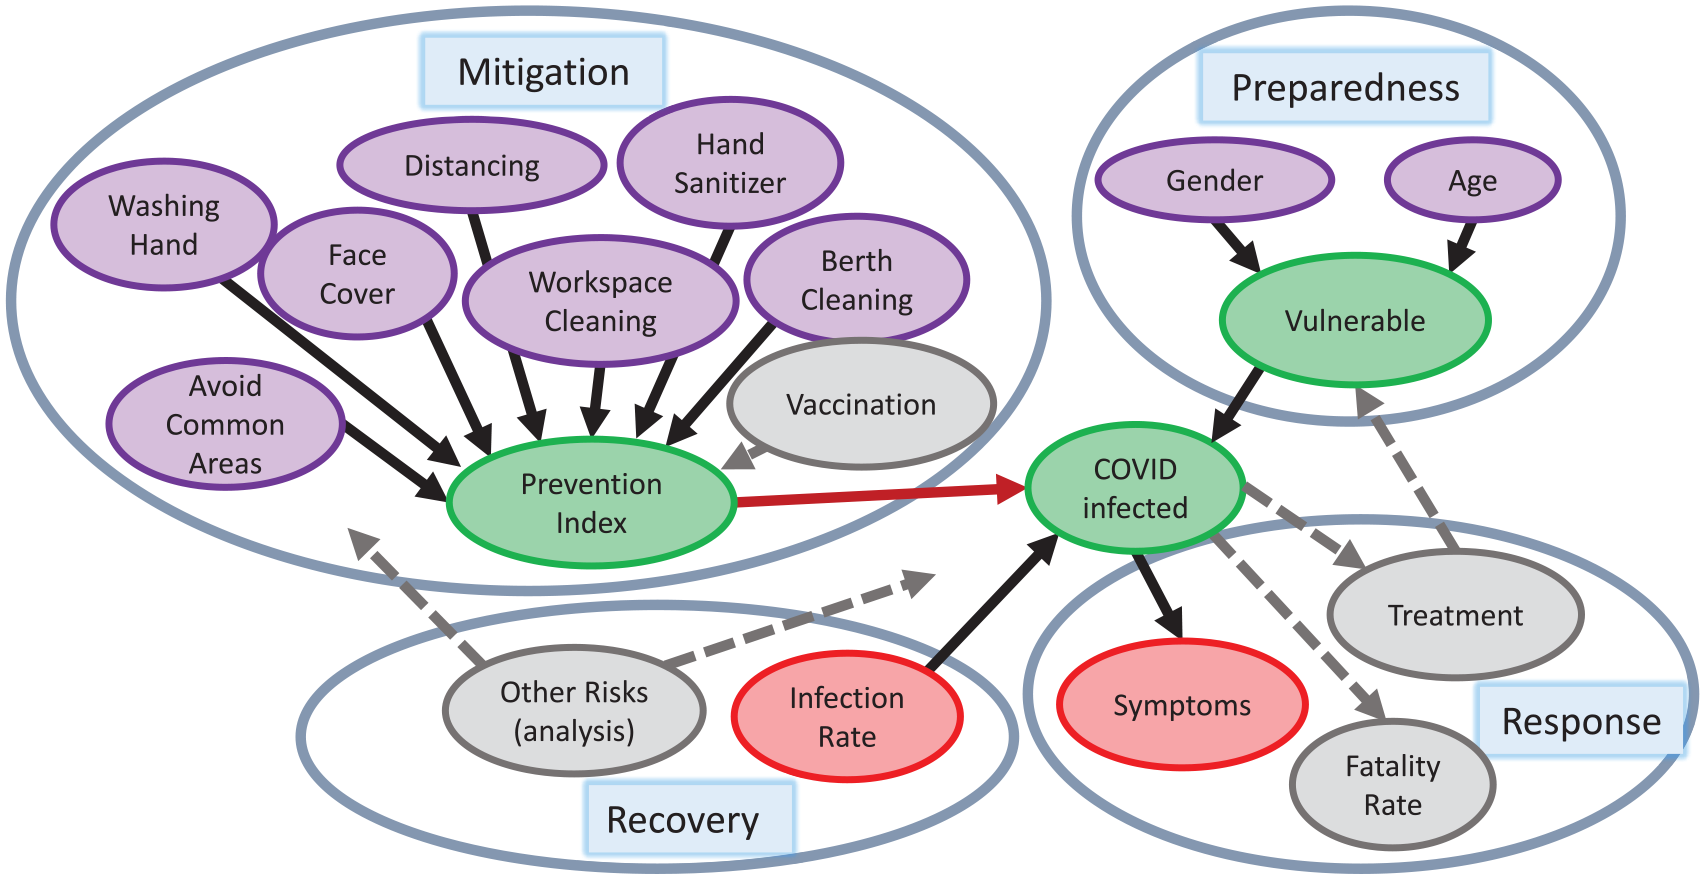
Causal network for the case of the USS TR data. The variables/nodes are grouped according to the EMC cycles (mitigation, preparedness, response, and recovery), whereas gray color indicates hidden nodes that are not included in the numerical calculations. The gray arrows indicate hidden connections that exist between the different nodes.
6.2. Data collection and causal network design
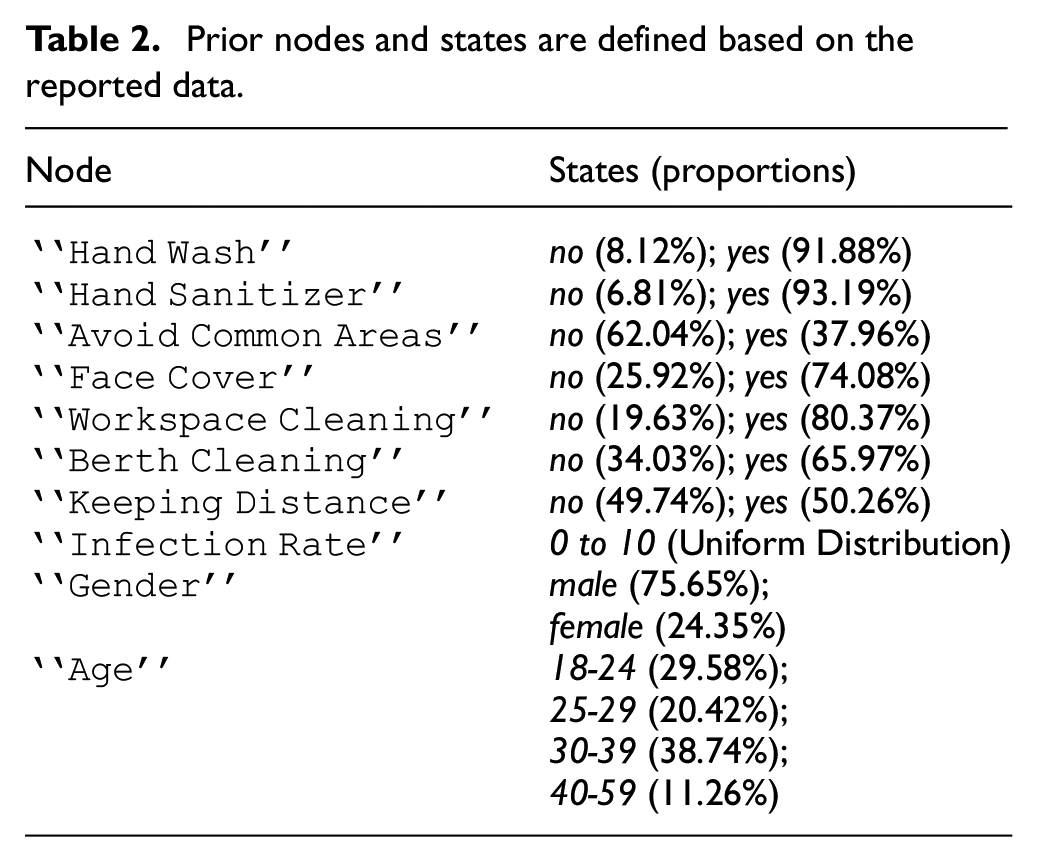
Table 2 lists all the nodes in the network and their corresponding states and probabilities. The probabilities for the prior nodes in Table 2 are captured based on the statistics collected by Payne et al. 34 For example, in Payne et al. 34 there is a total of 382 volunteers, of which 351 volunteers reported washing their hands as a prevention measure. This results in the probabilities of 8.12% (31/382) of volunteers who were not washing their hands, and 91.88% (351/382) of those washing their hands. In this paper, we assume a uniform distribution for the node “Infection Rate” as no value was given by Payne et al. 34 It should be noted that this value is approximately 70% (1000/1417) for the USS TR, based on the reported results. 34
Prior nodes and states are defined based on the reported data.
6.3. Infection rate and prevention index
We use the definition of IPR as stated in Equation 1, as the “Infection Rate.”
The chance of infection is influenced by a variable called a prevention index (PI).

where subscript
In other words, the
283 volunteers used face covers as a preventive measure;
158 of these volunteers reported having COVID-19;
238 total volunteers reported having COVID-19.
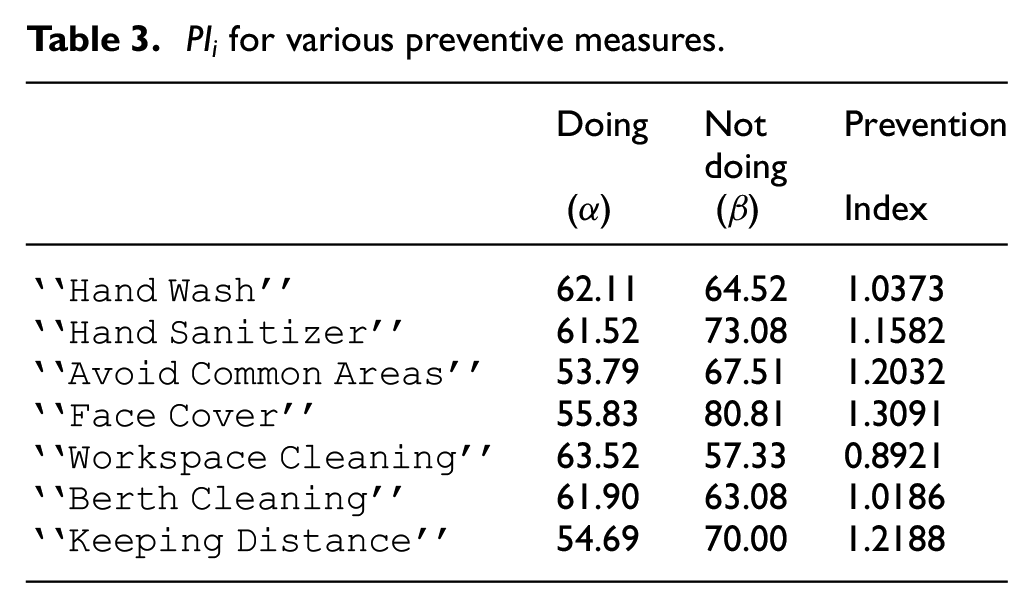
Combining the above data, we get 55.83% (158/283) and 80.81% (80/99) of having COVID-19 for the subjects who used face cover or not, respectively. Using Equation (5), a
The CPT for the variable “Prevention Index” represents a distribution of the cumulative PI. The cumulative PI is calculated based on the product of the individual preventive indices:

where
Example 2. The PI for no preventive action taken is equal to 1. Using Equation (6), and assuming the“Hand Wash” is applied, the index is
The variable “

where
Example 3. Given that the probability of having COVID-19 for the age group 18–24 is 68.1% and the probability of having COVID-19 for gender group male is 65.7%, the degree of vulnerability is computed as follows according to Equation (7):

The two CPT tables, for the nodes “
CPT for the node
CPT for the node
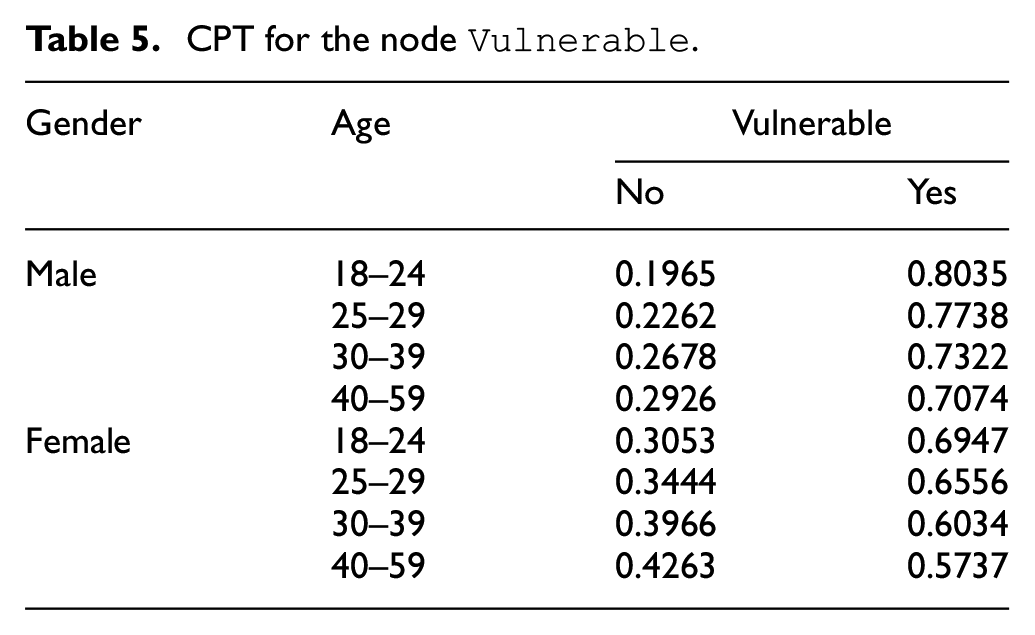
The CPT for the variable “

In Equation (8), the IR is reduced based on the PI and then multiplied by the value (
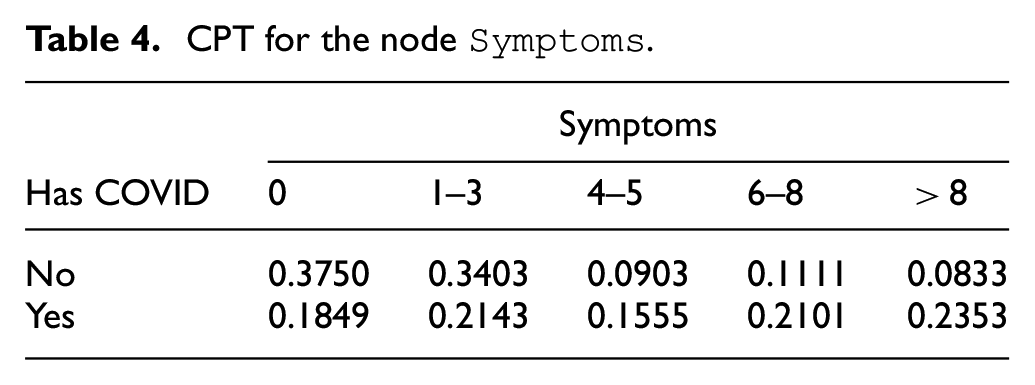
The remaining nodes “Symptoms” and “Test” have CPTs created directly based on the data from Payne et al. 34

The list of the COVID-19 symptoms reported by Payne et al. 34 included loss of taste, smell, or both, palpitations, fever, chills, myalgia, cough, nausea, fatigue, shortness of breath/difficult breathing, chest pain, abdominal pain, runny nose, diarrhea, headache, vomiting, and sore throat. Note that, in this paper, we considered the number of symptoms and not their type.
6.4. Serological test errors and reliability
This subsection discusses the reliability of tests which is a hidden variable shown in Figure 6. Although this theme is not included in the investigated scenarios, the test reliability is related to overall decision credibility.
Given the reported test results based on two types, enzyme-linked immunosorbent assay (ELISA) and real-time reverse transcription polymerase chain reaction (RT-PCR), error rates such as the false positive rate (FPR) and false negative rate (FNR) can be estimated. The designed Bayesian network includes a “Test” node representing the results of ELISA and the previous RT-PCR test results. Given:
true negative (
true positive (
false positive (
false negative (
Definition 2. False positive rate (FPR) and false negative rate (FNR) are defined as follows:

The risk of error depends on the rates such as FPR and true positive rate (TPR) and FNR and true negative rate (TNR). The overall risks of such errors are defined as follows:


where
Example 5. Assume that RT-PCR test results are ground truth and ELISA test results are predicted cases. Based on this assumption, FPR and FNR are calculated to be 10.88% (16/147) and 9.79% (23/235), respectively. With the given effect, or cost of such errors (very high = 4, high = 3, low = 2, very low = 1), the overall risk is computed as follows:
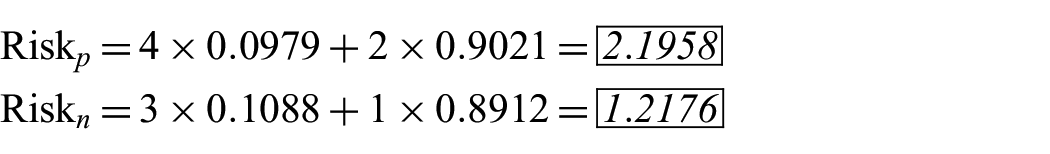
The maximum value of positive risk is 4 (FNR=100%) and the minimum value is 3 (FNR=0%). These two cases represent the extreme cases where either all infected subjects are misdiagnosed or correctly diagnosed. Similarly, the maximum value of negative risk is 3 (FPR=100%) and the minimum value is 1 (FPR=0%). The two cases represent the extreme cases where either all healthy subjects are misdiagnosed or all of them cleared.
7. DSS application scenarios
The causal reasoning using the Bayesian network shown in this section was implemented using the open-source Python library pyAgrum 38 .
The following scenarios were considered in our experiments.
DSS Scenario 1: The effects of increasing the “Prevention Index” with a constant “Vulnerability” and “Infection Rate” on “Has COVID.”
DSS Scenario 2: The influence of “Symptoms” on “Has COVID.”
DSS Scenario 3: The effect of “Has COVID” on “Vulnerable.”
DSS Scenario 4: The predicted “Infection Rate” given “Symptoms” and “Prevention Index.”
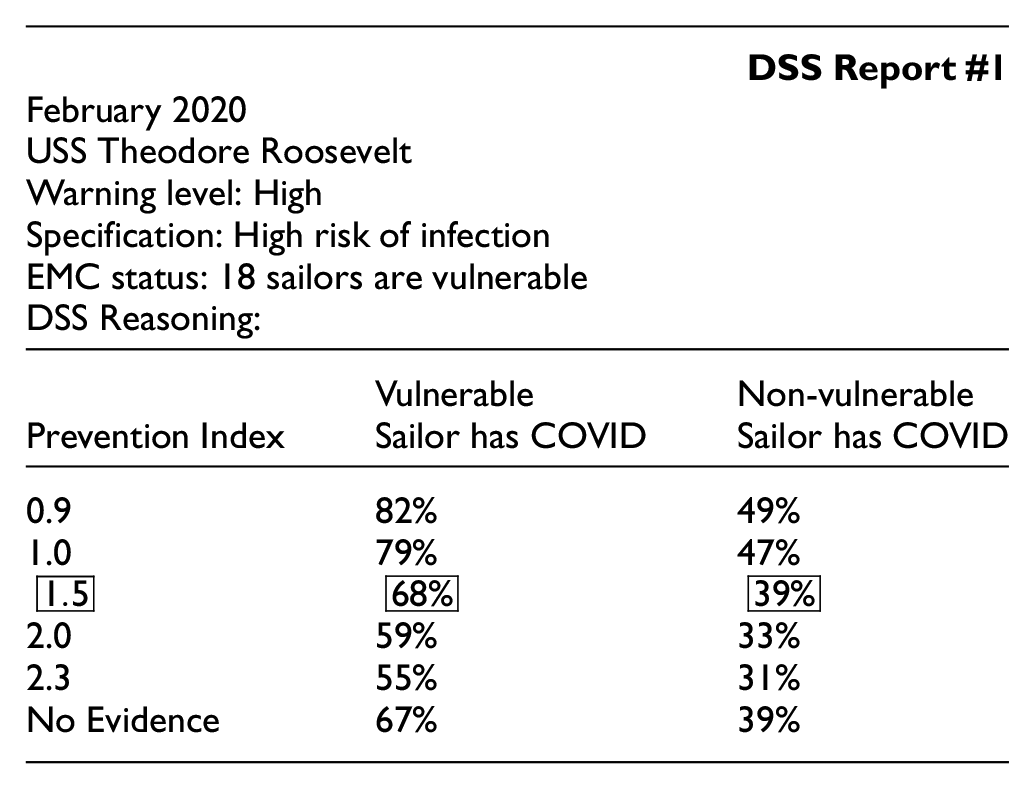
7.1. Scenario 1: Preventive measures
Scenario 1 explores how different preventive measures influence the chance of the sailors being infected with COVID-19. The DSS data to the captain is presented as shown in the following report.
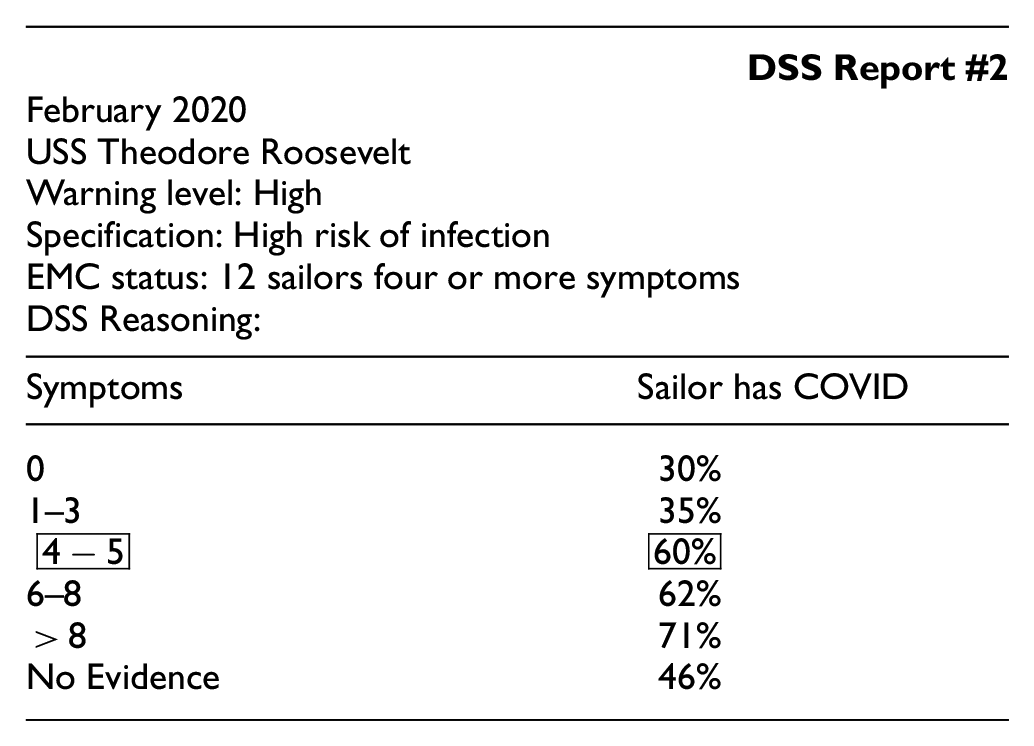
7.2. Scenario 2: COVID symptoms
For scenario 2, the causal relationship between the number of symptoms and the fact of having COVID-19 is analyzed. As the number of symptoms increases, the chance of the individual having COVID-19 increases proportionally. For asymptomatic sailors, the chance of having COVID-19 is 29.67%. It increases to 59.57% for the subjects having 4-5 symptoms.
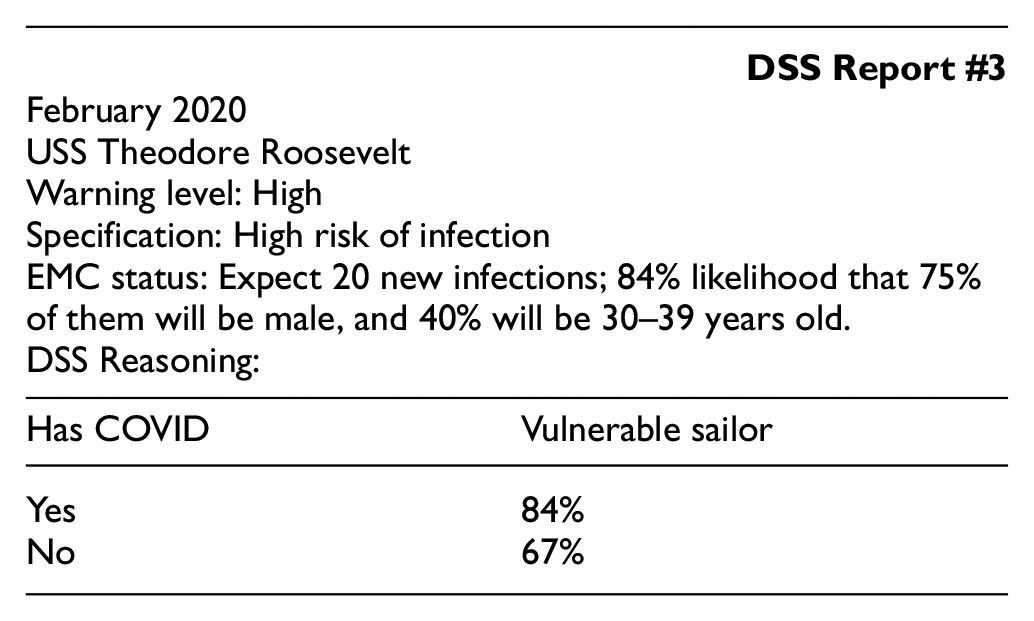
7.3. Scenario 3: Vulnerability and COVID
Scenario 3 considers how to infer the chance of a subject being vulnerable to the infection given the evidence of having COVID-19.
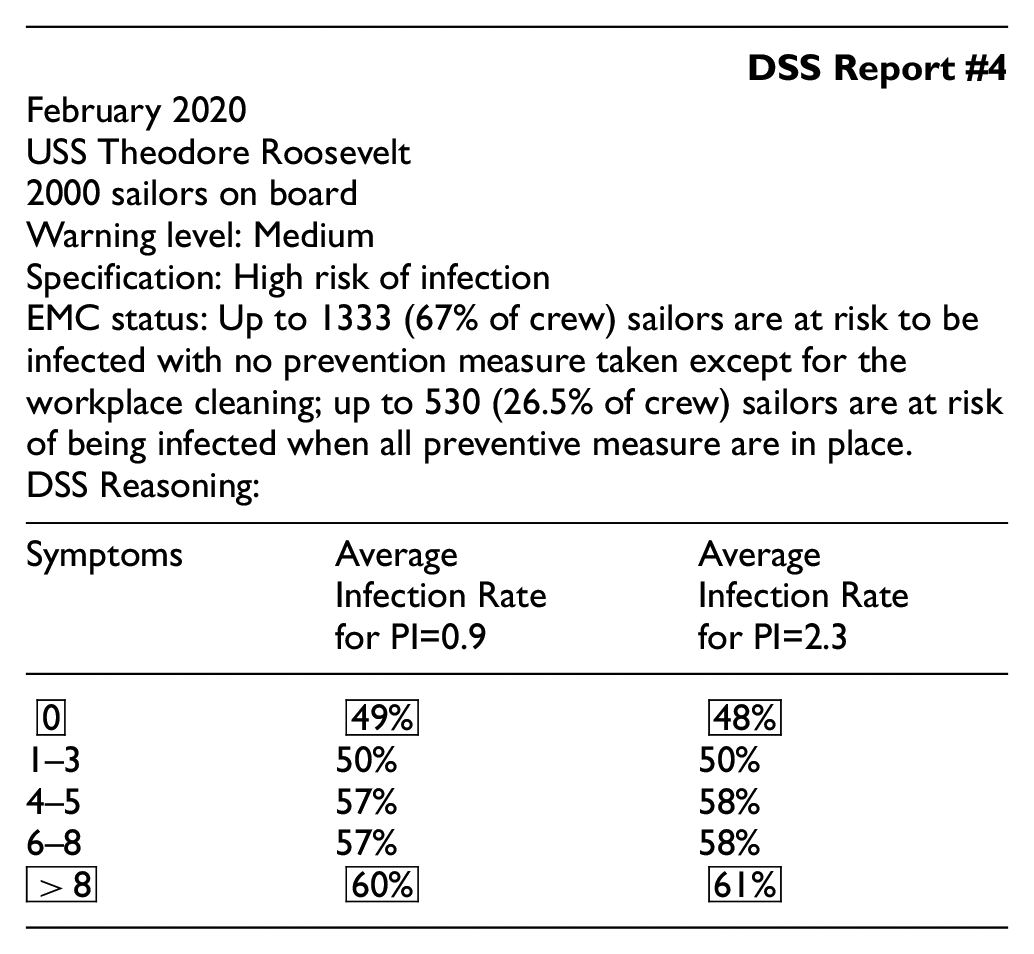
7.4. Scenario 4: IPR
Scenario 4 estimates the IPR, or Infection rate, given various evidence for both the number of symptoms and preventive behaviors.
This scenario shows that there is a minimal relationship between the PI and IPR because they are independent of each other; however, they both affect the chance of contracting COVID-19 which, in turn, causes various amount of symptoms.
This indicates that inaction (no preventive measures,
7.5. A software platform for experiments
PyAgrum is a C++ aGrUM library (using SWIG interface generator). It provides an interface to the part of aGrUM allowing us to create, model, learn, use, and embed Bayesian networks and other probabilistic graphical models. 38 Figure 7 illustrates the proposed Bayesian network (Figure 6) with the populated conditional probability values. In this scenario, the tables in white illustrate the probability when no evidence is given, that is, for example, the “hand_wash” node shows an 8.17% probability of “no hand-washing” and a 91.81% probability of “hand washing.” These probability values represent on average a chance of a sailor performing this action. The tables highlighted in orange represent the cases where evidence is provided. For example, for the age node, evidence shows the subject’s age is between 40 and 59, therefore, there is a 100% probability of being in that age group and 0% probability otherwise. Based on these three pieces of evidence, the network infers that there is a 52.02% chance that the sailor has COVID. In addition, the prevention index value of an average sailor is 1.17 with 69.82% of him/her being vulnerable.
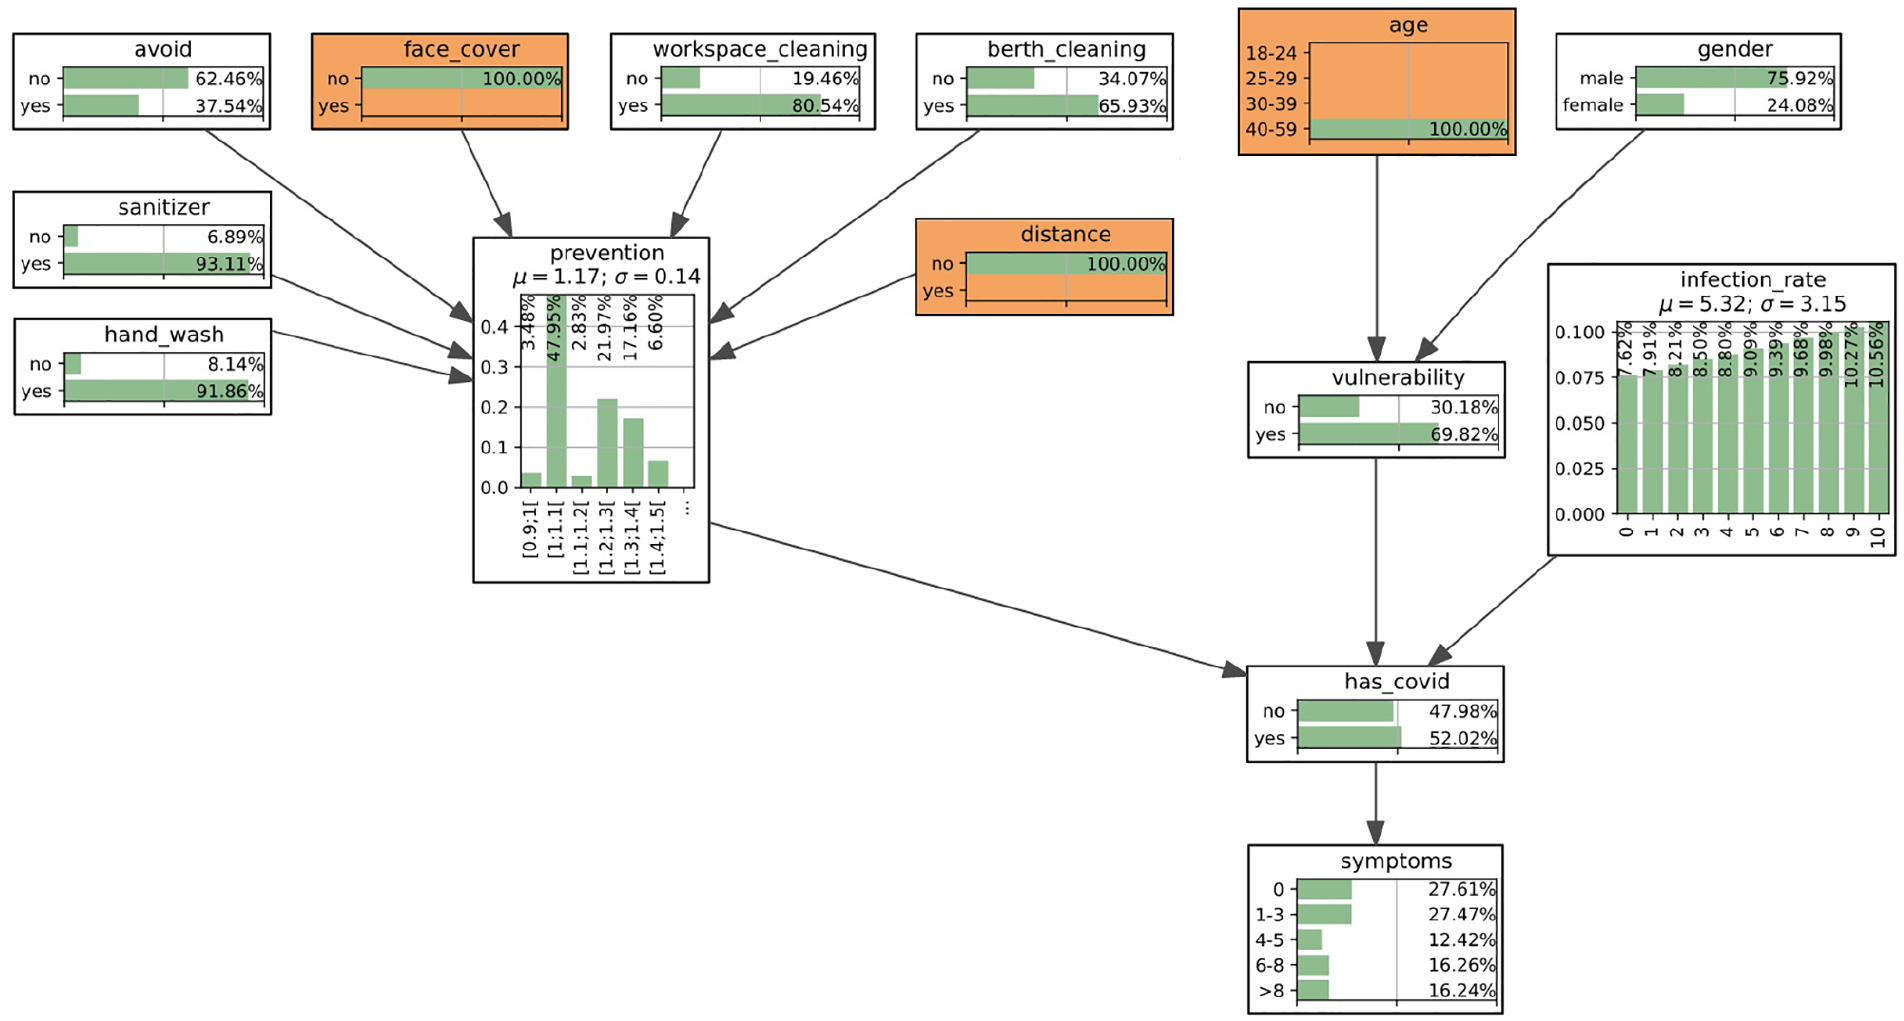
A screenshot of the Bayesian network example generated using PyAgrum. The marginalized probabilities (CPT) are shown for each node. Three pieces of evidence are set (highlighted in orange): not using face cover, not keeping distance, and the age between 40 and 59.
8. Conclusions, limitations, and future work
8.1. Conclusion
We argue that the intelligent DSS for epidemiology profiling shall become an integrated part of EMC for military units such as the aircraft carrier USS TR. This profiling is based on the causal network approach that allows for the analysis of the variables of influence. The proposed causal approach work can be useful for other military units and civil communities. However, the efficiency of the proposed EMC model and performance of intelligent DSS depends on logistics, infrastructure, and conditions, i.e., epidemic scenarios.
8.2. Limitations of the EMC causal model
Given the proposed EMC causal model, there are several limitation/assumptions including:
insufficient amount of data to capture the true causal relationship;
the CPT of the causal network nodes are populated based on simplified equations and approximations/assumptions;
there is also an assumption that each prevention measure is independent, while in reality they might be related; and
there are various biases in the EMC model that are not taken into attention.
8.2.1. Insufficient amount of data
As indicated earlier, some causal relationships are inferred based on the data. Therefore, in the case of insufficient data, some relationships can be misleading and/or missing. For example, data regarding spatial location and congestion of the crew is currently missing. Selected mariner may be required to walk through the ship to the targeted areas due to their duty, and this required movement may result in an increased chance of infection.
8.2.2. Approximations and assumptions
As well, the nodes such as “Has COVID,”“Vulnerable,” and “Prevention Index,” are populated based on the proposed equations. These equations only illustrate the general, not necessarily the exact relationship, and were derived for the given scenario, and may require modification when transferred to another study. For example, age, gender, and preventive behaviors can greatly increase or decrease the chance of infection, but this relationship cannot be captured by deterministic equations.
8.2.3. Independence
In this study, we assume that the seven preventive behaviors reported by the volunteers in Payne et al. 34 are independent. This assumption is not sufficient, as sailors can generally be classified as risk-averse or risk-tolerant. Risk-averse individuals are much more likely to take preventive measures, that is, the sailors that use face masks are also those who maintain a social distance.
8.2.4. Biases
Bias in the sampling of data can severely affect the causal network model, specifically the creation of the CPTs in the EMC model. Bias refers to the tendency of an assessment process to systematically over- or under-estimate the value of a population parameter. In the USS TR case, there is a significant bias regarding the crew composition of younger males. Based on the collected data, 34 the age group 18–24 contains the most members but also contributes to the largest percentage of having COVID-19 (68.1%), whereas the age group 40–59 contains the least amount of infected members (55.8%). This contradicts the belief that older people are more vulnerable. Possible reasons for this contradiction may be that younger people are prone to more interactions, whereas older people take more precautionary measures, as they are more likely to be of higher rank on the ship and have different duties requiring less contact. Lastly, all the data collected by Payne et al. 34 were collected on a volunteer basis, and, therefore, represent only a fraction of the ship population.
8.2.5. Trustworthiness
The reliability and trustworthiness of the CI-based tools such as the described DSS are related to the credibility of the information source and, first, the reliability of testing. The latter depends on the maturity of the testing technology, and other factors. It may also be biased due to flu seasons as many of the symptoms are similar to the flu.
8.3. Future work
8.3.1. Risks, trust, and biases
Key research questions of future work address risks, trust, and biases of intelligent DSS. Given a recommended decision, we have the following questions.
How reliable is this DSS recommendation?
Can the captain trust the DSS recommendation?
What kind of biases can be expected from intelligent DSS?
There are several related studies on the risk–trust–bias causal landscape, e.g., in biometrics 4 and military medicine. 39
8.3.2. Alternatives to the EMC causal model
There are several alternatives to the causal models used in EMC modeling at both the global and local levels. In Section 4, the global level of the EMC modeling is described. An alternative to the EMC global causal model is a universal M&S platform, e.g., DEVS. This M&S alternative is useful due to the following perspectives.
The efficiency of causal networks is limited by their complexity, i.e., the required size of the CUTs or CPTs in the Bayesian networks.
Decomposition (partitioning) of the causal networks is possible with some restrictions.
In contrast, the large size problems are addressed efficiently using the DEVS formalism based on the state transition tables. Integration of some causal indicators into the DEVS platform 4 provides a new horizon in solving the large-size M&S problem, in particular, in healthcare. 19
At the local M&S level, such as the DSS design, there are various alternatives to Bayesian networks.
In summary, the Bayesian network that has been chosen in this paper as a DSS core, provides only one of many possible interpretations of uncertainty using point probabilities. There are many alternative approaches that operate with other probabilistic representations of uncertainty, 24 e.g., credal causal networks, 35 fuzzy causal networks, 37 Dempster–Shafer causal networks, 40 and subjective causal networks. 36 The choice of a specific causal model is heavily dependent on the data that is available for creating the CUTs. Other alternatives include, in particular, copula-based techniques 41 and Granger analysis for causal exploration of data. 42
Footnotes
Acknowledgements
The authors are grateful to Ivan Hu for helping to collect data on the COVID-19 outbreak case on the USS Theodore Roosevelt, and Eur Ing Phil Phillips, CEng (UK), for useful suggestions.
Funding
The author(s) disclosed receipt of the following financial support for the research, authorship, and/or publication of this article: This research was partially supported by the Natural Sciences and Engineering Research Council of Canada (NSERC) through grant “Biometric-enabled Identity Management and Risk Assessment for Smart Cities”, Department of National Defence’s Innovation for Defence Excellence and Security (IDEaS) program, Canada, and NATO linkage grant EAP.CLG 984 “Intelligent Assistance Systems”.