
Abstract
Mild traumatic brain injuries (mTBIs) continue to burden our warfighters. The high-tech industry has delivered wearable Micro-Electro-Mechanical System (MEMS) head-impact sensors to monitor impact forces. So far, these MEMS sensors have categorically failed to detect mTBIs and are therefore of no clinical utility for diagnosis. Our recent studies have shown that human head kinematics is anisotropic with respect to pitch–roll–yaw degrees of freedom of the head and neck. In the present project, we generated head acceleration datasets on non-injurious impacts and mTBI events based on mean values from the literature. We then augmented the simulated data with pitch–roll–yaw information followed by machine learning with a Classification and Regression Tree analysis. Our results revealed that head angular acceleration in pitch is the best predictor. More than 81.3 % of concussive injuries had head angular accelerations in pitch exceeding 3527 rad/s2. Out of 18.6% of concussive injuries with head angular accelerations in pitch under 3527 rad/s2, 75% of these cases had head angular accelerations in roll exceeding 1679 rad/s2. This study shows that artificial intelligence and machine learning should be able to provide accurate identification of subject-specific concussive thresholds in real time and in the field, thereby moving concussion diagnosis toward precision medicine.
1. Introduction
The Defense and Veterans Brain Injury Center reported 413,858 cases of military traumatic brain injuries between 2000 and 2019. An overwhelming 82.8% of the cases do not involve skull fracture or hospitalization and are classified as concussions or mild traumatic brain injuries (mTBIs). 1 Studies of UK military personnel deployed in Iraq and Afghanistan reported prevalence rates of 9.5% for those in combat roles, and 12-month incidence rates of 3.2% (4.2% for frontline personnel). However, prevalence rates reported in the same study on US personnel ranged from 15.2% to 22.8%. 2
At present, diagnosis of mTBIs remains challenging. The Executive Summary of a recent National Institutes Concussion Workshop stated that there are more than 30 clinical or consensus definitions of concussion, hampering diagnostics and comparison across different studies. 3 In many mTBI cases, the diagnosis remains tentative as there are few biomarkers or neuroimaging tests that have shown sensitivity and specificity to mTBIs.
To help provide objective and quantitative diagnostics for mTBIs, the high-tech industry has delivered MEMS (Micro-Electro-Mechanical System) sensors to monitor impact-induced head kinematics. 4 Diagnostics of mTBIs is of particular importance to the military, as return-to-duty or evacuate decisions must be made quickly and accurately in the battlefield. As one of the first adopters of this technology, the Department of Defense (DoD) provided ~50,000 MEMS sensors for fighters in the Army and the Marine Corps between 2007 and 2013, with an overall estimated cost exceeding US$100M. 5
In the meantime, many studies have shown that data from modern MEMS sensors predicted mTBIs with an accuracy barely over chance level.6,7 In 2017, scientists and industry experts reviewed systematically the effectiveness of head-impact measurement devices. 8 These authors categorically concluded that, “(such head-impact-measurement devices have) … low specificity in predicting concussive injury, did not have the requisite sensitivity to concussion … (therefore) have limited clinical utility due to error rates.” A second systematic review are also in agreement. 9
Many MEMS sensors use the proprietary HITS (Head Impact Telemetry System) algorithm along with the SAE J211 coordinate system (Society of Automotive Engineers, now SAE International) (Figure 1). 4 Although data on head angular accelerations (HAAs) was collected, the data does not further differentiate among pitch, roll, or yaw head rotations.4,6–8 The pronounced lack of clinical utility of modern MEMS sensors indicates that using the SAE J211 coordinate system to process data for mTBI detection may be insufficient. Indeed, the very idea of how head kinematic data ought to be utilized in concussion assessment may require a fresh and critical examination.
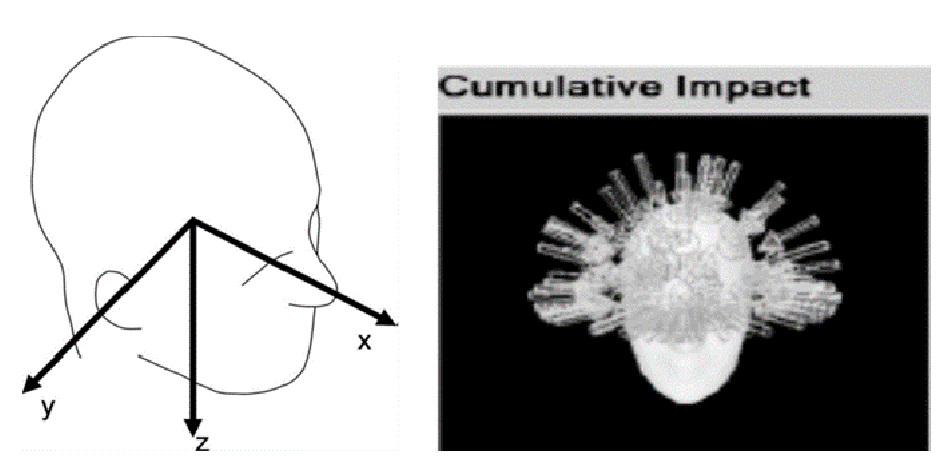
The three axes in the SAE J211 coordinates. Micro-Electro-Mechanical System sensors using the SAE J211 system generally yield linear accelerations, culminating in magnitude and directionality of impact forces (shown as arrows) but little or no information on head rotational kinematics. 4
In our view, MEMS technology ought to be ideally suited to detect mTBIs precisely because MEMS sensor data conveys kinematic information on impact-induced head movements, which depend upon both the biomechanical properties of the head and neck, such as neck strength and neck stiffness, and the nature of the external impact force, such as the magnitude and directionality of the external force. It is therefore ironic that MEMS technology categorically failed to predict mTBIs.
The human head and neck has three degrees of rotational freedom – pitch, roll, and yaw (Figure 2). 10 Nodding to gesture YES requires head rotation about the pitch axis. Shaking one’s head to gesture NO involves head rotations about the yaw axis. Bending the head toward one’s shoulder is a head rotation about the roll axis. These three degrees of rotational freedom have co-evolved with the underlying musculoskeletal elements of the head and neck and have been thoroughly integrated operationally both at the sensory level and the motor level within the central nervous system. A good example is the vestibule-ocular reflex, which links eye and head movement control with vestibular as well as visual cues. 10 These head movements allow us to constantly collect and analyze all types of information about the outside world from the visual, auditory, vestibular, and proprioceptive systems in order to plan and make movements. In monkeys and big apes, head movements about the pitch and yaw axes have increasingly become more functionally significant. For example, head rotations about the pitch axis are needed for tilting the head upward to look for predators or falling objects from above or downward to forage for food. Head rotations about the yaw axis are required for looking to the left or the right, such as in surveying the surroundings. By contrast, the roll head movements have remained less employed and more enigmatic.
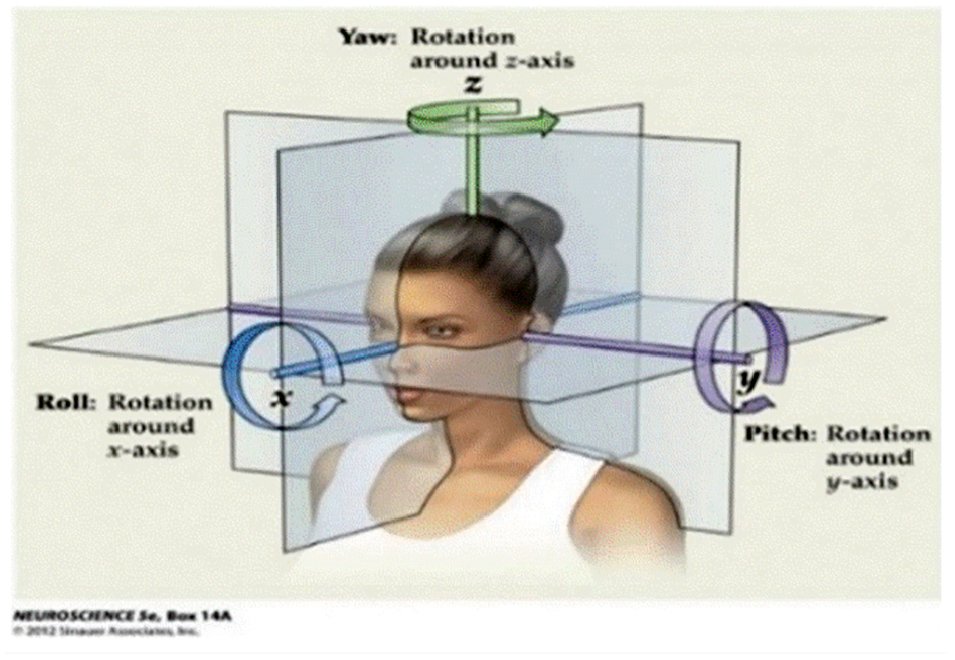
Pitch, roll, and yaw rotational degrees of freedom for the human head and neck. These are head rotations about the three axes in the SAE J211 coordinates. 10
Evolution of the head-and-neck mobility may have increased the overall fitness of our ancestors, who were neither powerful predators nor swift prey. Head mobility in pitch and yaw may have been particularly relevant to our bipedal origins. 11 This mobility pattern may have also introduced a differential vulnerability to mTBIs in pitch, roll, and yaw. Do impact-induced rotations of the human head and neck in pitch and yaw pose more or less risk for mTBIs than those in roll in boxing? 12
During a typical boxing match, a boxer must endure hundreds of head hits. In many boxing matches, there is one final head blow that prompts the referee to stop the fight. Experienced referees routinely make the call for knockouts or technical knockouts (KOs or TKOs) according to a set of clearly defined criteria. The losing fighter of a KO or TKO decision may or may not totally lose his consciousness. Concussions or mTBIs, however, are highly likely to occur in a KO or TKO. Confusion, loss of muscle tone, disturbances in the balance sense, etc., are built into the set of criteria for making such calls. The same set of signs is also firmly embedded in the initial clinical diagnosis of a concussion. 13 These considerations suggest that impact-induced head rotations in boxing matches can be a promising area to explore the relationship between rotational forces and mTBIs. We examined YouTube videos of boxing matches. 12 We focused on those KOs associated with head hits in pitch–roll–yaw. We measured head angles of the boxers frame-by-frame. In this way, we reduced videos of interest to data on head angles as a function of time. We calculated head angular velocities (HAVs) using the head angle data and the elapsed time between successive frames (30 frames per second (fps)). The methodology we used is an established approach to study head kinematics.14,15
We examined 20 KO hits with their control hits. HAVs in KO hits were consistently higher than those in NKO (no knockout) control head hits (Figure 3). The KO–NKO HAV was 1200 ± 202 versus 538 ± 81 o/s, 502 ± 59 versus 217 ± 36 o/s, and 744 ± 64 versus 569 ± 32 o/s, for pitch, roll, and yaw, respectively. The differences were significant (p = 7 × 10⁻³, 1.5 × 10⁻³, and 1.4 × 10⁻² for pitch, roll, and yaw, respectively). Therefore, prediction of KO based on HAVs was ≥98% accurate with pitch–roll–yaw information. Impact-induced HAV in KOs was the lowest in roll and became progressively higher in yaw and pitch (Figure 3, gray bars and black bars). Mean HAV in roll KO hits (502 ± 59 o/s) was no more statistically different than those in NKO hits in pitch or yaw (538 ± 81 o/s and 569 ± 32 o/s, respectively). Thus, accurate prediction of KOs or mTBIs cannot be made by merely tracking head kinematics without pitch–roll–yaw information. Figure 3 also suggests a path forward. The concussive threshold is likely to be anisotropic with respect to pitch–roll–yaw, with each of the thresholds being between the tops of the gray bars and the black bars. A systematic pattern must exist between the gray bars and black bars. Knowing that systematic pattern can facilitate the task of deducing concussive thresholds from data on non-injurious events.
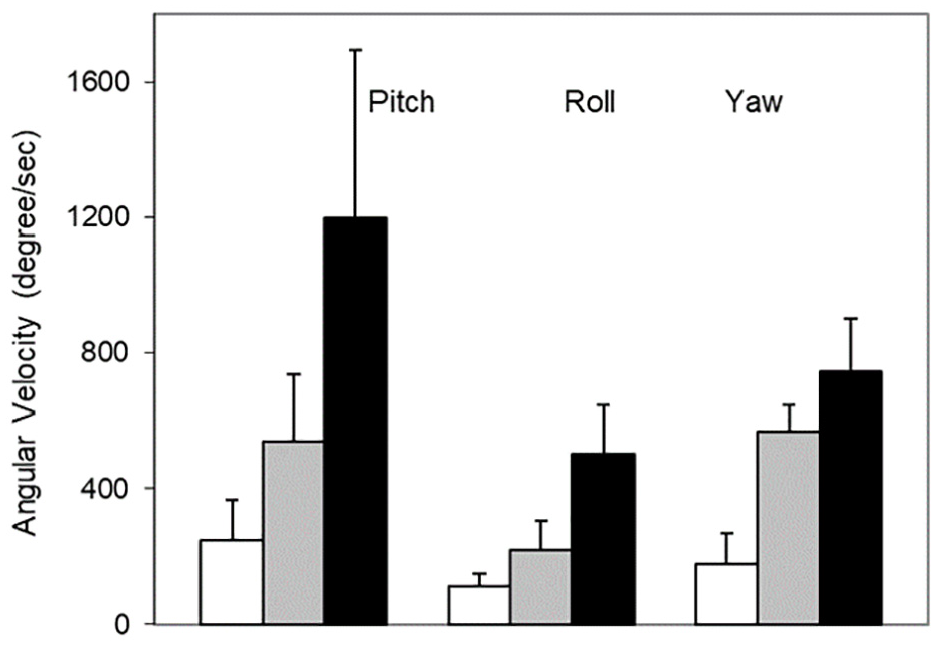
Head angular velocities. White bar: voluntary head movements; gray bar: boxer head hits; black bar: boxer knockout (KO) head hits. Error bars are standard error of the mean (SEM). KO head hits and control head hits are significantly different in pitch, roll, and yaw (p < 0.02). 12
Thus, our pitch–roll–yaw analysis algorithm differentiated the final KO head hit from other head hits. We could predict KOs, which are similar to mTBIs, with >98% accuracy. If this methodology can be incorporated into a part of the analysis algorithm of MEMS head-impact sensors, it may significantly improve the accuracy of these sensors to predict or diagnose mTBIs.
Implement pitch–roll–yaw analysis in MEMS sensor technology is feasible at present. However, it would be both time-consuming and costly to conduct a thorough study of the utility and efficacy of such sensor technology in a double-blind field study involving human subjects. In the present work, we generated simulated datasets on HAAs based on mean values of HAA from the published literature, including those in non-injurious and mTBI events, which are typically devoid of pitch–roll–yaw information. To introduce pitch–roll–yaw information, we use the data in Figure 3 as a guide. As long as the mean values of aggregated HAA are known, pitch–roll–yaw components can be assigned according to the ratio information on pitch–roll–yaw from Figure 3.
The goals of this special issue are to promote artificial intelligence (AI) for defense applications in order to gain competitive military advantages. The objectives of the present report appropriately concern the applications of AI in the management of traumatic brain injuries in our service members. Our objectives also address related training in so far as a significant fraction of military mTBIs occur outside of combat and in training. 1 In addition, we hope to bring our AI applications to the forefront of the education of our military personnel as we point out that applications of AI can occur in everyday settings and do not have to be restricted to the realm of highly sophisticated technology.
2. Methods
2.1 Overview
The impetus for the present simulation study is that mTBIs may be accurately predicted from HAA with information on its pitch–roll–yaw components. To carry out our simulation study, we started from available data from the literature, most of which convey mean and SD data on aggregated HAAs. We then introduce the pitch–roll–yaw information based on the findings on the anisotropy of the human head and neck in Figure 3. In this figure, the black bars indicate mean HAV observed in KO head hits in boxers. The gray bars indicate mean HAV in control head hits in boxers that did not lead to a KO. The clear bars indicate mean HAV in voluntary head movements, such as from news broadcasters on evening TV news. In each of the categories of head movements, HAV increases from roll to yaw to pitch (Figure 3, summarized in Table 1). When introducing the pitch–roll–yaw components of HAA in our simulated dataset, we used the ratio of pitch–roll–yaw components according to the information in Figure 3 and Table 1.
Ratio of magnitudes of head angular velocities in pitch-roll-yaw in three types of head movements.
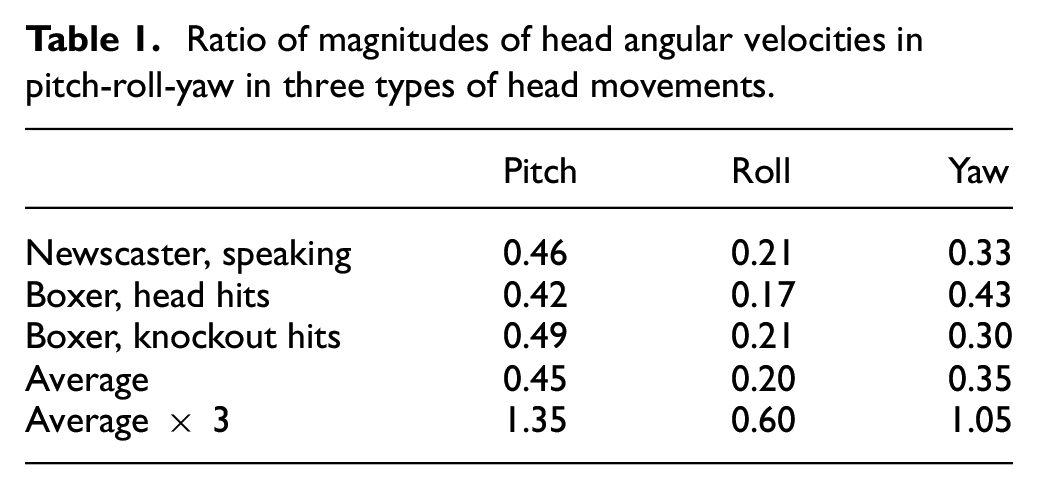
The data in Figure 3 shows that HAV becomes faster in pitch, yaw, and roll, in that order, whether the data comes from voluntary head movements or impact-induced head movements in boxers, including those in head hits leading to mTBIs or KOs. In Figure 3, the mean magnitude of the HAV increases from 1 (average of the three clear bars from speaking newscasters) to 2.5 (average of the three gray bars from head hits in boxers) to 4.6 (average of the three black bars from KO head hits in boxers). Table 1 summarizes quantitatively this anisotropy of the human head and neck derived from Figure 3. The ratio of HAV in pitch, roll, and yaw is tentatively determined as 1.35:0.60:1.05 (bottom row of Table 1).
We digress to discuss the distinction between HAV and HAA. While it is widely accepted that mTBIs are instigated by force or HAA rather than HAV, the ratio in Table 1 was derived from HAV. Indeed, we had derived such values on HAV from analysis of YouTube videos filmed at 30 fps. We could carry out one additional time derivative to obtain HAA. However, since the duration of a typical impact event in football is slightly under 20 ms, 4 this constraint made it impractical to derive HAA data from our video analysis on boxers. Therefore, we computed an aggregated average of HAV and used the ratio as a guide to the anisotropy in HAA in our simulated study.
At present, experimental data of mTBIs is still scarce. We, and several other researchers, have a limited amount of data that is insufficient for the type of analysis that we have provided in this study. Typically, some investigators may have worked with a football team. So, the database is relatively small. Also, different investigators may have worked with their own collection of human subjects. Combining data in different studies, however, introduces additional problems as the databases are often incompatible. Moreover, simulating mTBI data is a common practice for many researchers.16,17 For these reasons, we decided to create simulated database according to a set of rules derived from a small but real set of data. An advantage of simulation is that we can generate large amounts of data.
2.2 Data generation
Conceptually, a given head movement can be represented by a single point in a three-dimensional space with the three coordinates being HAAs in pitch, roll, and yaw. We will call it the PRY space. We generated three types of head movement datasets – on voluntary head movements, non-injurious, impact-induced head movements, and head movements associated with clinically diagnosed mTBI events. The first step of generating the datasets for each of three types of head movements is to obtain the mean values of HAAs in each type of head movement from the literature. We next used a random-number generator to obtain individual data points in that dataset while always assuming a Poisson distribution pattern. 4 More specific detail is as follows.
We populated the PRY space with simulated date points for non-injurious, impact-induced head movements (data from Rowson et al. 4 ). The population of simulated data points assumes a Poisson distribution. 4 The overall mean is 1355 rad/s2 (median at 1017 rad/s2), while the range is 107–9922 rad/s2. To get the mean and range for pitch, roll, and yaw, we multiply the overall values by 1.35, 0.60, and 1.05, respectively (based on Table 1).
We then populated the PRY space with simulated date points for non-injurious, voluntary head movements. Again, the population of simulated data points assumes a Poisson distribution. The mean and SD of the simulated data points (with PRY information) are estimated from Figure 3 and a recent reference. 18 The mean is 551 rad/s2. The range is 44–4033 rad/s2.
We next populated the PRY space with simulated date points for impact-induced head movements known to be associated with clinically diagnosed mTBI events. 8 The population of simulated data points will ideally represent a surface or boundary in the PRY space. Here the mean can be seen as the “thickness” of the boundary or threshold surface and not really have the same meaning as mean and SD in the other two categories of head movements. The mean is 5776–6000 rad/s2.
2.3 Machine learning
Various statistical models and machine learning methods can be used for risk prediction and management. Several studies indicate that decision tree models have one of the best classification performances in terms of accuracy, sensitivity, and specificity.6,19 Decision tree learning is a non-parametric supervised learning method for classification and regression tasks.2,20 In particular, a decision tree is a predictive model that maps observations about an item to conclusions about the item's target value. In the present work, we used a Classification and Regression Tree (CART) for constructing a predictive model of concussive injury. The CART model of mTBIs was built by splitting the dataset into several subsets based on the pitch, roll, and yaw values belonging to specific subintervals. There are several splitting rules (e.g., Reduction in Variance, Information Gain, Gini Impurity, and Chi-Square) for defining the subinterval. For the CART model, we used a generalization of the binomial variance known as the Gini Impurity or the Gini index to determine the optimal subintervals for each of pitch, roll, and yaw variable. The Gini index is a measure of how many times a randomly chosen member of a set can be incorrectly labeled as injury (or no injury). The goodness of fit was tested to optimize the capacity of each candidate split of the mTBI data based on the subintervals.
The process of splitting was recursively applied to each derived subset (i.e., applied to each "child" node) until there was no gain in prediction of injury (or no injury) outcomes and the tree was complete. In particular, the CART model was obtained by recursively partitioning the mTBI data and fitting a prediction model within each partition. As a result, the partitioning can be represented graphically as a decision tree (see later in Figure 6). In addition, we applied a 10-fold cross-validation to determine how accurately the CART predictive model performs in practice.
3. Results
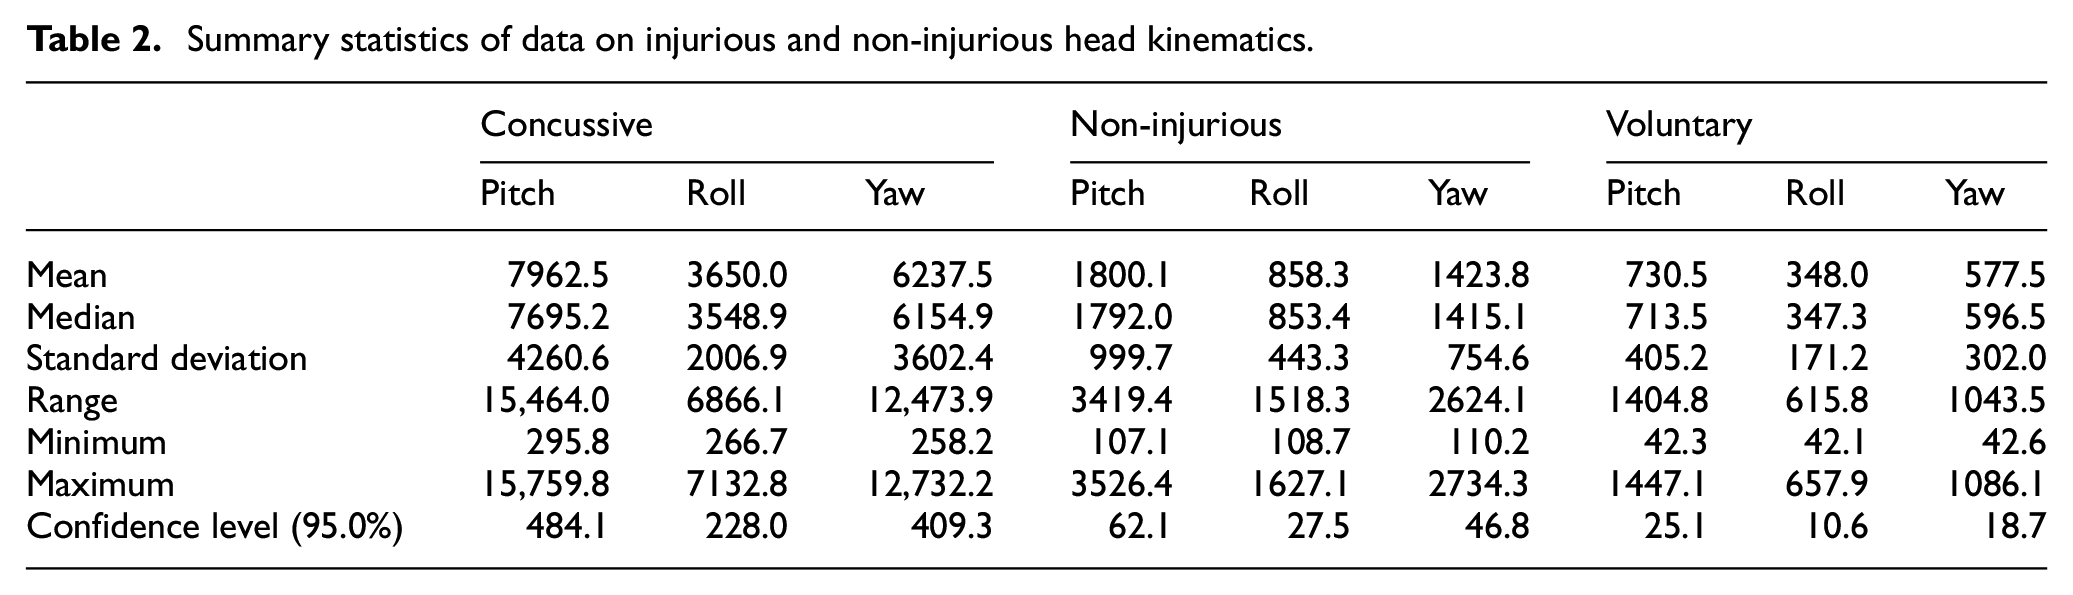
Figure 4 shows three categories of simulated HAA data: (1) data on HAA from instrumented athletes, such as football or hockey players, conveying non-injurious, impact-induced HAA with PRY information (in blue); (2) data on the same type of HAA as in (1) but from head-impact events associated with cased of clinically diagnosed mTBI (in red); and (3) HAA data on voluntary head movements from instrumented volunteers (in tan). Figure 4 is a three-dimensional plot of HAA data with x = pitch, y = roll, and z = yaw values. The subsets of concussive (300 observations), non-injurious (1000 observations), and voluntary head movement data (1000 observations) are denoted with different colored markers. While the relative segregation among red, blue, and tan symbols in Figure 4 shows qualitatively that there is little or no overlap between non-injurious head kinematics and mTBI events, Figure 5 provides this information quantitatively in boxplots. A descriptive statistical summary of the data is provided in Table 2. The segregation or separation of symbols in different colors in both Figures 4 and 5 suggests that identification and diagnosis of mTBI events based on head kinematics is feasible with PRY information.
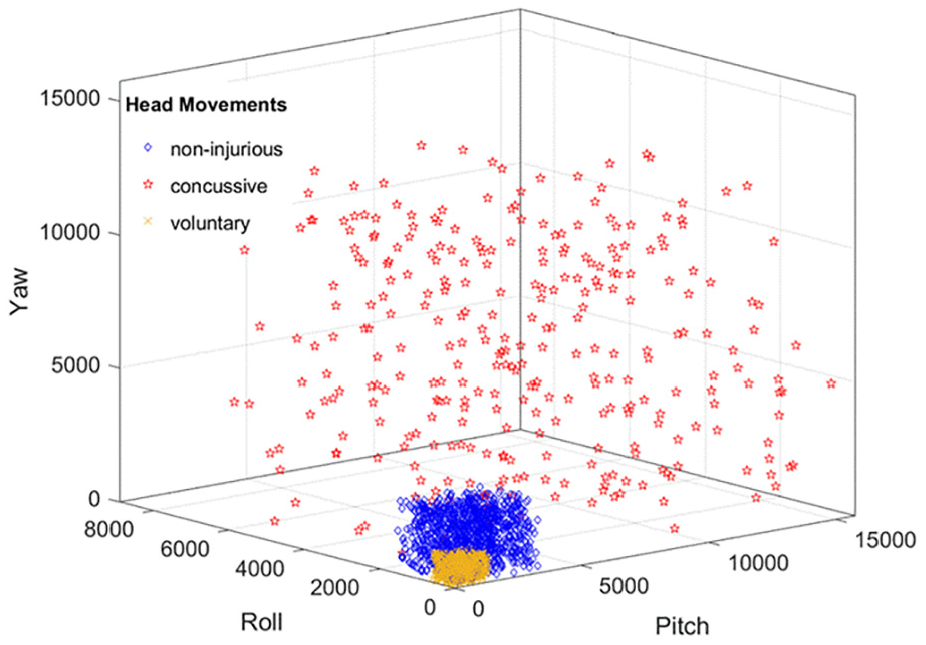
Head kinematics in pitch–roll–yaw (PRY) space. The data points illustrate a populational head movement profile. (Color online only.)
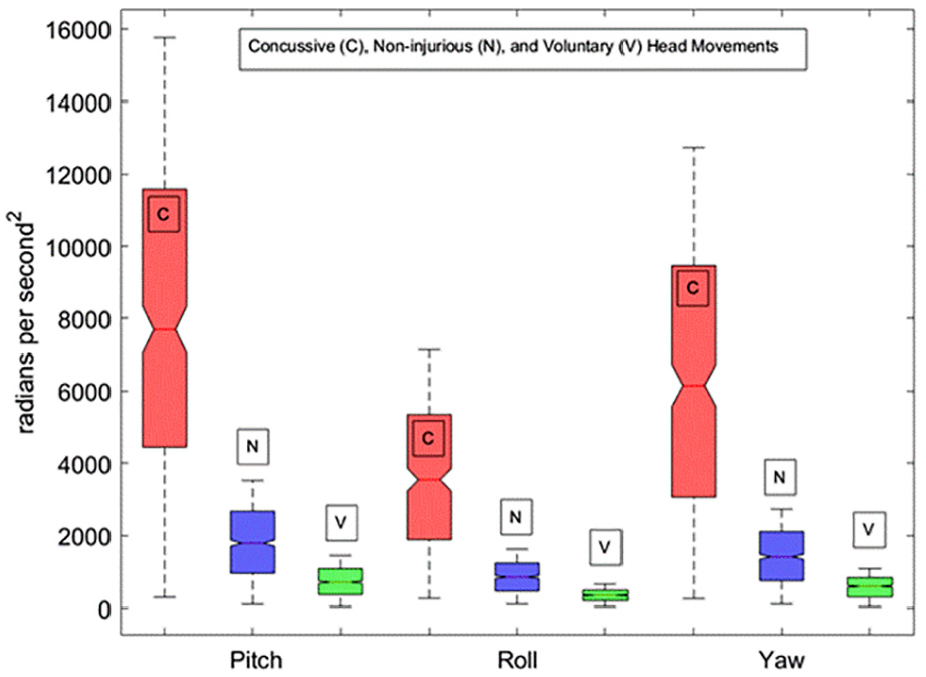
Boxplots of pitch, roll, and yaw in the order of concussive (C), non-injurious (N), and voluntary (V) data from left to right. On each box, the central mark indicates the median, and the bottom and top edges of the box indicate the 25th and 75th percentiles, respectively.
Summary statistics of data on injurious and non-injurious head kinematics.
To further probe the utility of the information on the directionality of head impacts in PRY, we used IBM SPSS software to construct a decision tree model in order to further validate the information in Figures 4 and 5. The independent variables were pitch, roll, and yaw, whereas the dependent variable was concussive injury coded as zero (no concussion) or one (concussion). We set the parent and child nodes to 10 and 5, respectively. We also applied a 10-fold cross-validation approach. We did not apply a penalty for misclassifications because the model was already highly accurate. As shown in Figure 6, node 1 represents the highest level of dependency, capturing more than 89% of all cases. Pitch is the most important predictor. More than 81.3 % of concussive injuries (244 out of 300) had HAA in pitch exceeding 3527 rad/s2. All non-injuries or voluntary head movements had HAA in pitch under 3527 rad/s2 (see node 1). The second important factor is roll. Out of 18.6% (56 out of 300) concussive injuries with HAA in pitch under 3527 rad/s2, 75% of these cases (42 out of 56) involved HAA in roll exceeding 1679 rad/s2 (see node 4).
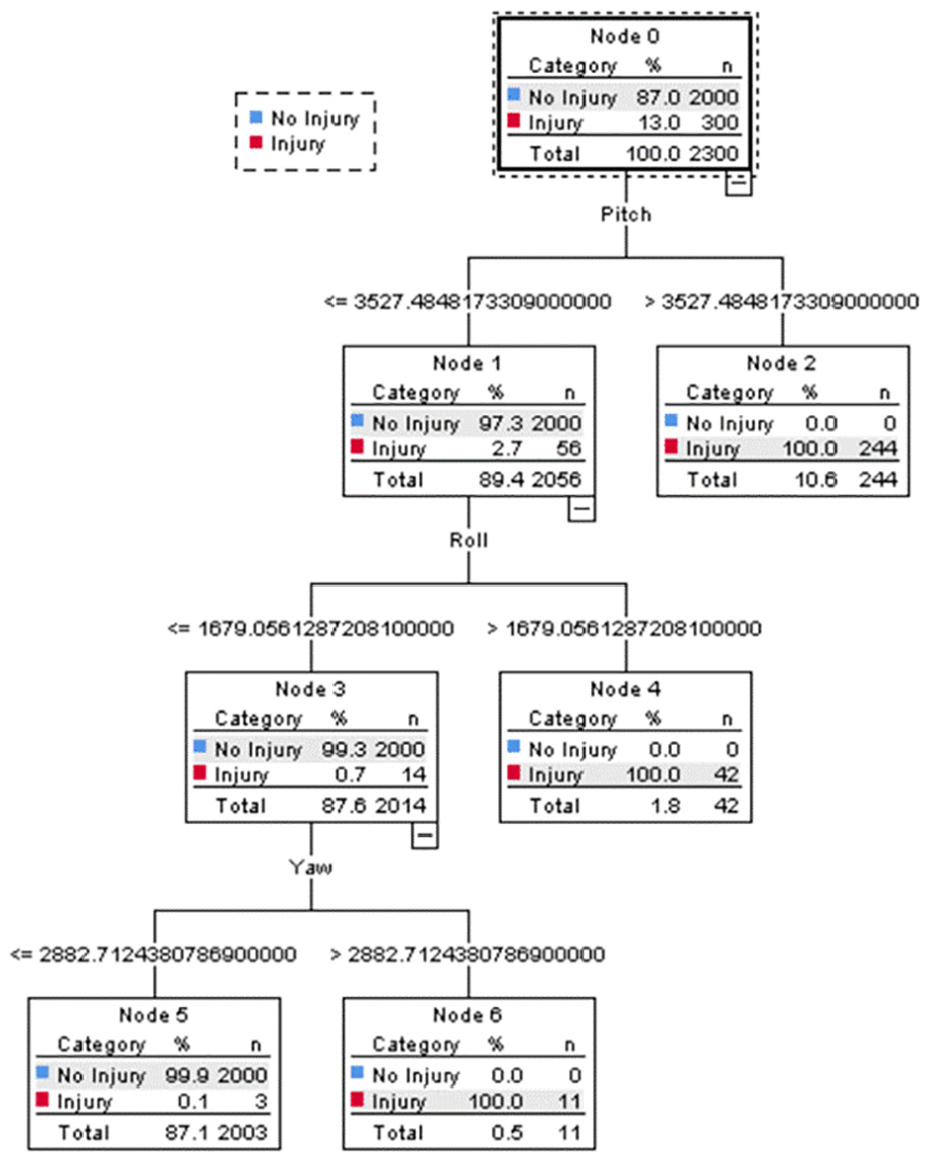
Tree diagram resulted from the Classification and Regression Tree (CART). Pitch is the most important predictor. More than 81.3 % of concussive injuries (244 out of 300) had a pitch value greater than 3527 rad/s2 (see node 2). Also, all non-injuries or voluntary head movements had pitch values less than 3527 rad/s2 (see node 1). The second important factor is roll. Out of 18.6% (56 out of 300) concussive injuries with a pitch value less than 3527 rad/s2, in 75% of cases (42 out of 56) the roll value was greater than 1679 rad/s2 (see node 4).
Table 3 shows type I and type II misclassification errors. The CART model has an overall predictive accuracy of 99.9%. While this is promising, it should be noted that the results of the model are based on simulated data. In the future, we plan to test the model with data obtained from human subjects. The other important point for future research and development (R&D) is to include more predictors and more variables, both of which can be readily accommodated with the present approach with a potential to further improve the accuracy of mTBI diagnosis. This point is further elaborated in Section 4.
Missclassification errors.
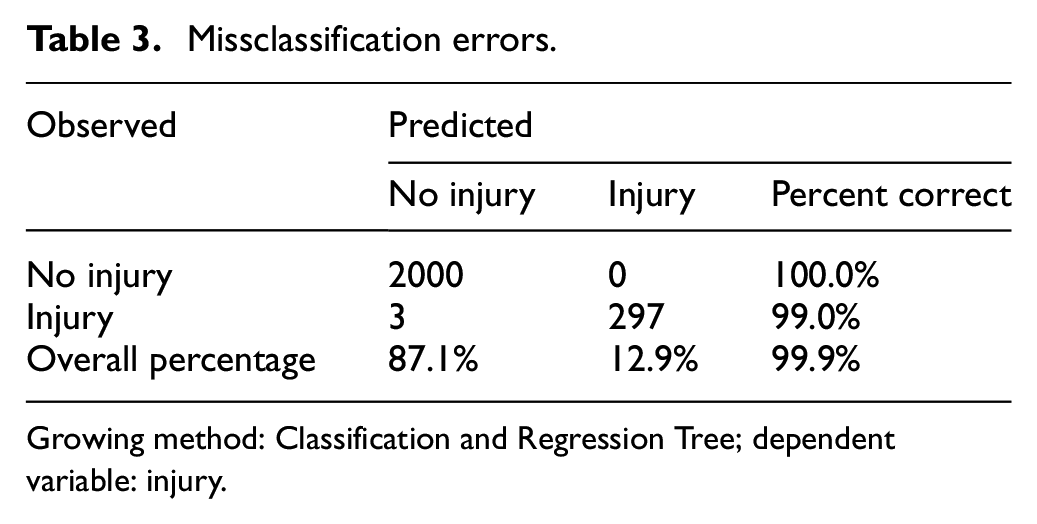
Growing method: Classification and Regression Tree; dependent variable: injury.
4. Discussion
4.1 Is the simulated dataset in the present study realistic?
The simulated dataset is represented in Figure 4 in its entirety. The dataset is consistent with the available literature data. Firstly, we adopted the mean values of non-injurious, impact-induced HAA from Rowson et al. 4 The simulated population dataset was generated with a Poisson frequency distribution (instead of a Gaussian distribution), also according to Rowson et al. 4 The same approach was taken in the generation of the dataset on HAA associated with clinically diagnosed mTBI cases. We adopted the mean values of HAA in clinically diagnosed mTBI cases from O’Connor et al. 8 Secondly, we used the numbers in Table 1 to introduce PRY information into the simulated datasets that are otherwise without PRY information. The ratio in Table 1 is derived from our studies on boxers 12 but is in good agreement with the data in the Figure 3 of Hernandez and Camarillo, 18 who also found that mean values of non-injurious, impact-induced HAV in pitch is higher than HAV in both roll and yaw by a ratio of 4:3. If we compare the mean values of HAV from pitch with roll and yaw lumping together, the data from Table 1 would generate a ratio of 1.35:(1.05 + 0.6)/2 or 4:2.44. Thirdly, we have also examined fist velocities in our study with the boxers. 12 We found no correlation between the fist velocities in KO hits versus control NKO hits. Neither was there any statistically significant differences in fist velocities among pitch hits, roll hits, or yaw hits. These findings suggest that the anisotropy observed in Figure 3 and summarized in Table 1 is largely due to the anisotropy of the head and neck, possibly regardless of the specific sports in question. Taken together, we are confident that the dataset in Figure 4 is realistic. The next challenge is to systematically collect HAA data from human subjects and represent such data in the PRY space in order to confirm this conclusion.
4.2 What are the critical factors for accurate mTBI prediction from MEMS data?
The output of MEMS sensors is HAA or HAV. The data in Figure 3 shows that mean HAV in roll KO hits (502 ± 59 o/s) was not more statistically different than those in NKO hits in pitch or yaw (538 ± 81 o/s and 569 ± 32 o/s, respectively). This observation alone will raise red flags if HAV or HAA data was used to identify or predict mTBIs without pitch–roll–yaw information. In essence, the operational advantage of Figure 4 is to introduce the PRY dimension by expressing head movement events in a multi-dimensional space rather than a one-dimensional axis. The topology of the concussive threshold expressed as a boundary in the PRY space is not just some shapeless or amorphous entity. In Figure 4, such mTBI anisotropy is readily apparent by noting that the scales of the HAA in PRY axes are quite different. When this boundary is projected into a single dimension marked by the aggregated HAA, information on PRY is lost. The result is the inability to differentiate mTBI events from benign head impacts. Using a similar CART approach, it was concluded that aggregated HAA predicted mTBI with an accuracy barely above chance level (55.6%). 6 In truth, we expect that a proper representation of human head kinematics is likely to involve many more dimensions than three, as the PRY space described in Figure 4. As we better understand mTBIs, we should introduce more dimensions, leading to further improvement in mTBI diagnosis. However, the basic approach presented in this simulation study holds the promise of next-generation data collection and analysis over and beyond the capabilities of the current MEMS sensor technology.4,5,8
4.3 What does the future of technology hold for mTBI diagnostics?
The data in Figure 4 is population data. If the format of Figure 4 is adopted to describe data from a single individual, the derivation of the concussive threshold will be more accurate, since such an approach takes into consideration of age, gender, and additional specific factors, albeit implicitly. That this claim has merit is consistent with the declaration that the mTBI threshold is individualized. A nine-year-old girl soccer player and an NFL linebacker have very different mTBI thresholds. Taking into consideration more factors specific to the person in question in order to improve clinical outcome is the overriding principle of precision or personalized medicine. Concomitantly, the power of CART analysis comes from its capacity to take into consideration of a large number of variables. Indeed, the more variables, the better the analytical outcome.
In the future, as we expand our knowledge on mTBIs by systematically collecting data from human subjects and represent the data in the PRY space (e.g., Figure 4), we can study the pattern of those data from benign head kinematics side by side with those from clinically diagnosed mTBI cases. It will be feasible to train our algorithms in order to derive a relationship between the non-injurious had kinematics and mTBI kinematics. When such a smart sensor is worn by an individual, the algorithm can collect data from the individual on non-injurious head kinematics and then machine-learn to derive a zone that the mTBI kinematics should occupy without having the individual ever encountering a mTBI event. Subsequently, such a smart sensor measures and compares impact-induced head kinematics against the personalized boundary or threshold in real time and hopefully greatly improves mTBI diagnosis via MEMS technology.
Finally, recent studies suggest that mTBIs may also be dependent upon the factor of time. For example, the mTBI threshold may vary depending upon the history of concussions and non-injurious head impacts the individual had in the last week, etc. 21 If confirmed, one attractive avenue of technological development is predictive analytics, since the extra channel of information concerns historical data, readily available for the data analysis algorithm. Again, the basic approach in this simulation study offers a glimpse of next-generation data collection and analysis over the capabilities of current MEMS sensor technology.4,5,8
4.4 Military relevance
mTBIs continue to burden our warfighters. The difficulty of evacuating injured soldiers out of many deployed areas requires coordination, resources, and personnel. Limited resources in the deployed environment and the limited capability to forward deploy systems for imaging studies such as computerized tomography (CT) or magnetic resonance imaging (MRI) along with the operational tempo in combat require additional considerations. As future conflicts arise in multi-domain environments, the first 1–3 days of far-forward post-mTBI care will be essential for warfighters’ brain health and improved return-to-duty decisions. At present, fundamental problems in the far-forward deployed environment include under- or over-reporting, missed diagnoses, extended evacuation concerns, and a limited amount of neurosurgical support. These problems exist because acute traumatic brain injury (TBI) diagnosis and post-mTBI monitoring of patient conditions in austere environments are both problematic due to a lack of accurate, fast, and portable devices. There is a need for a simple-to-use, portable tool for objective diagnostics of acute mTBIs in real time that can accurately guide the on-site provider or trained service member to conduct an immediate evaluation and allow the on-the-ground commander the correct information needed to evacuate or hold service members suspected of mTBIs.
MEMS technology has the potential for quick and reliable identification of mTBI events as well as monitoring of abnormal head kinematics after mTBIs. For example, these tasks can be accomplished in real time and in the field with a data transmittal pathway directly from a wearable sensor on a soldier to a hand-held device of the medic, such as the existing MC4 system. 22 In addition, such a device or system can also help to monitor conditions of soldiers immediately following potential mTBI events (first 72 hours). Information generated by such a device or system will play a key role to help critical decision-making, which can not only contribute to a better outcome for service members suspected of mTBIs but also optimize the combat readiness of the unit as a whole.
Footnotes
Acknowledgements
The authors express their gratitude for the Acute Effects of Neurotrauma Consortium in assisting and coordinating the conduct of this project. The views and conclusions contained in this document are those of the authors and should not be interpreted as representing the official policies, either expressed or implied, of the Leonard Wood Institute, the Army Research Laboratory or the US Government. The US Government is authorized to reproduce and distribute reprints for Government purposes notwithstanding any copyright notation heron.
Declaration of conflicting interests
The authors have no conflicts of interest to declare.
Funding
The authors disclosed receipt of the following financial support for the research, authorship, and/or publication of this article: This work was supported by the Leonard Wood Institute in cooperation with the US Army Research Laboratory and was accomplished under Cooperative Agreement Number W911NF-14-2-0034. This study was also supported by the Helen S. Boylan Foundation and a grant from the UMKC Institute for Data Education, Analytics and Science.