
Abstract
Objective
The aim of the paper was to investigate the composition and structure of intestinal flora in patients with cerebral ischemic stroke (CIS), and to investigate the relationship between gut microbiota (GM) and different levels of stroke severity.
Methods
In this study, 47 CIS patients (16 mild, 21 moderate, and 10 severe) and 15 healthy controls were included. General information, clinical data, and behavioral scores of the enrolled subjects were collected. Deoxyribonucleic acid in fecal intestinal flora was extracted and detected using high-throughput Illumina 16S ribosomal ribonucleic acid sequencing technology. Finally, the correlation between the community composition of intestinal microbiota and National Institutes of Health Stroke Scale (NIHSS) score in CIS patients was analyzed.
Results
Compared with healthy controls, there was no statistically significant difference in Alpha diversity among CIS patients, but the principal coordinate analysis showed significant differences in the composition of the GM among stroke patients with different degrees of severity and controls. In CIS patients, Streptococcus was significantly enriched, and Eshibacter—Shigella, Bacteroides, and Agathobacter were significantly down-regulated (P < .05). In addition, the relative abundance of Blautia was negatively correlated with the NIHSS score.
Conclusions
Our results show that different degrees of CIS severity exert distinct effects on the intestinal microbiome. This study reveals the intestinal microecological changes after brain injury from the perspective of brain–gut axis. Intestinal microorganisms not only reveal the possible pathological process and indicate the severity of neurologic impairment, but also make targeted therapy possible for CIS patients.
Introduction
The microbiome refers to the collection of genomes of microorganisms that form ecological communities inside and on the surface of the human body. The gut microbiota (GM) comprises trillions of microorganisms, with at least 1000 known species of bacteria, outnumbering both body cells and embryonic cells. 1 The GM forms a complex and symbiotic relationship with the host’s intestinal tract, and constitutes a unique ecosystem performing multiple biological functions. Previous research over the years has provided substantial evidence demonstrating that GM play indispensable roles in a multitude of human physiological processes, such as intestinal homeostasis, nutrient metabolism, vitamin K synthesis, organ development, intestinal barrier development, and immune response processes. 2
Cerebral ischemia stroke (CIS) represents a significant global health concern and is indeed one of the leading causes of morbidity and mortality worldwide. The global IS-related deaths increased from 2.04 million to 3.29 million between 1990 and 2019, and is expected to 4.90 million by 2030. 3 CIS is a type of stroke that occurs due to an interrupted blood supply to the brain, leading to neurological deficits, emotional and psychological changes, physical disabilities, and other post-stroke complications. The National Institutes of Health Stroke Scale (NIHSS) is a widely used tool to quantify the severity of neurological deficits, a serving as a potential predictor of outcomes after stroke. 4 Greater severity in neurological impairment is correlated with elevated disability and recurrence rates, thereby contributing to a less favorable prognosis for stroke patients. The direct cause is irreversible neurological dysfunction after brain tissue damage, and the indirect cause is that severe stroke may lead to long-term secondary damage, such as systemic inflammatory responses, further affecting the prognosis. 5
In recent years, the role of the GM in brain function and various brain disorders has gained widespread attention. 6 Brain damage, especially CIS, has implications beyond immediate neurological effects, potentially exerting influence on the gastrointestinal tract. The pathogenesis of neurological and gastrointestinal disorders is multifactorial, with the GM emerging as a crucial regulatory factor in bidirectional interaction between the gut and the brain. 7 The “gut–brain axis” is a complex neuroendocrine network composed of the central nervous system, enteric nervous system, and autonomic nervous system, which is involved in maintaining communication between the brain and the gut and information exchange among various systems. The GM and its metabolites have been shown to participate in the regulation of gastrointestinal function because they can influence intestinal permeability, mucosal immune function, intestinal motility and sensitivity, and the activity of the enteric nervous system. 8 Through the release of signaling molecules such as short-chain fatty acids (SCFAs), 9 the GM may communicate with the host’s nervous system, and the state of the brain in different conditions can also alter the composition and behavior of microbes through the autonomic nervous system. 10
Alterations in the GM have been dynamically associated with post-stroke states through via the microbiota–gut–brain axis, a communication pathway that interconnects the GM, the gastrointestinal tract, and the brain. 11 While stroke can precipitate gastrointestinal dysfunction, including increased gastrointestinal permeability and GM dysbiosis, the regulation of GM may have a positive impact on the progression and outcome of ischemic stroke. 12 Furthermore, the changes in GM and their consequential effects exhibit variability corresponding to the severity of stroke. 13 A preclinical study found that ischemic brain injury led to alterations in the composition of the GM, accompanied by a decrease in its diversity. 14 Notably, specific changes within the families Enterococcaceae and Prevotellaceae were observed to correlate with the severity of CIS injury, providing strong evidence supporting the involvement of the “gut–brain axis” in stroke pathology. Therefore, by exploring changes in the GM among stroke patients with varying degrees of severity, we can not only elucidate the pathophysiological processes underlying secondary damage after brain injury but also prognosticate the outcome of ischemic stroke from the perspective of the “gut–brain axis.” 15
This study focuses on the performance of the GM in stroke patients with varying degrees of neurological impairment. It aims to explore disparities in composition and structure of the GM among individuals with CIS of differing severity, and analyze the correlation between characteristic bacterial species and neurological function assessed by NIHSS scores, with the overarching goal of predicting the relationship between GM and the prognosis of CIS.
Methods
Participants
Patients meeting the diagnostic criteria for acute and subacute ischemic stroke from January 1, 2019, to March 31, 2021, admitted to the Department of Rehabilitation Medicine, the First Affiliated Hospital of Zhejiang University School of Medicine, were selected as the subjects of this study. This study primarily focused on patients with acute and subacute ischemic stroke with varying degrees of neurological impairment. We gathered data on age, gender, duration of hospitalization from stroke onset to stool collection, medical history including hypertension, diabetes, heart disease, pulmonary infections, and hypokalemia, laboratory test results, as well as assessments of activities of daily living (ADL) and NIHSS scores. Based on the NIHSS score at the time of admission, ischemic stroke patients were categorized into the following groups: mild stroke group (≤4 points) with 16 cases, moderate stroke group (5-15 points) with 21 cases, and severe stroke group (≥16 points) with 10 cases. Additionally, 15 healthy individuals without a history of stroke, myocardial infarction, acute illnesses, or major medical conditions were selected as the control group.
Inclusion and Exclusion Criteria
According to the “Chinese Guidelines for the Diagnosis and Treatment of Acute Ischemic Stroke 2018,” the diagnostic criteria for ischemic stroke include:
acute onset of symptoms;
focal neurological deficits, such as weakness, numbness, or speech disturbances in 1 side of the face or limbs, with rare cases of global neurological deficits;
imaging evidence of a responsible lesion or symptoms/signs lasting for more than 24 hours;
exclusion of non-vascular causes; and
brain computerized tomography/magnetic resonance imaging ruling out intracerebral hemorrhage.
The exclusion criteria for the study include:
patients with a history of other neurological diseases, malignant tumors, systemic organ failure, or primary gastrointestinal diseases, including a history of chronic constipation;
patients with ischemic stroke whose onset occurred more than 3 months prior to enrollment or patients who died during the study period; and
patients who refused to sign the informed consent form.
GM DNA Extraction
Morning fasting stool samples were collected from the participants and placed in 50 mL sterile collection tubes. The samples were transported to the laboratory in an icebox for further processing. Each sample of feces weighing 200 mg was then transferred into a 1.5 mL sterile centrifuge tube and stored at −80°C in an ultra-low-temperature freezer.
Once the experiments began, the fecal samples were retrieved, and total deoxyribonucleic acid (DNA) of the GM was extracted following the instructions of the Stool DNA extraction kit (E.Z.N.A.® Stool DNA Kit). The integrity of DNA samples was assessed using 1% agarose gel electrophoresis, and DNA sample concentration and purity were determined using a NanoDrop ND-1000 spectrophotometer. After concentration measurement and agarose gel electrophoresis assessment, DNA samples were stored at −80°C for subsequent experiments.
PCR Amplification and 16S rDNA Sequencing
Polymerized chain reaction (PCR) amplification was performed on the V3 to V4 variable region of the bacterial 16S ribosomal ribonucleic acid gene using the primers 341F (5′-CCTACGGGNGGCWGCAG-3′) and 805R (5′-GACTACHVGGGTATCTAATCC-3′). The PCR reaction system consisted of Phusion Hot start flex 2X Master Mix (12.5 μL), Forward Primer (2.5 μL), Reverse Primer (2.5 μL), sample DNA (50 ng), and ddH2O up to 25 μL. The PCR amplification conditions were as follows: initial denaturation at 98°C for 30 seconds, followed by 32 cycles of denaturation at 98°C for 10 seconds, annealing at 54°C for 30 seconds, extension at 72°C for 45 seconds, and a final extension step at 72°C for 10 minutes.
PCR products were purified using 2% agarose gel electrophoresis and AMPure XT beads (Beckman Coulter Genomics, Danvers, MA, USA), and DNA quantification was performed using Qubit (Invitrogen, USA). Sequencing was conducted on the Illumina NovaSeq PE250 platform, and library quantification was performed using the Agilent 2100 Bioanalyzer and Illumina library quantification kit.
Bioinformatics Analysis
The raw sequencing data were preprocessed, including filtering, dereplication, and chimera removal, to obtain amplicon sequence variants (ASVs) feature table and feature sequences. ASVs are classified based on the similarity of DNA sequences and are set as species representatives for a given taxonomic unit (phylum, class, order, family, genus, and species). The relative abundance of ASVs was calculated to compare differences between different features. The top 30 most abundant taxonomic units were selected for constructing stacked bar charts.
The relative abundances of features were normalized based on the relative abundances of each sample, visually represent the number of ASVs in different stroke severity groups and the control group using a Venn diagram. Alpha diversity reflects the diversity of ASVs within a sample, mainly assessed using indices such as Chao1, Observed species, Goods_coverage, Shannon, Simpson, and Pielou-e to reflect richness and evenness. Beta diversity reflects the diversity of ASVs among multiple samples. In this study, principal coordinate analysis (PCoA) was used for beta diversity analysis. Four indices, unweighted unifrac, weighted unifrac, jaccard, and bray_curtis, were calculated using QIIME2 software to measure dissimilarity between the 4 samples. Smaller values indicate less difference in species diversity among samples. 16 Alpha and beta diversity together constitute the biological heterogeneity of the GM community. Linear discriminant analysis effect size (LEfSe) analysis was also used for beta diversity analysis to identify species with significant differences in abundance between different groups.
Functional prediction of GM was performed using Phylogenetic Investigation of Communities by Reconstruction of Unobserved States (PICRUSt) software. 17 Based on PICRUSt’s functional predictions, a mapping was created between the microbiota and functions using the Kyoto Encyclopedia of Genes and Genomes (KEGG) database.
Statistical Analysis
Data collected were analyzed using SPSS 22.0 (Chicago, IL, USA). For continuous variables following a normal distribution, 1-way analysis of variance or independent sample t-tests were used for analysis. For categorical variables, a chi-square test was used. Kruskal–Wallis rank-sum test was used to detect differences in GM species abundance between different groups, obtaining significantly different species. LEfSe analysis, combined with linear discriminant analysis (LDA greater or less than 3), was used to obtain different microbial groups. Pearson correlation analysis was used to analyze the correlation between the relative abundance of selected differential GM species and patients’ NIHSS scores. A significance level of P < .05 was set for statistical significance.
Results
Clinical Characteristics of the Patients
This study primarily focused on patients with acute and subacute cerebral ischemic stroke (CIS) with varying degrees of neurological impairment. Based on the NIHSS score at the time of admission, the CIS patients were categorized into the following groups: mild stroke group (≤4 points) with 16 cases, moderate stroke group (5-15 points) with 21 cases, and severe stroke group (≥16 points) with 10 cases. Additionally, 15 healthy individuals undergoing medical examinations at our hospital during the same period were selected as the control group.
The 4 groups of participants showed no statistically significant differences in age or gender (P > .05). Furthermore, there were no statistically significant differences in hospitalization duration, hypertension, diabetes, heart disease, pulmonary infections, hypokalemia, white blood cell count, hemoglobin levels, C-reactive protein, alanine transaminase, aspartate transaminase, brain natriuretic peptide, or other laboratory test results among the CIS patients with different degrees of neurological impairment (P > .05), as shown in Table 1. However, there were significant differences in ADL scores and NIHSS scores among the CIS patient groups with different degrees of severity (P < .001).
Comparison of Demographic Data Among CIS Patients With Different Levels of Neurological Impairment.
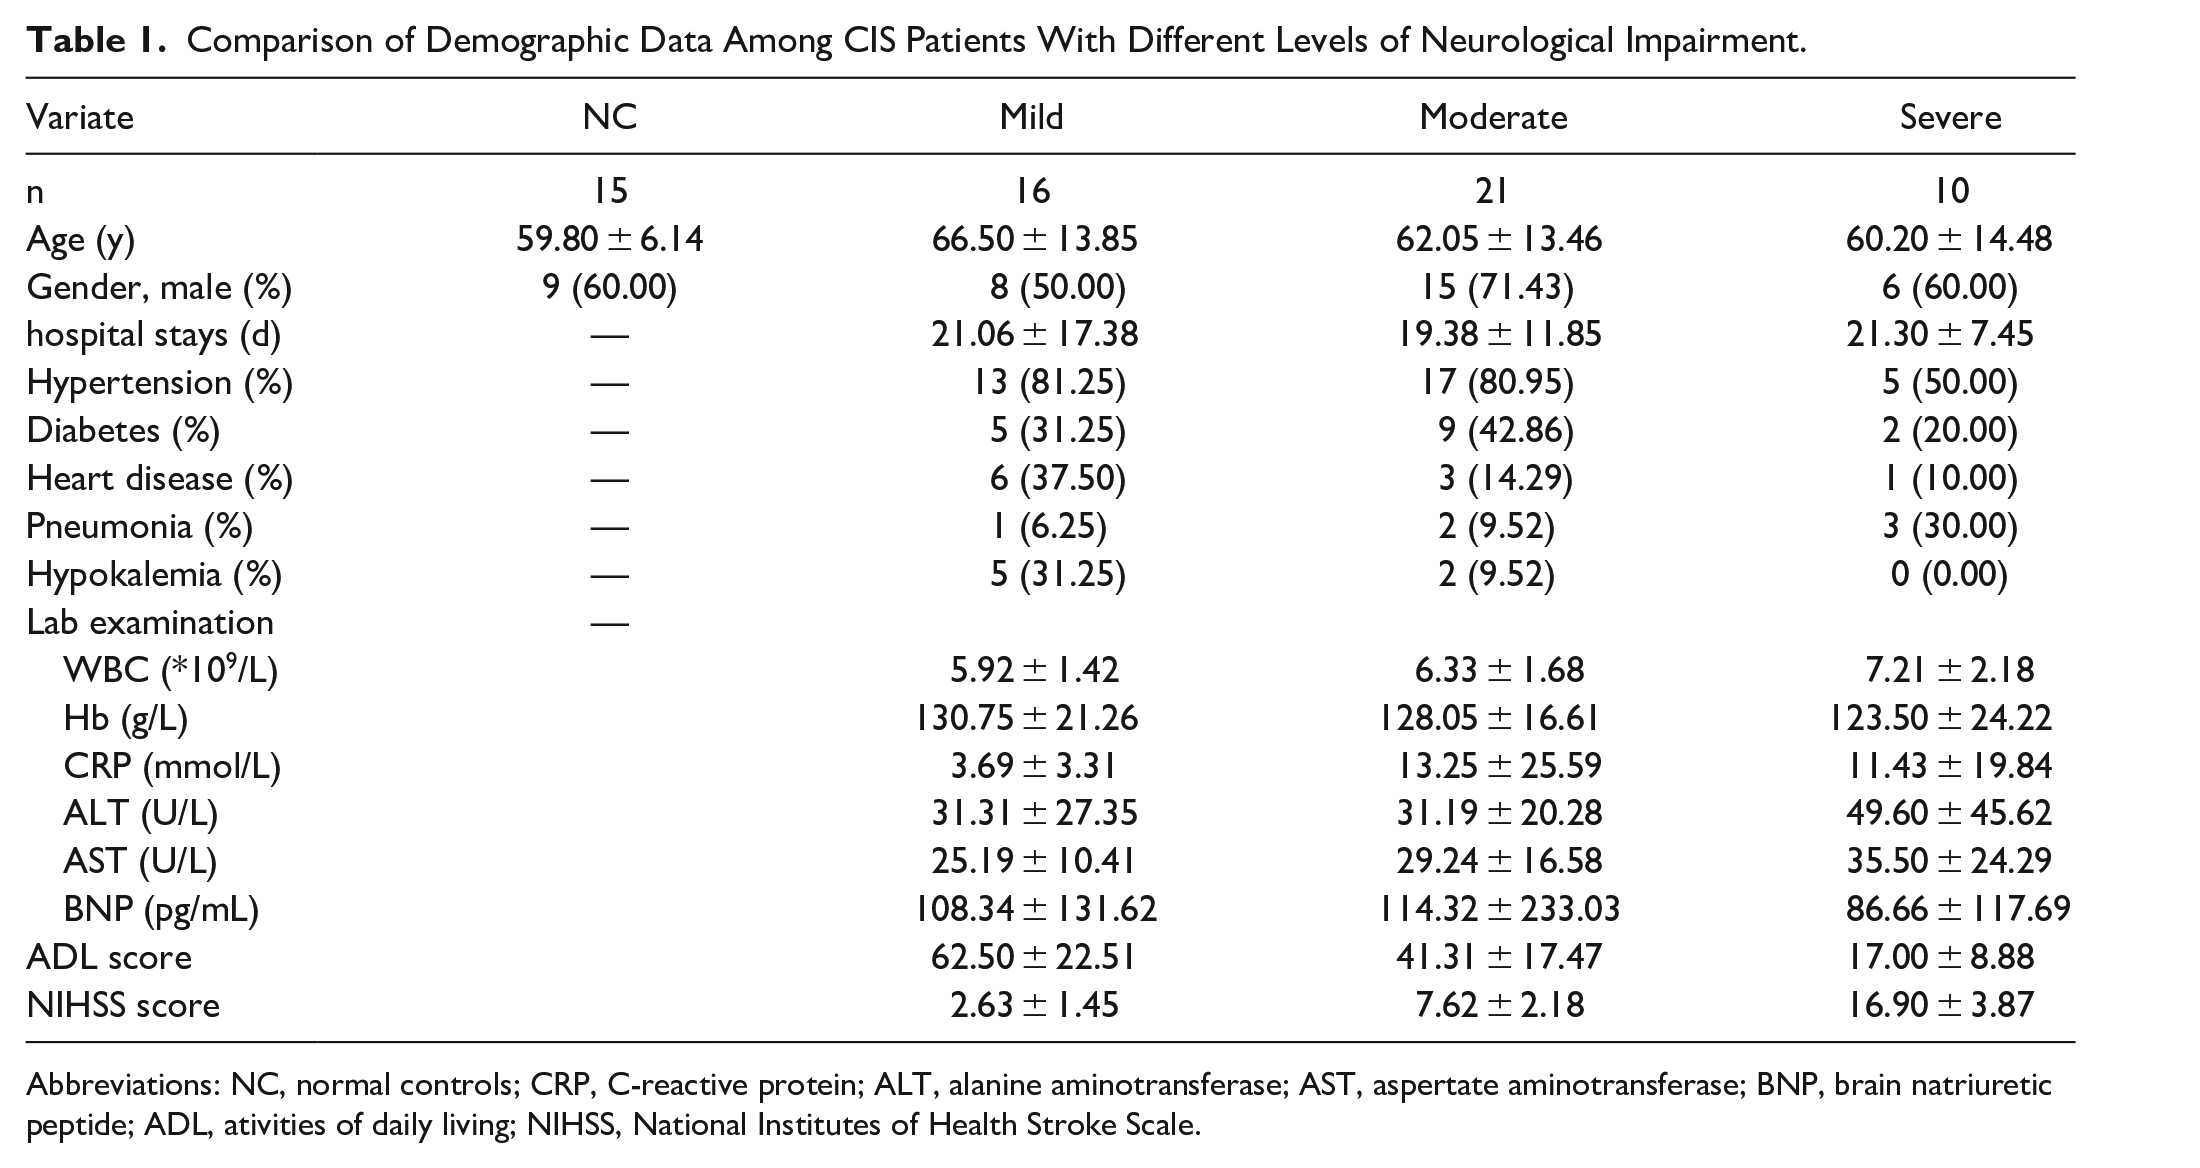
Abbreviations: NC, normal controls; CRP, C-reactive protein; ALT, alanine aminotransferase; AST, aspertate aminotransferase; BNP, brain natriuretic peptide; ADL, ativities of daily living; NIHSS, National Institutes of Health Stroke Scale.
Comparison of GM Diversity in Stroke Patients With Different Degrees of Neurological Impairment
Based on the obtained ASV abundance table, a Venn diagram was used to illustrate the number of ASVs in the stroke groups with different degrees of neurological damage and the control group. As shown in Figure 1, the total ASV abundance of the 4 groups of subjects’ GM was 7412. There were 392 ASVs that were shared among the 4 groups. Among these, 1560 ASVs were unique to the mild stroke group, 1650 ASVs were unique to the moderate stroke group, 663 ASVs were unique to the severe stroke group, and 1881 ASVs were unique to the healthy control group.
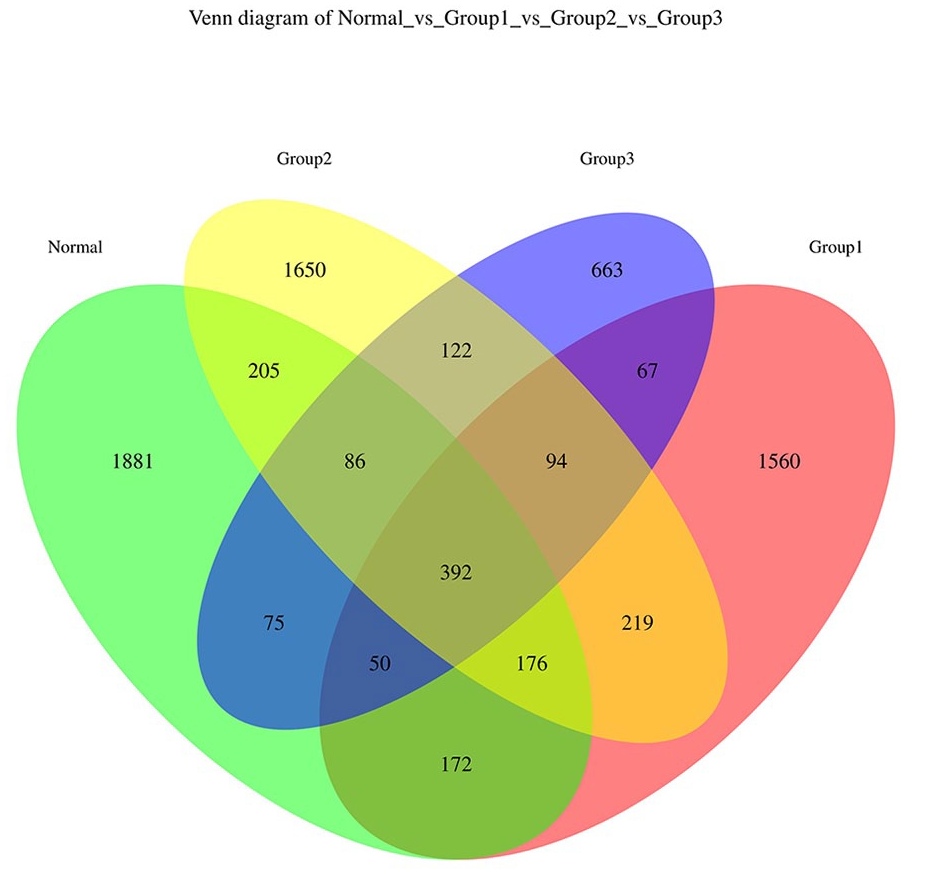
Venn diagram depicting the distribution of GM ASVs among CIS patients with different degrees of severity and the healthy controls. Group 1: mild stroke group; Group 2: moderate stroke group; and Group 3: severe stroke group; Normal: control group.
Based on the ASV abundance table, we conducted PCoA using the vegan package in R software. Different colors represent different groups, and closer sample distances indicate greater similarity in the microbial composition structure between samples, with smaller differences. Figure 2A is based on the Bray–Curtis distance matrix (F = 1.70, P = .001), Figure 2B is based on the Jaccard distance matrix (F = 1.69, P = .001), Figure 2C is based on the unweighted UniFrac distance matrix (F = 2.42, P = .001), and Figure 2D is based on the weighted UniFrac distance matrix (F = 1.80, P = .05). These analyses indicate that there are significant differences in the composition of GM between stroke groups with different degrees of severity and the control group.
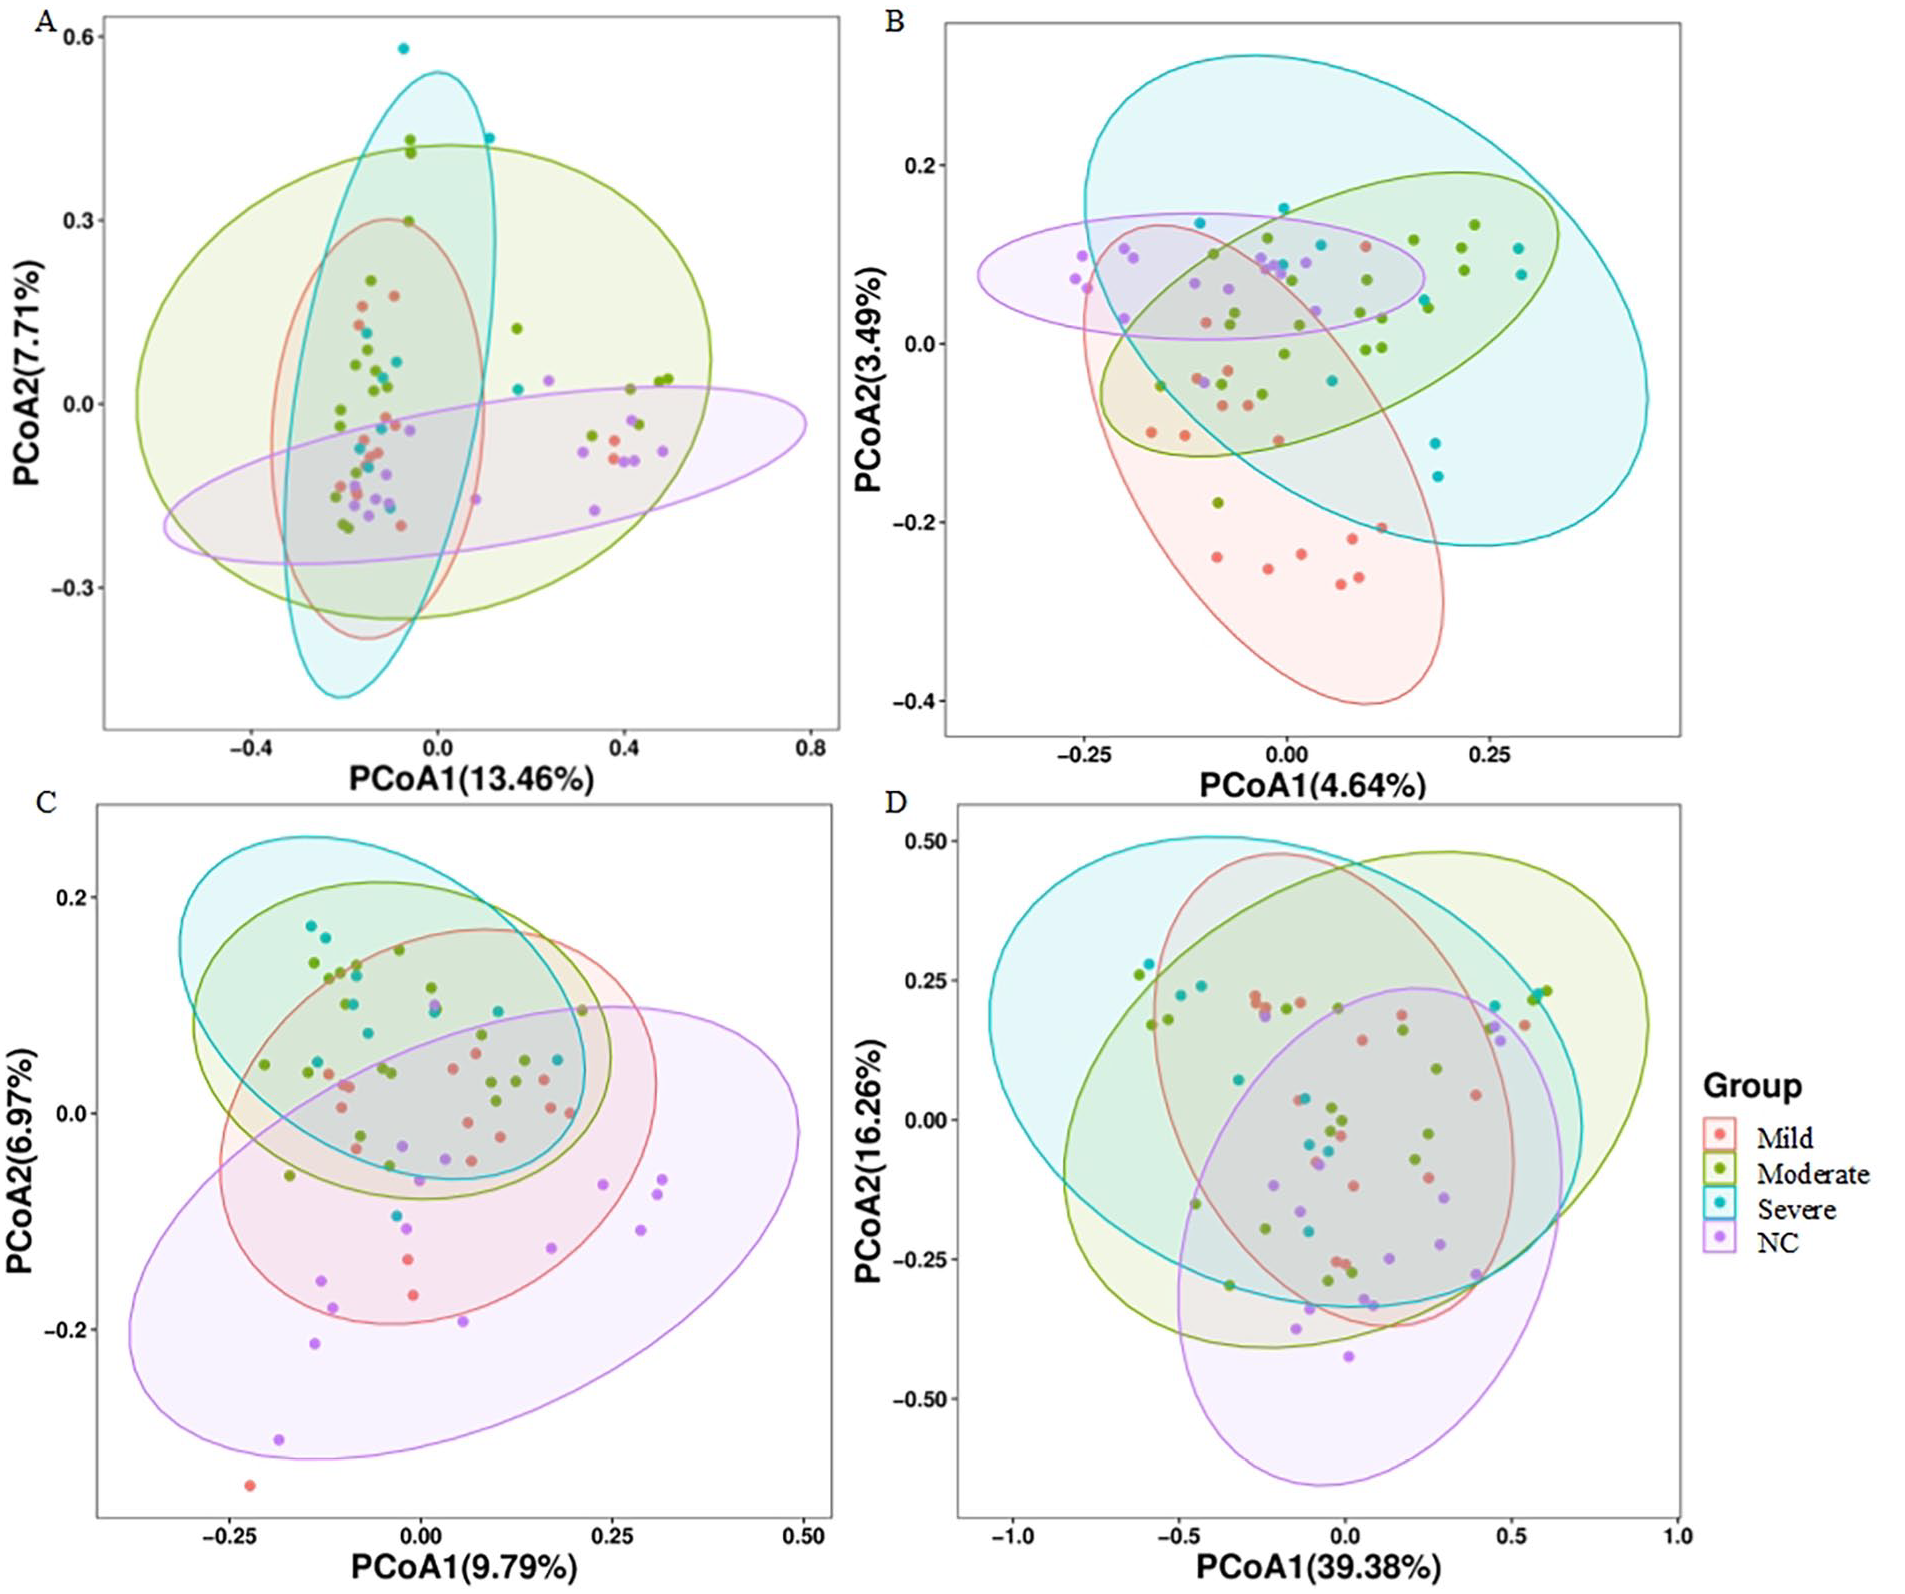
Comparison of Beta diversity of GM among the 4 groups. Beta diversity was assessed by PCoA generated from (A) Bray–Curtis distance matrix. (B) Jaccard distance matrix. (C) unweighted UniFrac distance matrix. (D) weighted UniFrac distance matrix.
Figures 3A to F represent the Alpha diversity analysis of the GM. The α-diversity of the microbial community, encompassing species richness (as indicated by Chao1 and observed_otus) as well as richness and evenness (reflected by the Shannon index and Simpson index), revealed that the control group exhibited greater species diversity compared to patient groups. Furthermore, it was observed that the severe group experienced a more pronounced loss in species diversity. The Shannon index in the severe stroke group showed a significant decrease compared to the control group (Figure 3B). Other Alpha diversity metrics, such as the number of species (Figure 3A), Simpson index (Figure 3C), goods_coverage index (Figure 3D), Chao1 index (Figure 3E), and Pielou_e (Figure 3F), did not show significant differences. This suggests that there is an observable but not statistically significant difference in within-group diversity between the stroke groups and the control group in terms of GM.
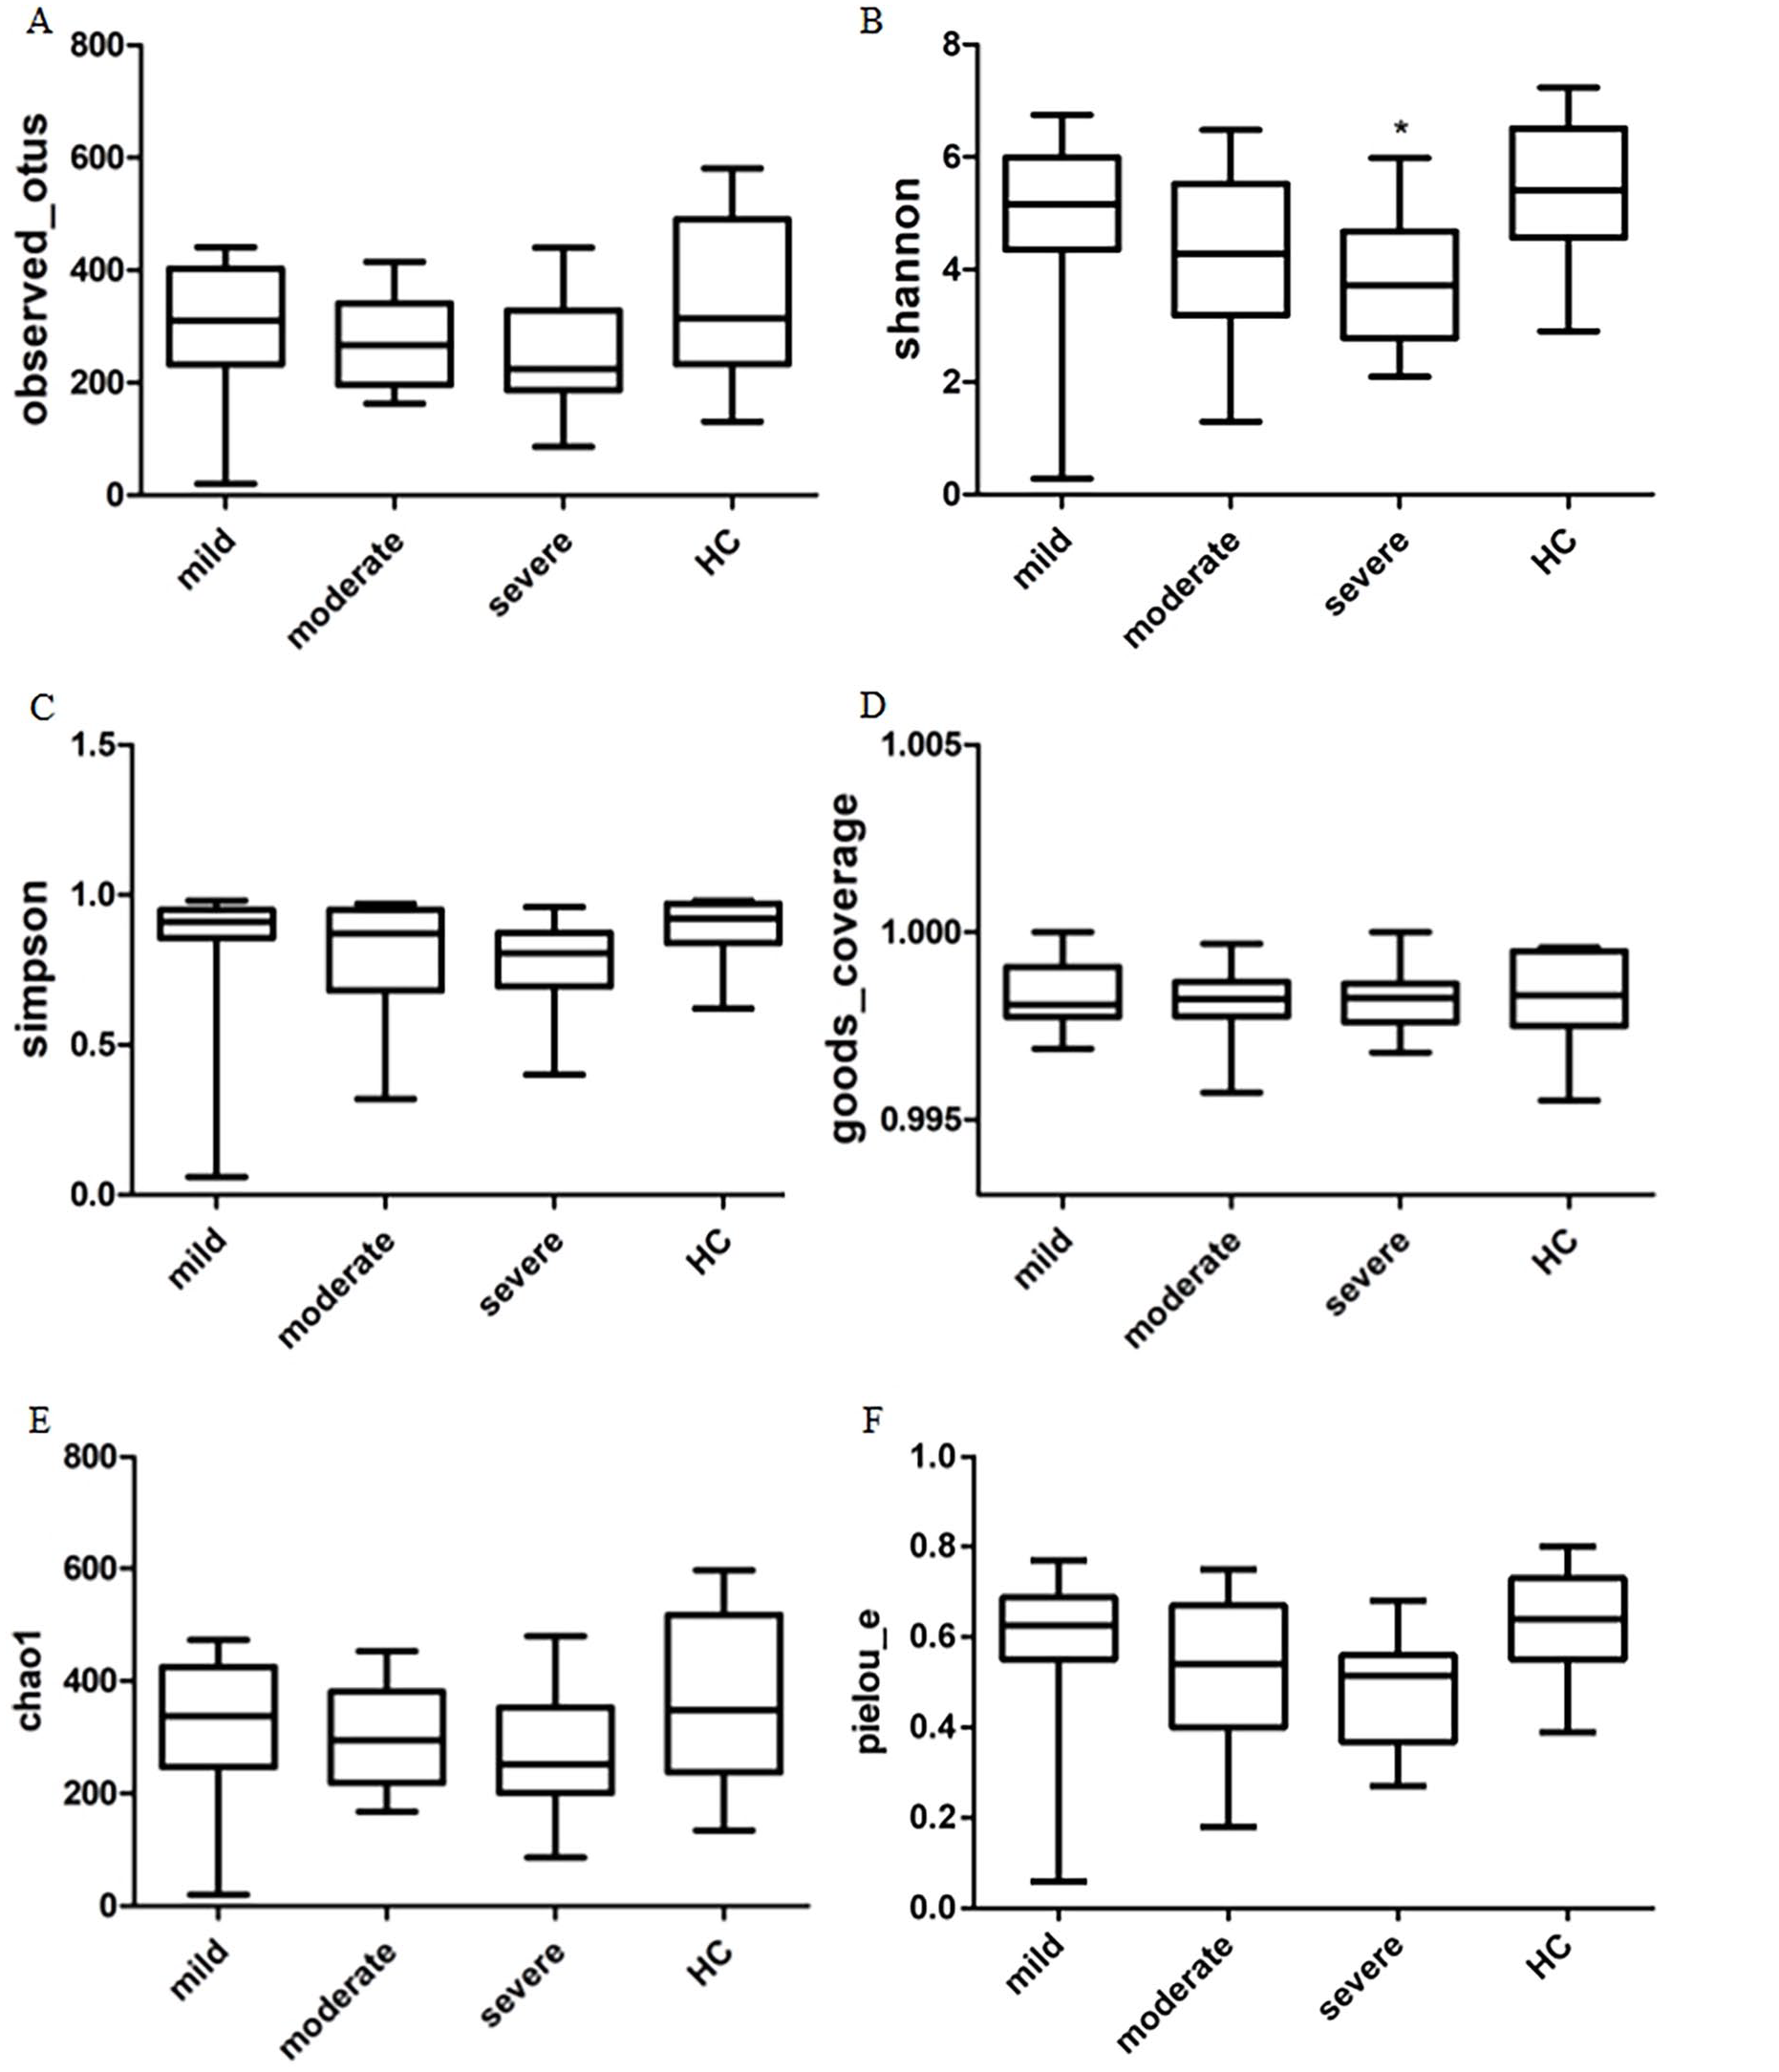
Comparison of Alpha diversity of GM among the 4 groups. Six indices were used to represent the a-diversity. (A) observed_otus. (B) Shannon index. (C) Simpson index. (D) goods_coverage. (E) Chao1. (F) Pielou_e.
Difference in the Microbial Composition at Different Levels
Based on the ASV annotation results and the ASV abundance table for each sample, species abundance tables were obtained at various taxonomic levels, including Domain, Phylum, Class, Order, Family, Genus, and Species. The classification of the top 30 species in terms of abundance at different taxonomic levels can be seen in Figure 4. Community structure analysis was then conducted between the stroke groups and the control group using species abundance tables at different taxonomic levels.
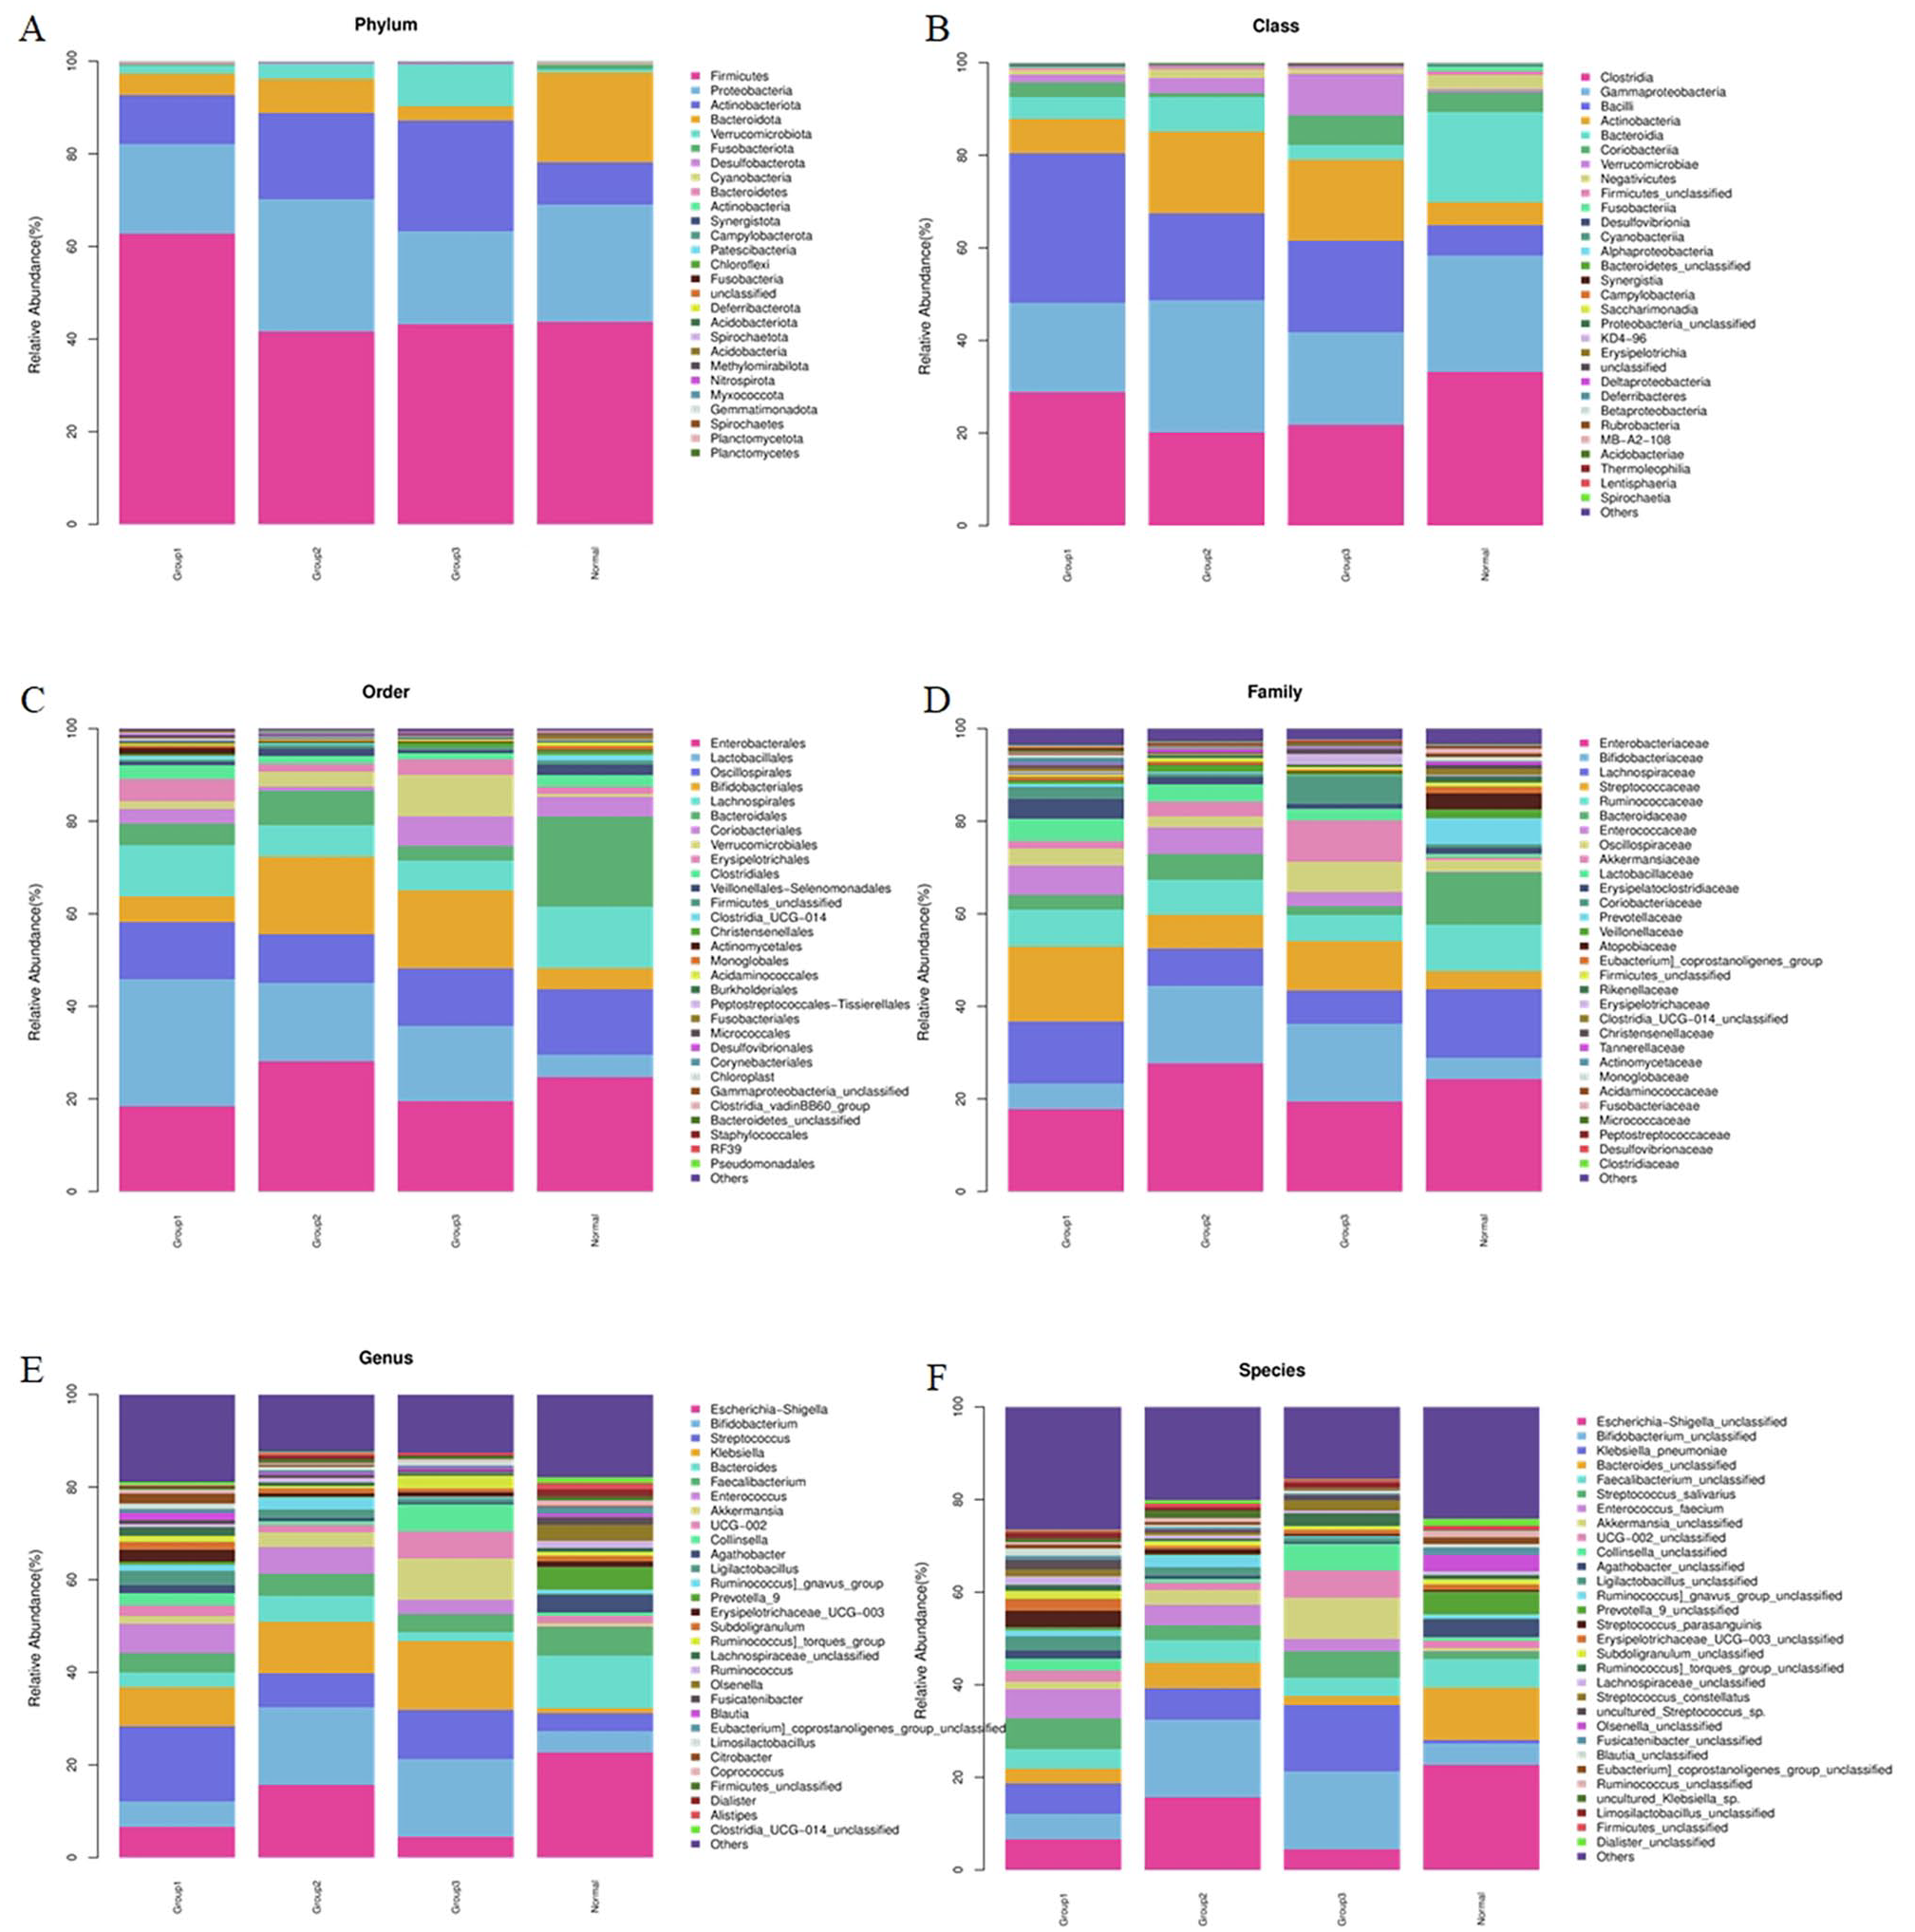
Composition of the top 30 microbial communities in the GM of stroke patients with different degrees of neurological damage and the control group. Taxonomic summary of the GM of patients and controls at: (A) Phylum level. (B) Class level. (C) Order level. (D) Family level. (E) Genus level. (F) Species level.
At the Phylum level, there were no statistically significant differences observed among the groups. The dominant phyla across all 4 groups included Firmicutes, Proteobacteria, Actinobacteriota, and Bacteroidota. However, the ratio of Actinobacteriota to Bacteroidota was less than 1 in the healthy control group, and it gradually increased with the severity of stroke in patients. Statistical analysis revealed significant differences in the relative abundance of 7 phyla, including Bacteroidota, Verrucomicrobiota, Cyanobacteria, Actinobacteriota, Patescibacteria, and Acidobacteriota, between the stroke group and the control group, as shown in Supplemental Figure S1.
At the Class level (Supplemental Figure S2), Clostridia, Gammaproteobacteria, Bacilli, Actinobacteria, and Bacteroidia were the dominant classes among the groups. Compared to the relative abundance of GM in the control group, the moderate stroke group showed a decrease in Clostridia (20.16% vs 33.19%, P = .047), and the mild stroke group exhibited an increase in Bacilli (32.37% vs 6.55%, P = .047). Furthermore, the relative abundance of Bacteroidia, Cyanobacteriia, and Alphaproteobacteria was higher than that in the normal control group, while Deltaproteobacteria had a lower relative abundance than in the normal control group.
At the Order level (Supplemental Figure S3), a total of 18 different orders were identified between the stroke and control groups. Among these, the relative abundance of Lactobacillales was significantly higher in the mild stroke group compared to the normal control group (27.45% vs 4.85%, P = .006). Additionally, the relative abundance of Lachnospirales, Bacteroidales, Monoglobales, Acidami-nococcales, and Chloroplast was lower in the stroke groups compared to the normal control group.
At the Family level (Supplemental Figure S4), a total of 30 different families were identified between the stroke and control groups. Among these, the relative abundance of Streptococcaceae was significantly higher in the mild stroke group compared to the normal control group (16.26% vs 3.93%, P = .019). Additionally, the relative abundance of Lachnospiraceae, Bacteroidaceae, Prevotellaceae, Monoglo-baceae, and Acidaminococcaceae was lower in the stroke groups compared to the normal control group.
In Figure 4E and F, it is evident that at the Genus and Species levels, the GM becomes more diversified. When comparing the relative abundance of GM between the stroke group and the control group, a total of 77 different genera and 96 different species were found to have statistically significant differences. Among these, the relative abundance of Escherichia–Shigella, Bacteroides, Agatho-bacter, Prevotella_9, and Fusicatenibacter was lower in the stroke group compared to the control group, while Streptococcus had a higher relative abundance in the stroke group, as shown in Supplemental Figure S5.
LEfSe analysis show the differential taxa obtained when comparing the mild, moderate, and severe stroke groups with the control group, ranked by their effect size, with the length of the bar representing the LDA score. Red bars represent species with higher abundance in the stroke group, while green bars represent species with higher abundance in the control group.
In the mild stroke group (Supplemental Figures S6), the top upregulated differential taxa included Bacilli class (c__Bacilli), Lactobacillales order (o__Lactobacillales), Firmicutes phylum (p__Firmicutes), Klebsiella genus (g__klebsiella), and Enterococcus faecium species (s__Enterococcus_faecium). The downregulated differential taxa included Escherichia–Shigella genus (g__Escherichia–Shigella), unclassified Escherichia–Shigella species (s__Escherichia_Shigella_unclassified), Bacteroidales order (o__Bacteroidales), Bacteroidota phylum (p__Bacteroidota), and Bacteroidia class (c__Bacteroidia).
In the moderate stroke group (Supplemental Figures S7), the top upregulated differential taxa included Klebsiella genus (g__Klebsiella), Klebsiella pneumoniae species (s__Klebsiella_pneumoniae), Verrucomicrobiota phylum (p__Verrucomicrobiota), Verrucomicrobiales order (o__Verrucomicrobiales), and unclassified Akkermansia species (s__Akkermansia_unclassified). The downregulated differential taxa included Clostridia class (c__Clostridia), Bacteroidales order (o__Bacteroidales), Bacteroidota phylum (p__Bacteroidota), Bacteroidia class (c__Bacteroidia), and Escherichia–Shigella genus (g__Escherichia–Shigella).
In the severe stroke group (Supplemental Figures S8), the top upregulated differential taxa included Actinobacteriota phylum (p__Actinobacteriota), Klebsiella genus (g__klebsiella), Coriobacteriaceae family (f__Coriobacteriaceae), unclassified Collinsella species (s__Collinsella_unclassified), and Collinsella genus (g__Collinsella). The top downregulated differential taxa in the severe stroke group were consistent with those in the mild stroke group.
Predicted Function Analysis of Gut Microbiome
Based on the results of PICRUSt and in combination with the KEGG database, microbial community functions were predicted for ASVs. According to the KEGG database, biological metabolic pathways can be classified into 3 hierarchical levels. The first-level classification includes Genetic Information Processing, Unclassified, Cellular Processes, Organismal Systems, Environmental Infor-mation Processing, Human Diseases, and Metabolism. The second-level classification encompasses 41 different functions, including Replication and Repair. The third-level classification includes 294 functions, such as Vasopressin-regulated water reabsorption.
In the second-level classification, compared to the control group, the mild stroke patients exhibited enhanced functions in Membrane Transport and Xenobiotics Biodegradation and Metabolism, while functions related to Folding, Sorting, and Degradation; Metabolism of Cofactors and Vitamins; Biosynthesis of Other Secondary Metabolites; Cancers; Endocrine System; Glycan Biosynthesis and Metabolism; Nervous System; Transport and Catabolism, among others, were reduced. Moderate stroke patients showed enhanced functions in Membrane Transport, Xenobiotics Biodegradation and Metabolism, and Signaling Molecules and Interaction, while functions related to Folding, Sorting, and Degradation; Metabolism of Cofactors and Vitamins; Cancers; Cell Motility; Environmental Adaptation; Immune System; Energy Metabolism, among others, were reduced. Severe stroke patients exhibited reduced functions only in Cell Motility and Digestive System.
In the third-level classification, functions related to Transporters, Glycolysis/Gluconeogenesis, Glycerolipid metabolism, and others were higher in different stroke severity groups compared to the control group. Meanwhile, functions related to Energy metabolism, General function prediction only, Chaperones and folding catalysts, Bacterial motility proteins, and others were lower in different stroke severity groups compared to the control group.
Predictor Performance of Blautia
The results of the analysis showed a significant negative correlation between the relative abundance of the Blautia genus (p__Firmicutes|c__Clostridia|o__Clostridiales|f__Lachnospiraceae| g__Blautia) within the Firmicutes phylum, Clostridia class, Clostridiales order, Lachnospiraceae family, and NIHSS scores in stroke patients (r = −.287, P = .050), see Figure 5. However, no direct correlation was observed between the abundance of other microbial groups and NIHSS scores.
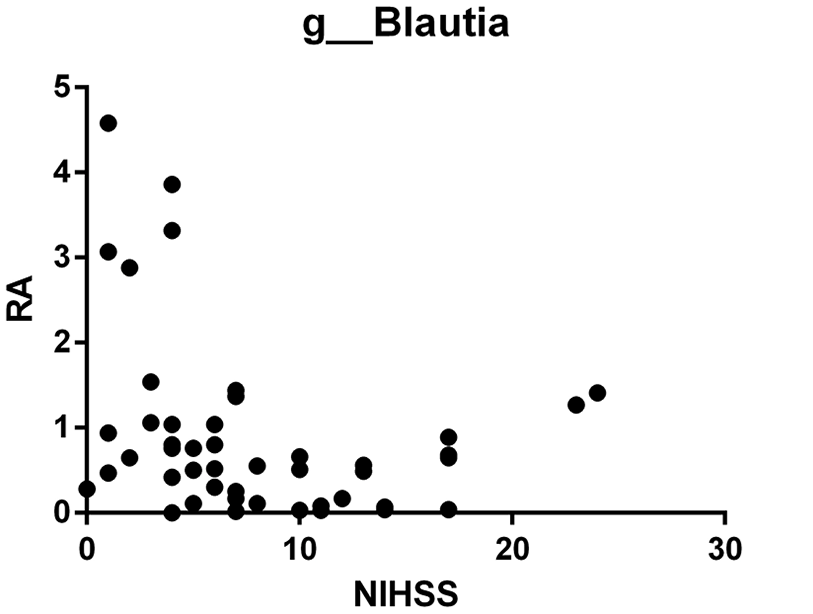
Correlation analysis between the relative abundance of Blautia and NIHSS score.
Discussion
Neural tissue damage can lead to impairment of gut function and structure, including intestinal barrier disruption, changes in intestinal mucosal permeability, and alterations in GM. 18 The GM is critically important for human health, and the “microbiota–gut–brain axis” serves as a communication system for neural, hormonal, and immune signals between gut functions and brain neural functions, providing a potential route for access to the brain for GM and their metabolic products. 19 Previous research has often considered neurological diseases and gastrointestinal issues as separate entities. However, recent studies have found that patients with brain injuries have multiple risk factors that exacerbate gastrointestinal dysfunction. Additionally, microbial-derived molecules play a potential role in the progression of neural damage, increasing the focus on the connection between the gut and brain.
This study conducted a comparative analysis of the GM structure, diversity, and its correlation with neural function in patients with different levels of neurologic impairment due to CIS in comparison to a normal control group. The results showed that there were no significant differences in the overall microbial abundance and diversity between the 2 groups. However, there were differences in the relative abundance of specific microbial groups, with an increase in certain taxa such as Streptococcus, Lactobacillus, Firmicutes, Klebsiella, and Coriobacteriaceae, while taxa like Escherichia–Shigella and Bacteroides showed a decrease. This suggests the enrichment of potentially pathogenic bacteria in CIS patients, which may further contribute to disease progression.
Multiple preclinical and clinical studies have indicated that ischemic stroke leads to alterations in the composition of the GM. Under pathological circumstances, GM alterations can escalate intestinal permeability, facilitating translocation and colonization, thereby eliciting systemic inflammatory responses and organ damage. Moreover, the GM plays a crucial role in the synthesis and release of various hormones, neurotransmitters, and active metabolites, which orchestrate host metabolism and immune function, consequently influencing brain function and host behavior. 20 For instance, certain microbial genera such as Faecalibacterium, Oscillibacter, Roseburia, Bifidobacterium, Coprococcus, and Butyrivibrio contribute to immunomodulation through the production of SCFAs and bile acids, exerting a protective effect on the ischemic brain.9,21,22 Conversely, genera like Prevotella, Klebsiella, and Fusobacterium have been associated with heightened inflammation and exacerbated neural damage.23,24 Thus, partial supplementation of specific beneficial bacteria into the GM to restore or enhance the equilibrium of equilibrium of the “microbiota–gut–brain axis” has been investigated for its potential therapeutic benefits in CIS. Animal experiments have shown that oral administration of probiotics, such as Bifidobacterium longum 25 and Clostridium butyricum 26 reduced the degree of cerebral ischemia injury. Fecal microbiota transplantation from healthy donor has also proven to be a possible therapeutic approach.21,27 In human studies, probiotics are currently used in clinical practice, and help in repairing brain injury. Combined live Bifidobacterium, Lactobacillus, Enterococcus, and Bacillus cereus tablets can promote neurological recovery in stroke patients. 28
Notably, this study identified a significant negative correlation between the relative abundance of the Blautia genus and NIHSS scores in stroke patients. Blautia is an anaerobic bacterium belonging to the Lachnospiraceae family and has garnered attention for its potential benefits in inflammatory and metabolic diseases.29,30 Blautia composition and variation in the gut have been associated with factors such as age, geography, diet, genotype, health status, disease conditions, and other physiological states. Blautia has been found to be decreased in elderly and cancer patients, 31 increased in irritable bowel syndrome patients, 32 negatively correlated with obesity indices, 33 and involved in insulin resistance processes. 34 The physiological characteristics of Blautia include preventing the colonization of pathogens by producing bacteriocins, upregulating the production of regulatory T cells and SCFAs, thereby exhibiting anti-inflammatory properties 35 and maintaining glucose homeostasis, 36 and improving neurological and psychiatric disorders through the production of bioactive molecules. 37 Blautia can also perform 7-α-dehydroxylation of primary bile acids, converting them into secondary bile acids, which are considered immunomodulators. 38 In an experimental stroke model, intravenous administration of deoxycholic acid demonstrated neuroprotective effects by reducing infarct size and improving neurological function. 39 Although Blautia has displayed a range of potential probiotic characteristics, there is still a need for more comprehensive research on this genus in the future. 40
There are several limitations in this paper. Firstly, the study was performed at a single-center with a small sample size, a larger sample size are needed in the future research to enhance the generalizability of the findings. Secondly, due to the lack of pre-stroke samples, we are unable to conduct before-and-after comparisons. By comparing stroke patients to healthy controls, there may be a risk of selection bias. Thirdly, the study lacks follow-up information, future research on the GM and stroke patient outcomes needs to be conducted. Fourthly, the paper only demonstrated differences in GM among stroke patients, but did not validate the impact of the specific taxa on stroke.
In conclusion, our results indicate that different degrees of stroke severity have varying effects on the composition and structure of the GM. This study sheds light on the secondary damage occurring after ischemic stroke from the perspective of the “gut–brain axis.” The GM not only reveals the pathological process and indicates the severity of neurologic impairment but may also make targeted therapy for CIS patients possible.
Supplemental Material
sj-docx-1-nnr-10.1177_15459683241252608 – Supplemental material for Relationship Between the Gut Microbiota and Neurological Deficits in Patients With Cerebral Ischemic Stroke
Supplemental material, sj-docx-1-nnr-10.1177_15459683241252608 for Relationship Between the Gut Microbiota and Neurological Deficits in Patients With Cerebral Ischemic Stroke by Wangxiao Bao, Yun Sun, Juehan Wang, Shuang Wei, Lin Mao, Jinjin Zheng, Ping Liu, Xiaofeng Yang and Zuobing Chen in Neurorehabilitation and Neural Repair
Footnotes
Author Contributions
Wangxiao Bao: Data curation; Formal analysis; Writing—original draft. Yun Sun: Conceptualization; Methodology; Writing—review & editing. Juehan Wang: Data curation; Formal analysis; Software; Writing—original draft. Shuang Wei: Methodology; Supervision.
Lin Mao: Project administration; Supervision; Validation; Visualization. Jinjin Zheng: Methodology; Project administration; Supervision. Ping Liu: Funding acquisition; Writing—review & editing. Xiaofeng Yang: Supervision; Validation; Visualization; Writing—review & editing. Zuobing Chen: Conceptualization; Data curation; Resources; Supervision; Validation.
Declaration of Conflicting Interests
The author(s) declared no potential conflicts of interest with respect to the research, authorship, and/or publication of this article.
Funding
The author(s) disclosed receipt of the following financial support for the research, authorship, and/or publication of this article: This work was supported by grants from National Natural Science Foundation of China (82302852), National Natural Science Foundation of China (82101251), and Natural Science Foundation of Zhejiang Province (LQ21H170002).
Supplementary material for this article is available on the Neurorehabilitation & Neural Repair website along with the online version of this article.
References
Supplementary Material
Please find the following supplemental material available below.
For Open Access articles published under a Creative Commons License, all supplemental material carries the same license as the article it is associated with.
For non-Open Access articles published, all supplemental material carries a non-exclusive license, and permission requests for re-use of supplemental material or any part of supplemental material shall be sent directly to the copyright owner as specified in the copyright notice associated with the article.