
Abstract
Background and Objective
Homonymous hemianopia caused by cerebrovascular disease may improve over time. This study investigated whether functional neuroimaging can predict the prognosis of hemianopia due to cerebral infarction.
Methods
We studied 19 patients (10 men and 9 women) with homonymous hemianopia and compared them with 34 healthy subjects (20 men and 14 women). Cerebral glucose metabolism was measured by 18F-fluorodeoxyglucose positron emission tomography (FDG-PET), 1 to 6 months after the onset. Bilateral regions of interest (ROIs) were selected from the posterior and, anterior striate cortices, extrastriate cortex, and thalamus. Furthermore, semi-quantitative data on cerebral glucose metabolism were obtained for ROIs and compared with the data obtained for homologous regions in the contralateral hemisphere by calculating the ipsilateral/contralateral (I/C) ratio.
Results
The I/C ratio for the cerebral glucose metabolism in the posterior striate cortex was high (>0.750) in 8 patients, and the central visual field of these patients improved or showed macular sparing. The I/C ratio for cerebral glucose metabolism in the anterior striate cortex was high (>0.830) in 7 patients, and the peripheral visual field of these patients improved. However, no improvement was observed in 9 patients with a low I/C ratio for cerebral glucose metabolism in both the posterior and anterior striate cortices.
Conclusion
Measurement of cerebral glucose metabolism in the striate cortex is useful for estimating visual field prognosis. Furthermore, FDG-PET is useful in predicting the prognosis of hemianopia.
Keywords
Introduction
Damage to the visual cortex or geniculostriate pathways produces contralateral homonymous visual field defects.1,2 Homonymous hemianopia is caused by cerebrovascular disease or head trauma, whereas hemianopia due to cerebral infarction is mainly caused by an infarction in the posterior cerebral artery. 3 In clinical practice, visual field defects gradually improve in some patients over the course of a few months.4-10 Tiel and Kolmel 8 observed that visual field improvements in patients with complete hemianopia due to ischemic occipital lobe infarction were more common in the lower quadrants and temporal crescents. These investigatiors also suggested that vascular mechanisms operate during the recovery process. Gray et al 6 studied patients with hemianopia due to acute cerebral hemisphere stroke and observed complete recovery of the visual field in 17% of the patients with complete hemianopia and in 72% of the patients with partial hemianopia after 28 days. Damage to the optic radiations or visual cortex causes trans-synaptic retrograde degeneration of retinal ganglion cells, and it has been reported that ganglion cell complex (GCC) thickness in the deficit area of the visual field reflects the visual function of the defective visual field.11,12 Transneuronal retrograde degeneration of retinal ganglion cells after damage of the striate cortex has previously been observed in macaque monkeys, 13 while thinning of GCC can be observed in humans with the practical use of optical coherence tomography (OCT) in clinical practice. 14 Trans-synaptic degeneration also shrinks the optic tract, and optic tract volume shrinkage has been reported to limit the visual field improvement in patients with hemianopia 15 . Bridge et al16,17 also examined optic tract volume in patients with homonymous hemianopia using 3T magnetic resonance imaging (MRI), and they observed decreases in optic tract volume in both congenital and acquired cases. Jindahra et al 18 examined GCC thickness using OCT, and they found a steady rate of thinning by 0.4 µm per year and a negative straight line relationship between time and nerve fibre layer thickness. Patel et al 19 observed increased fractional anisotropy asymmetry in patients with visual pathway damage compared to controls after 3 months post-injury using diffusion tensor imaging. Notably, it has been hypothesized that the residual function of the striate cortex is relates to visual field improvement in patients with hemianopia and that training may also induce plastic changes within the spared regions of the damaged striate cortex. 20 18 F-fluorodeoxyglucose positron emission tomography (FDG-PET) has been used to study metabolic correlations in patients with ischemic lesions in the visual cortex or optic radiations. 21 However, estimating the visual field prognosis using early FDG-PET findings alone is difficult because of the occurrence of diaschisis. Diffusion-weighted MRI and 11C-flumazenil (FMZ)-PET have been used to evaluate acute ischemic cerebral lesions.22,23 Moreover, our previous study that examined cerebral glucose metabolism and central benzodiazepine receptor binding in 8 patients with hemianopia using FMZ-PET revealed that evaluating cerebral glucose metabolism in the visual cortex more than 1 month after onset is useful for estimating the prognosis of the visual field. 4 However, we occasionally encounter patients with different prognoses in the central and peripheral visual fields. 24
We hypothesized that we could separately predict the prognosis of central and peripheral visual fields in patients with hemianopia. To test this hypothesis, we examined the cerebral glucose metabolism in patients with hemianopia using FDG-PET. Furthermore, the distribution of cerebral glucose metabolism in each case was compared with the visual field result 1 year after onset.
Materials and Methods
Participants
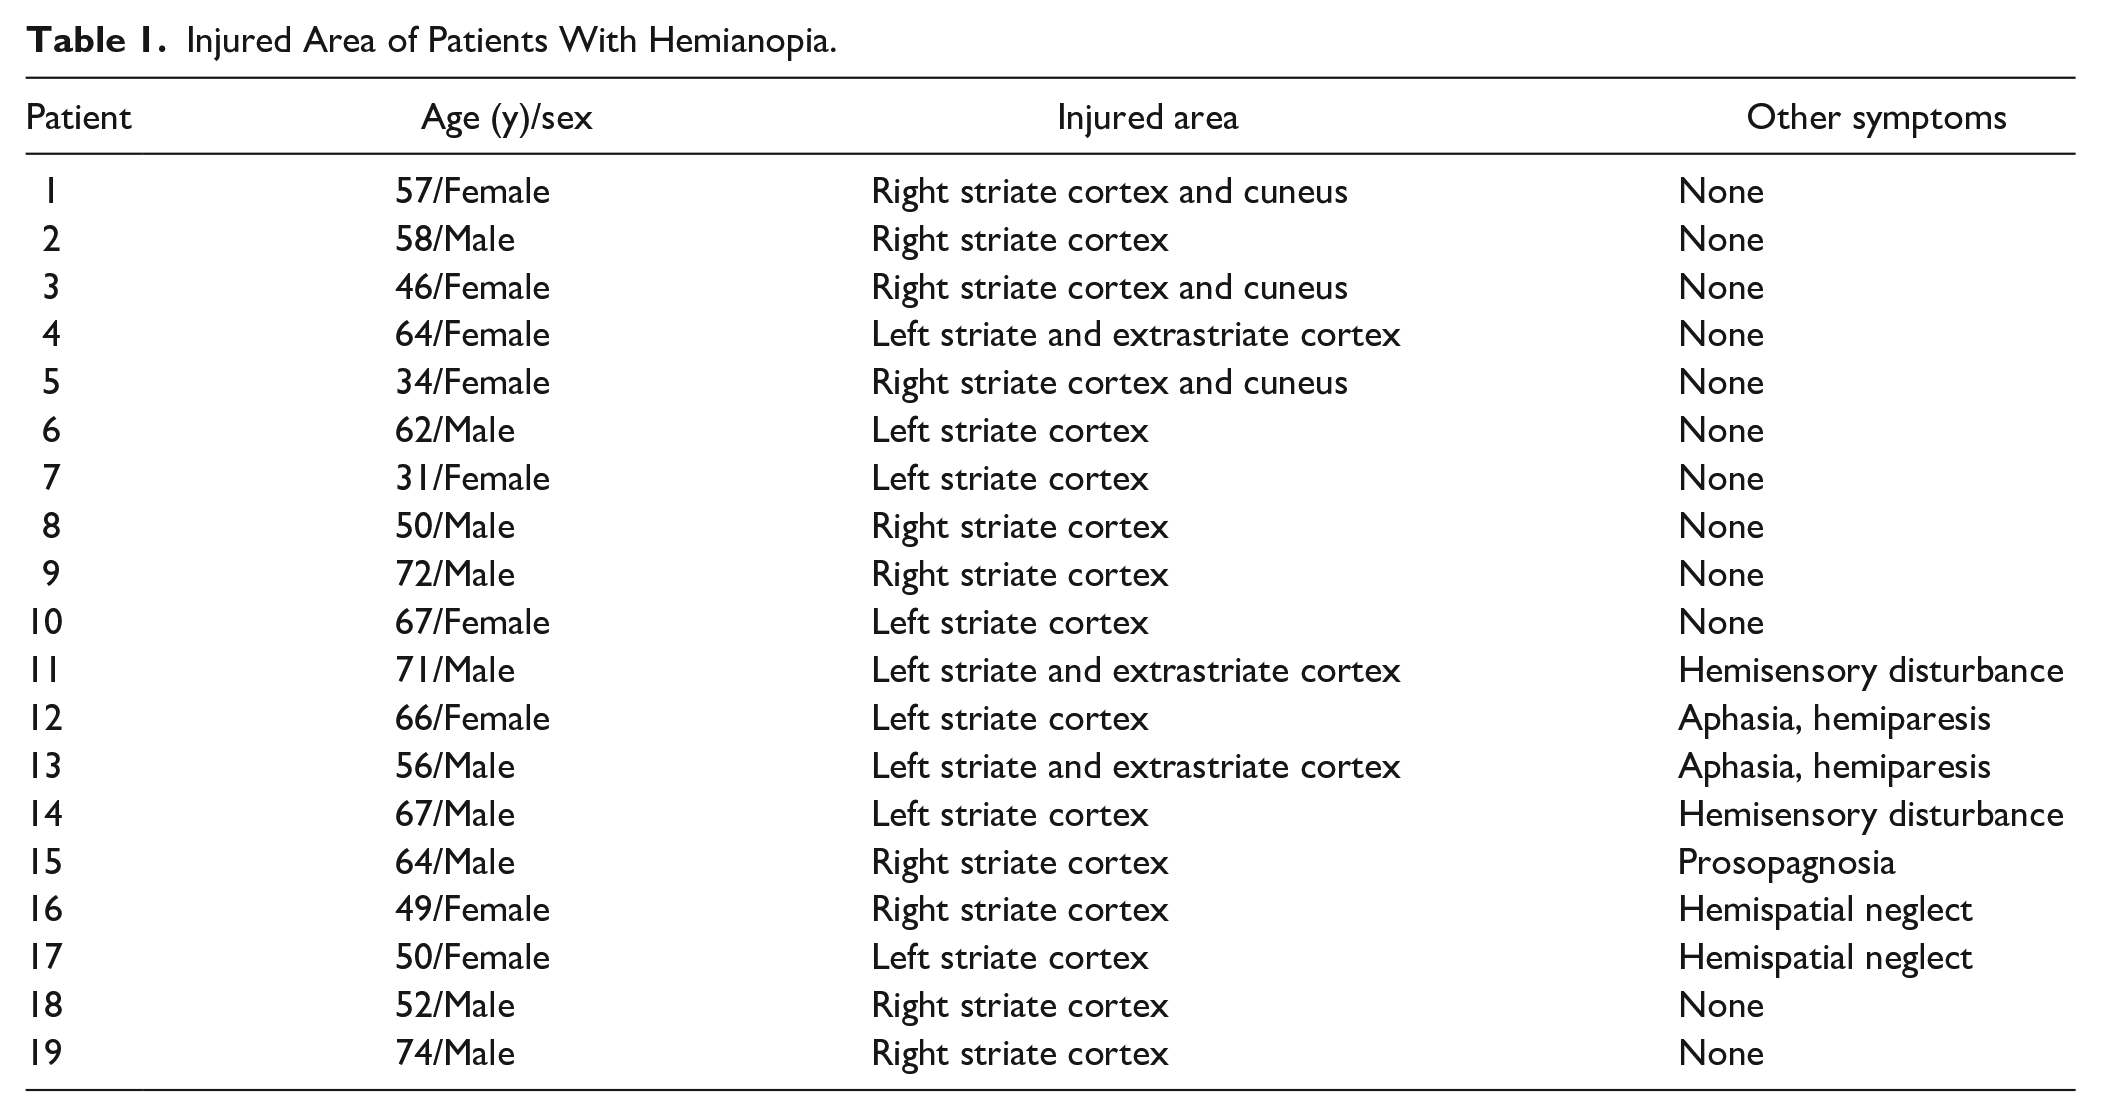
We studied 19 patients (10 men, 9 women; aged 57.6 ± 11.8 years) with homonymous visual field defects caused by an infarction in the posterior afferent visual system (Table 1). Patients visited the Positron Medical Center of the Tokyo Metropolitan Institute of Gerontology. All patients had a corrected visual acuity of 20/30 or better in both eyes. Goldmann kinetic perimetry was performed prior to PET scanning. Patients 1 to 3, 5, 8, 9, 15, 16, 18, and 19 had left homonymous hemianopia, whereas patients 4, 6, 7, 10 to 14, and 17 had right homonymous hemianopia (Table 1). The only clinical disorder in patients 1 to 10, and 18 was homonymous hemianopia. However, in addition to symptoms of hemianopia, patients 11 and 14 had hemisensory disturbance; patients 12 and 13 had aphasia and hemiparesis; patient 15 had prosopagnosia; and patients 16 and 17 had hemispatial neglect.
Injured Area of Patients With Hemianopia.
A total of 34 healthy individuals (20 men, 14 women, aged 56.2 ± 7.9 years) were volunteered as subjects for the healthy group. All participants underwent MRI and FDG-PET. The neurologist diagnosed none of the participants with any other neuro-psychiatric disease. Neither the control subjects nor the patients had taken neuro-psychiatric drugs. Patients with obvious lesions in the visual pathway (lateral geniculate nucleus, optic radiation, or optic tract) were excluded. The pathological mechanism of spontaneous improvement may differ in cases where the visual pathway is injured than in cases where the injury is limited to the cortex. We also excluded patients in whom the occipital lobes were injured bilaterally.
FDG-PET was performed on all patients. FDG-PET scans were performed 2 weeks after the initial Goldmann test in all cases. To exclude the influence of diaschisis associated with acute ischemic lesions, PET was performed at least 1 month after the organic event. 1 Goldmann kinetic perimetry was performed again for all patients 1 year after the onset of hemianopia symptoms. Visual field tests were performed by a single examiner using isopters V/4, I/4, I/3, I/2, and I/1 in all cases. Visual field tests were started while confirming that the fixation did not fluctuate. If there were any areas where the measurement fluctuated, the fixation was checked, and the measurements were repeated. When testing the scotoma or visual field defect area, we asked the subjects to be conscious of central fixation and to confirm fixation each time. In a previous report on visual field improvement in patients with hemianopia, an area within 10° was defined as the central visual field, and the area outside was defined as the peripheral visual field. 8 Moreover, macular sparing, which is often observed in patients with homonymous hemianopia, may occur within the central 10°. 25 We calculated the residual visual field area at the center of the 10° region and the periphery using image analysis software (ImgWorks, Tamanomori) in each individual (Figure 1). At the start of observation and 1 year after onset, the total area of the residual visual field on the injured side of the right and left eyes was compared in the central and peripheral areas. The human visual field projects to the striate cortex, which is wider in the center. The central 10° visual field corresponded to half the surface area of the posterior striate cortex, whereas the peripheral visual field from 10°corresponded to half the surface area of the anterior striate cortex. 26 Both the central and peripheral visual field areas were calculated using an isopter of V/4. The average visual field areas in the healthy group were 314 (center) and 14 678 (pheriphery). A previous report defined the degree of improvement from complete hemianopia as follows: slight restoration for 0% to 10%, moderate restoration for 10% to 30%, and extensive restoration for 30% or more of the lost hemifield. 9 In this study, we defined visual field improvement as an improvement of 10% or more in the lost hemifield, which corresponded to moderate restoration in both the central and peripheral visual fields. Cases in which the central and peripheral visual fields expanded by 10% or more of the lost hemifield (32, center: 1468, periphery) were defined as improved cases.
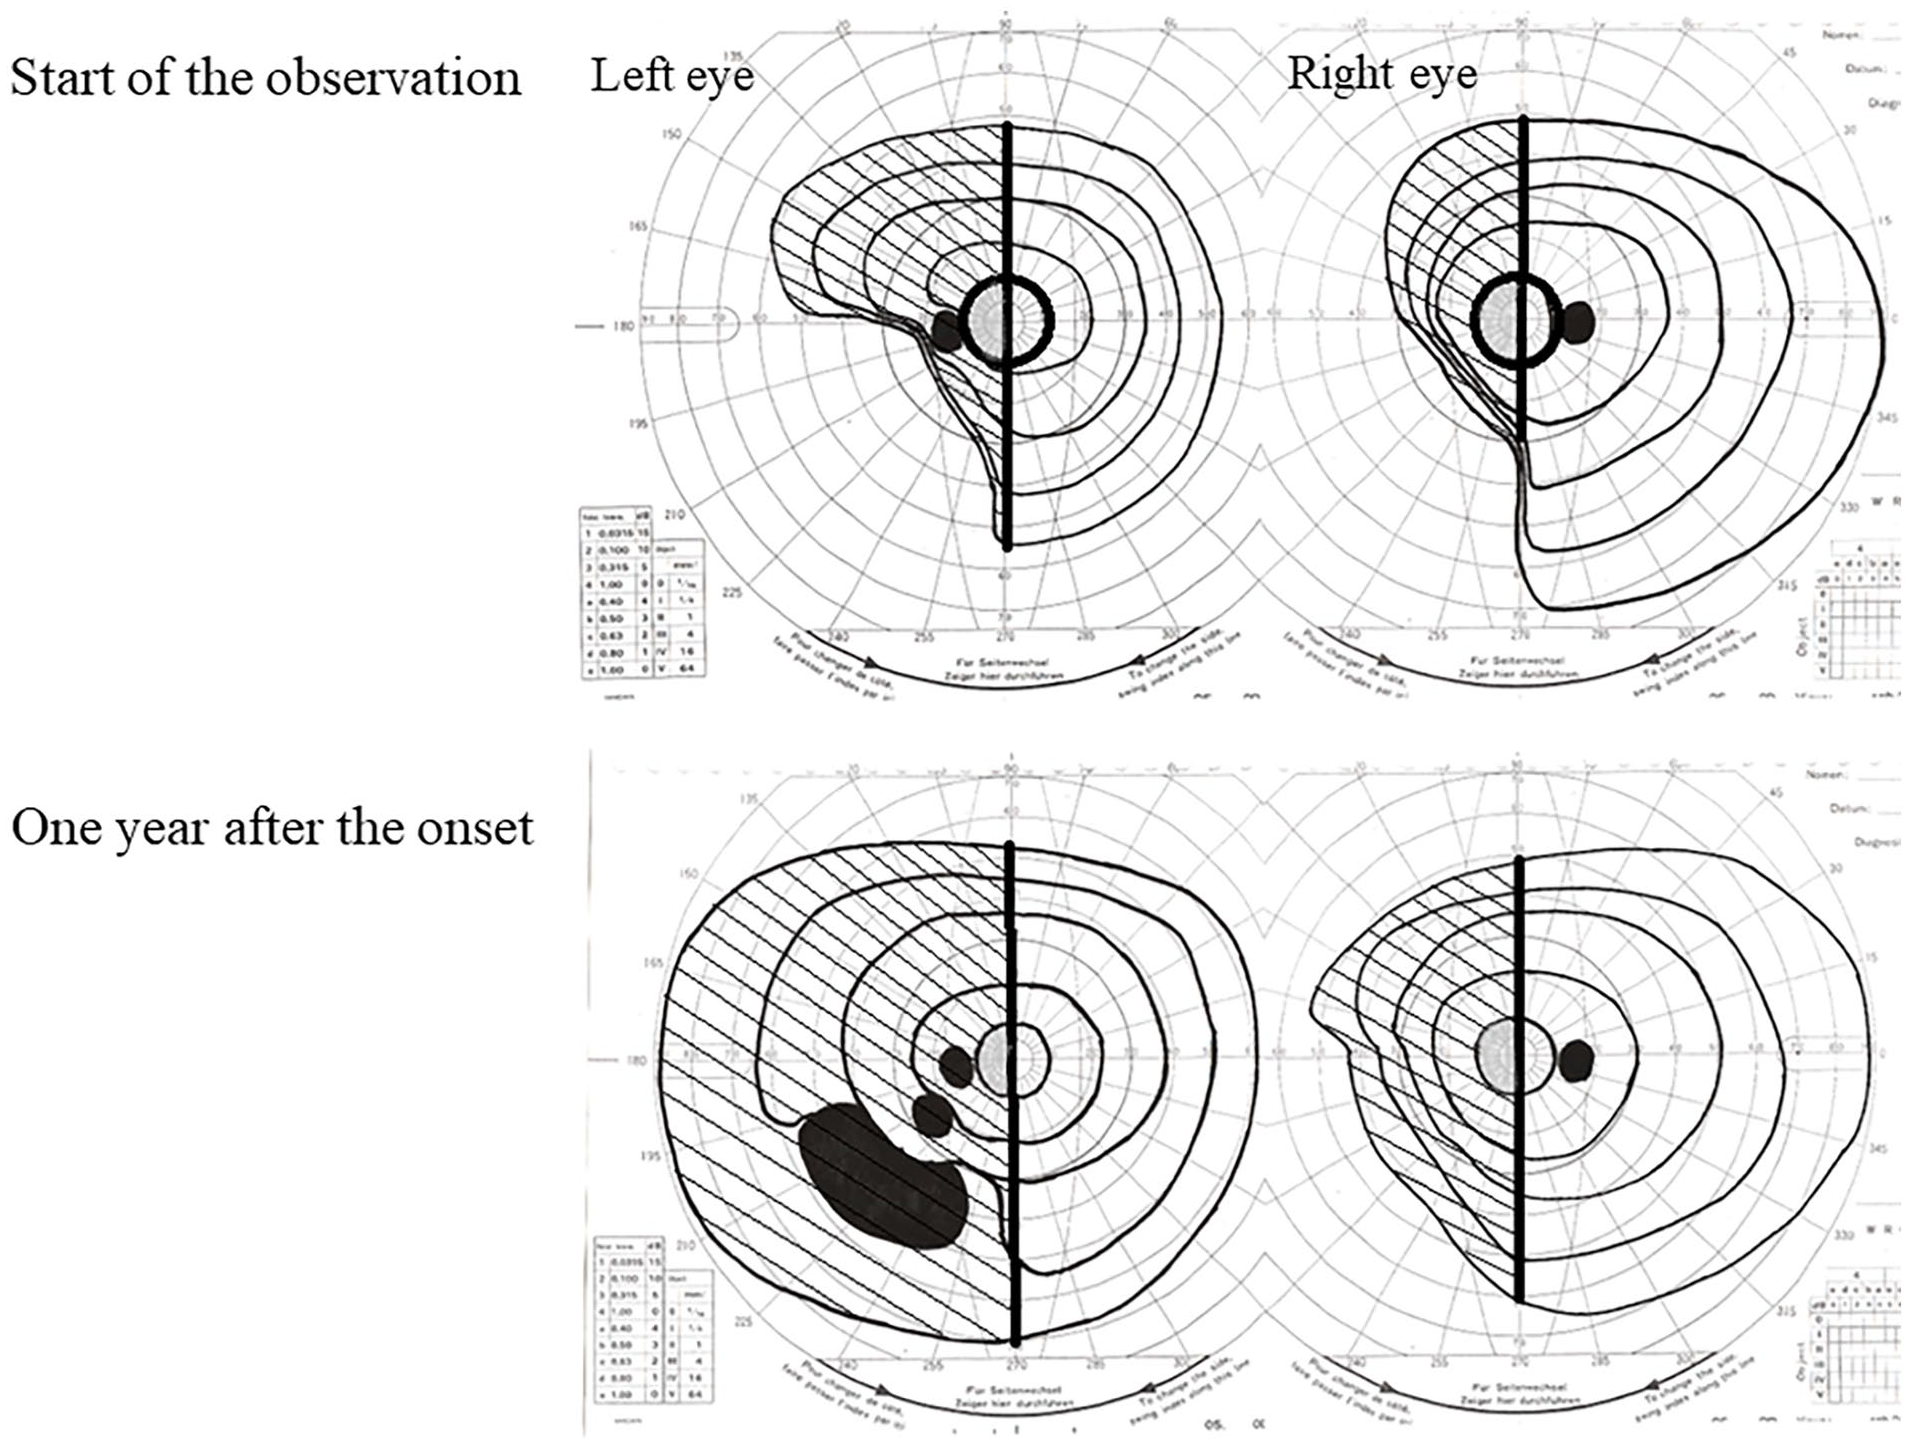
Area calculation of visual field in patients with hemianopia at the start of observation and 1 year after onset. The total remaining visual field area on the injured side of both eyes was calculated at the start of observation and 1 year after onset. The central visual field is gray and the peripheral visual field is shaded.
Informed consent was obtained from all the participants for participation in the study. The study protocol was approved by the Institutional Ethics Committee of the Tokyo Metropolitan Institute of Gerontology. All the procedures conformed to the tenets of the Declaration of Helsinki.
MR Data Acquisition
To study cerebral lesions, MRI was performed on all patients using a 1.5-Tesla Signa Horizon scanner (General Electric Healthcare, Milwaukee, WI, USA). Transaxial T1-weighted (3-dimensional spoiled gradient-recalled [3D-SPGR]; repetition time [TR] = 9.2 ms; echo time [TE] = 2.0 ms; matrix size = 256 × 256 × 124; voxel size = 0.94 mm × 0.94 mm × 1.3 mm) and T2-weighted (first spin echo; TR = 3000 ms; TE = 100 ms; matrix size = 256 × 256 × 20; voxel size = 0.7 mm × 0.7 mm × 6.5 mm) images were obtained.
We confirmed the presence of visual pathway (lateral geniculate nucleus, optic radiation, and optic tract) and bilateral occipital lobe injuries using MRIs.
PET Data Acquisition
PET was performed using a SET 2400W whole-body PET scanner (SET-2400W, Shimadzu Co., Kyoto, Japan) at the Positron Medical Center, Tokyo Metropolitan Institute of Gerontology. A bolus of 2.5 MBq/kg (body weight) 18F-FDG was injected intravenously. Each patient was asked to lie down with eyes closed. A 6-min emission scan in 3D acquisition mode was initiated 45 min after injection, and 50 transaxial images with an interslice interval of 3.125 mm were obtained. Tomographic images were reconstructed using the filtered back-projection method with a Butterworth filter (cut-off frequency, 1.25 cycle/cm; order, 2). The attenuation was corrected by acquiring a transmission scan using a 68Ga/68Ge rotating source.
Data Processing
PET images were registered 3-dimensionally to individual 3D-SPGR MRIs using the Automated Medical Images Registration program. 27 Further data analyses were performed on LIUX workstations using the Dr. View program (AJS, Tokyo, Japan). Regions of interest (ROIs) were interactively defined on the resliced PET images with reference to the corresponding MR images. Bilateral ROIs were selected in the posterior striate cortex, anterior striate cortex, extrastriate cortex, and thalamus (Figure 2), and cerebral glucose metabolism in these regions was measured. We defined the ROIs for each region on the axial slices plane with a slice thickness of 1.3 mm parallel to the anterior commissure–posterior commissure line. ROIs for the striate cortex were set at a total of 10 slices, 6 slices below and 3 slices above, using the slice containing the posterior end of the calcarine sulcus as the reference plane. We defined ROIs for the striate cortex separately into the anterior and posterior regions, as well as the sagittal slices of the MRI, to avoid accidentally placing the ROIs in the extrastriate cortex (V2 and V3), which resides above the striate cortex, 28 and to confirm the anterior and posterior positions of the ROIs. This study included cases in which gray matter structures, including the calcarine sulcus, were damaged on the injured. In such cases, we used anatomical landmarks in the intact hemispheres to defined ROIs on the injured side. The ROIs of the extrastriate cortex were defined as the area outside the striate cortex in the same 10 slices as the striate cortex. We defined the areas of the extrastriate cortex to include areas V2, V3, V4, and the MT. Although the extrastriate cortex (areas V2 and V3) existed above the striate cortex in addition to outside the striate cortex, we did not set ROIs in the extrastriate cortex above the striate cortex to avoid misplacement of the ROIs with the striate cortex. 28 We defined the ROIs for the thalamus between slices 3 and 6 above the slice that contained the rear end of the calcarine sulcus. Cerebral glucose metabolism recorded for the ROIs was compared with that recorded for homologous regions in the contralateral hemisphere by calculating the ipsilateral/contralateral (I/C) ratio. The ratios obtained from brain images were the same as those obtained from quantitative images. We selected bilateral ROIs in the same areas and calculated I/C ratios. All the slices containing each region on the injured side were grouped and compared with those of the intact hemisphere. We examined the differences in cerebral glucose metabolism levels of the bilateral posterior striate cortex, anterior striate cortex, extrastriate cortex and thalamus between each patients with hemianopia group (all patients, improved patients, and unchanged patients) and healthy group. Because each of these patient groups had fewer than 20 patients, the difference in I/C ratios between the each patient gruop and the control group was tested using the Mann–Whitney U test with Bonferroni’s correction for multiple comparisons (P < .0025 = 0.01/4).
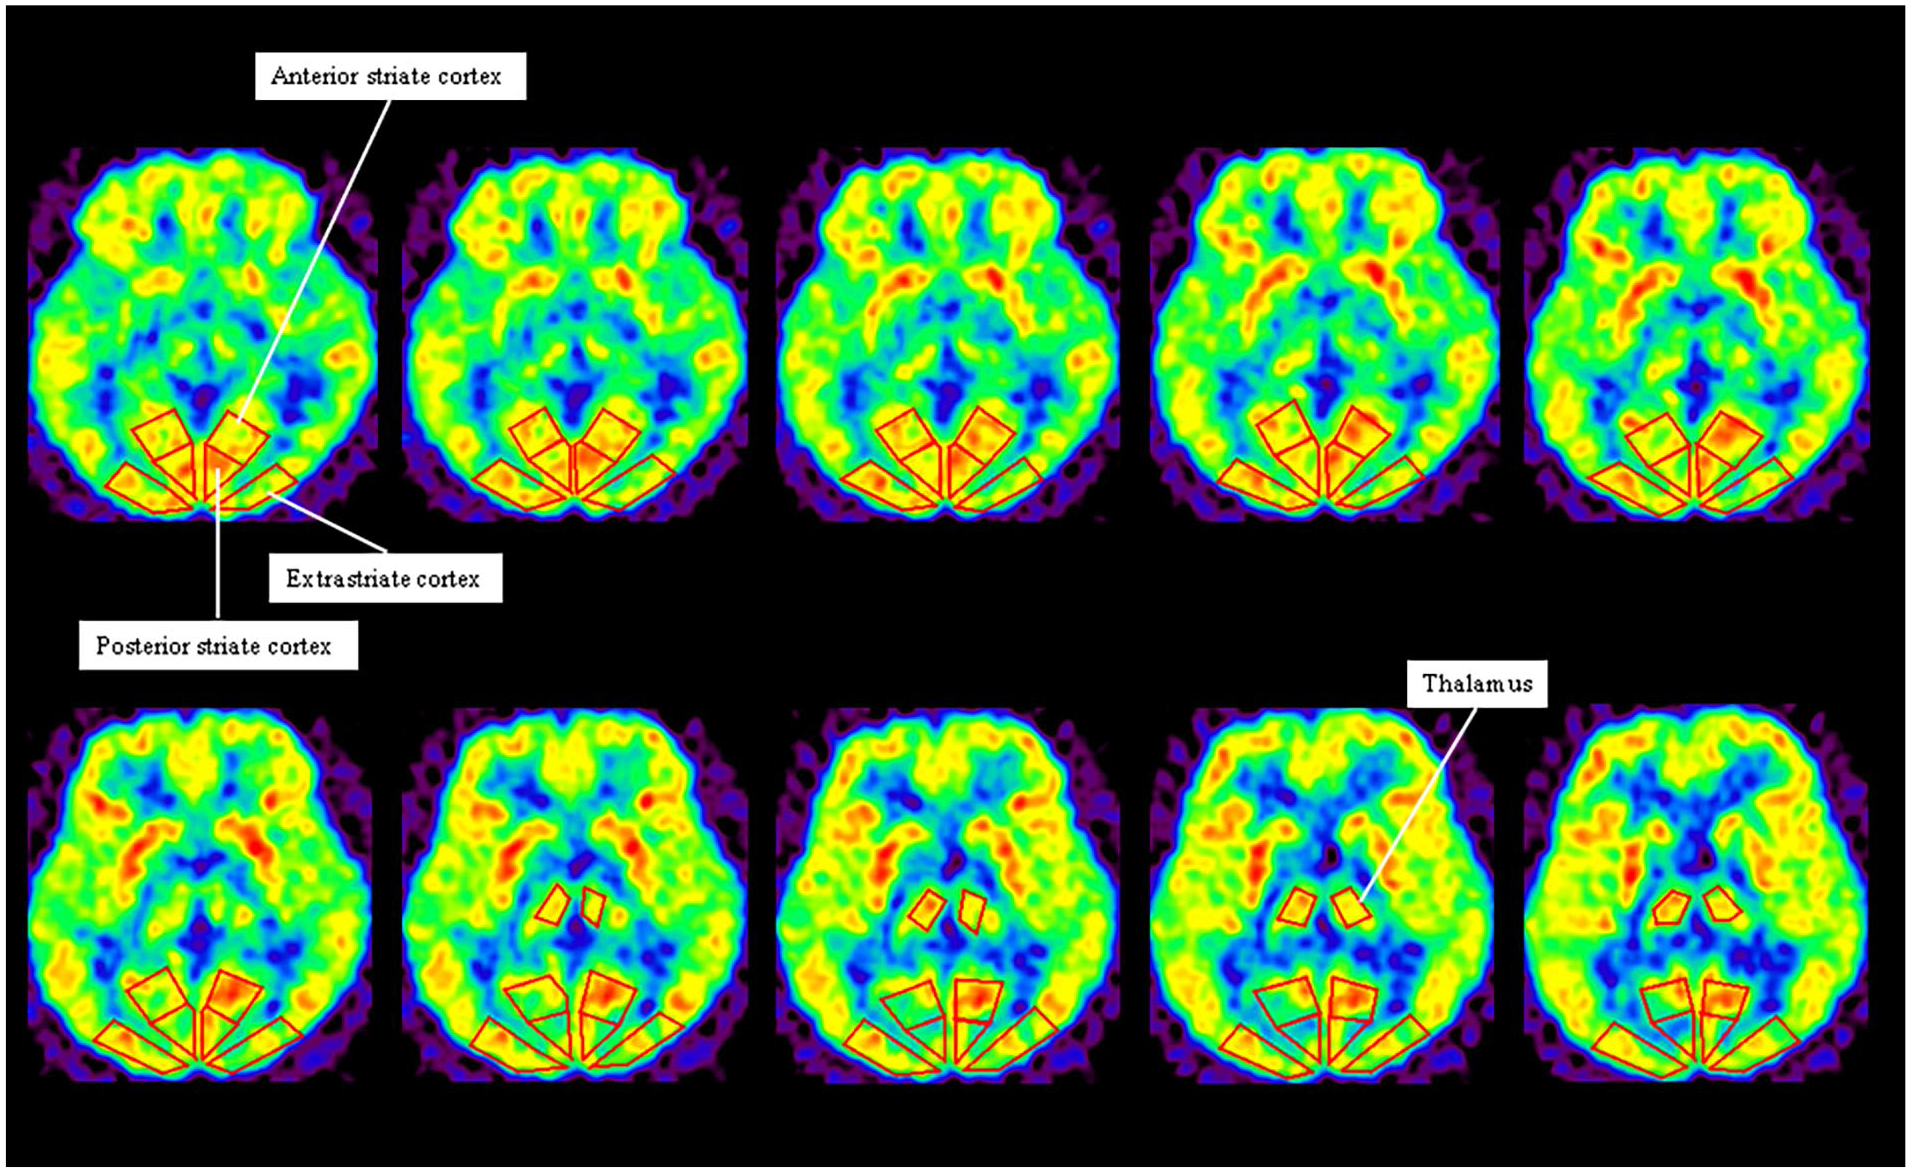
Definition of regions of interest (ROIs). Bilateral ROIs are placed in the posterior striate cortex, anterior striate cortex, extrastriate cortex, and thalamus. We defined the ROIs for each region on the axial slices plane with a slice thickness of 1.3 mm parallel to the anterior commissure-posterior commissure (AC-PC) line. ROIs for the striate cortex were set at a total of 10 slices, 6 slices below and 3 slices above, using the slice containing the posterior end of calcarine sulcus as the reference plane. The ROIs of the extrastriate cortex were defined in the area outside the striate cortex in the same 10 slices as the striate cortex. We defined areas of extrastriate cortex to include areas V2, V3, V4, and MT. We defined the ROIs for the thalamus in a total of 4 slices, 3 slices above the slice containing the rear end of the calcarine sulcus.
Moreover, we examined the correlation between I/C ratio of each area and time since stroke at FDG-PET scanning.
Data Availability
All data used for the analysis are presented in 3 tables and 3 figures. Data will be shared after obtaining ethical approval, if requested by other investigators to replicate the results.
Results
We observed visual field improvements in 9 of the 19 patients with hemianopia (spontaneous improvement group). The I/C ratio for cerebral glucose metabolism in the posterior striate cortex was high (>0.750) in patients 1 to 8, and visual field improvement was observed in 6 patients (patient 3-8), and macular sparing was observed in 2 patients (patient 1 and 2; Tables 2 and 3). The I/C ratio for cerebral glucose metabolism in the anterior striate cortex was high (>0.830) in 7 patients (patient 1-6 and 9), and the peripheral visual field of these patients improved (Tables 2 and 3). The I/C ratio in the entire striate cortex was low in patients 10 to 18, and their visual fields did not change (unchanged group).
Area of Visual Field in Patients With Hemianopia at the Start of Observation and 1 Year After Onset.
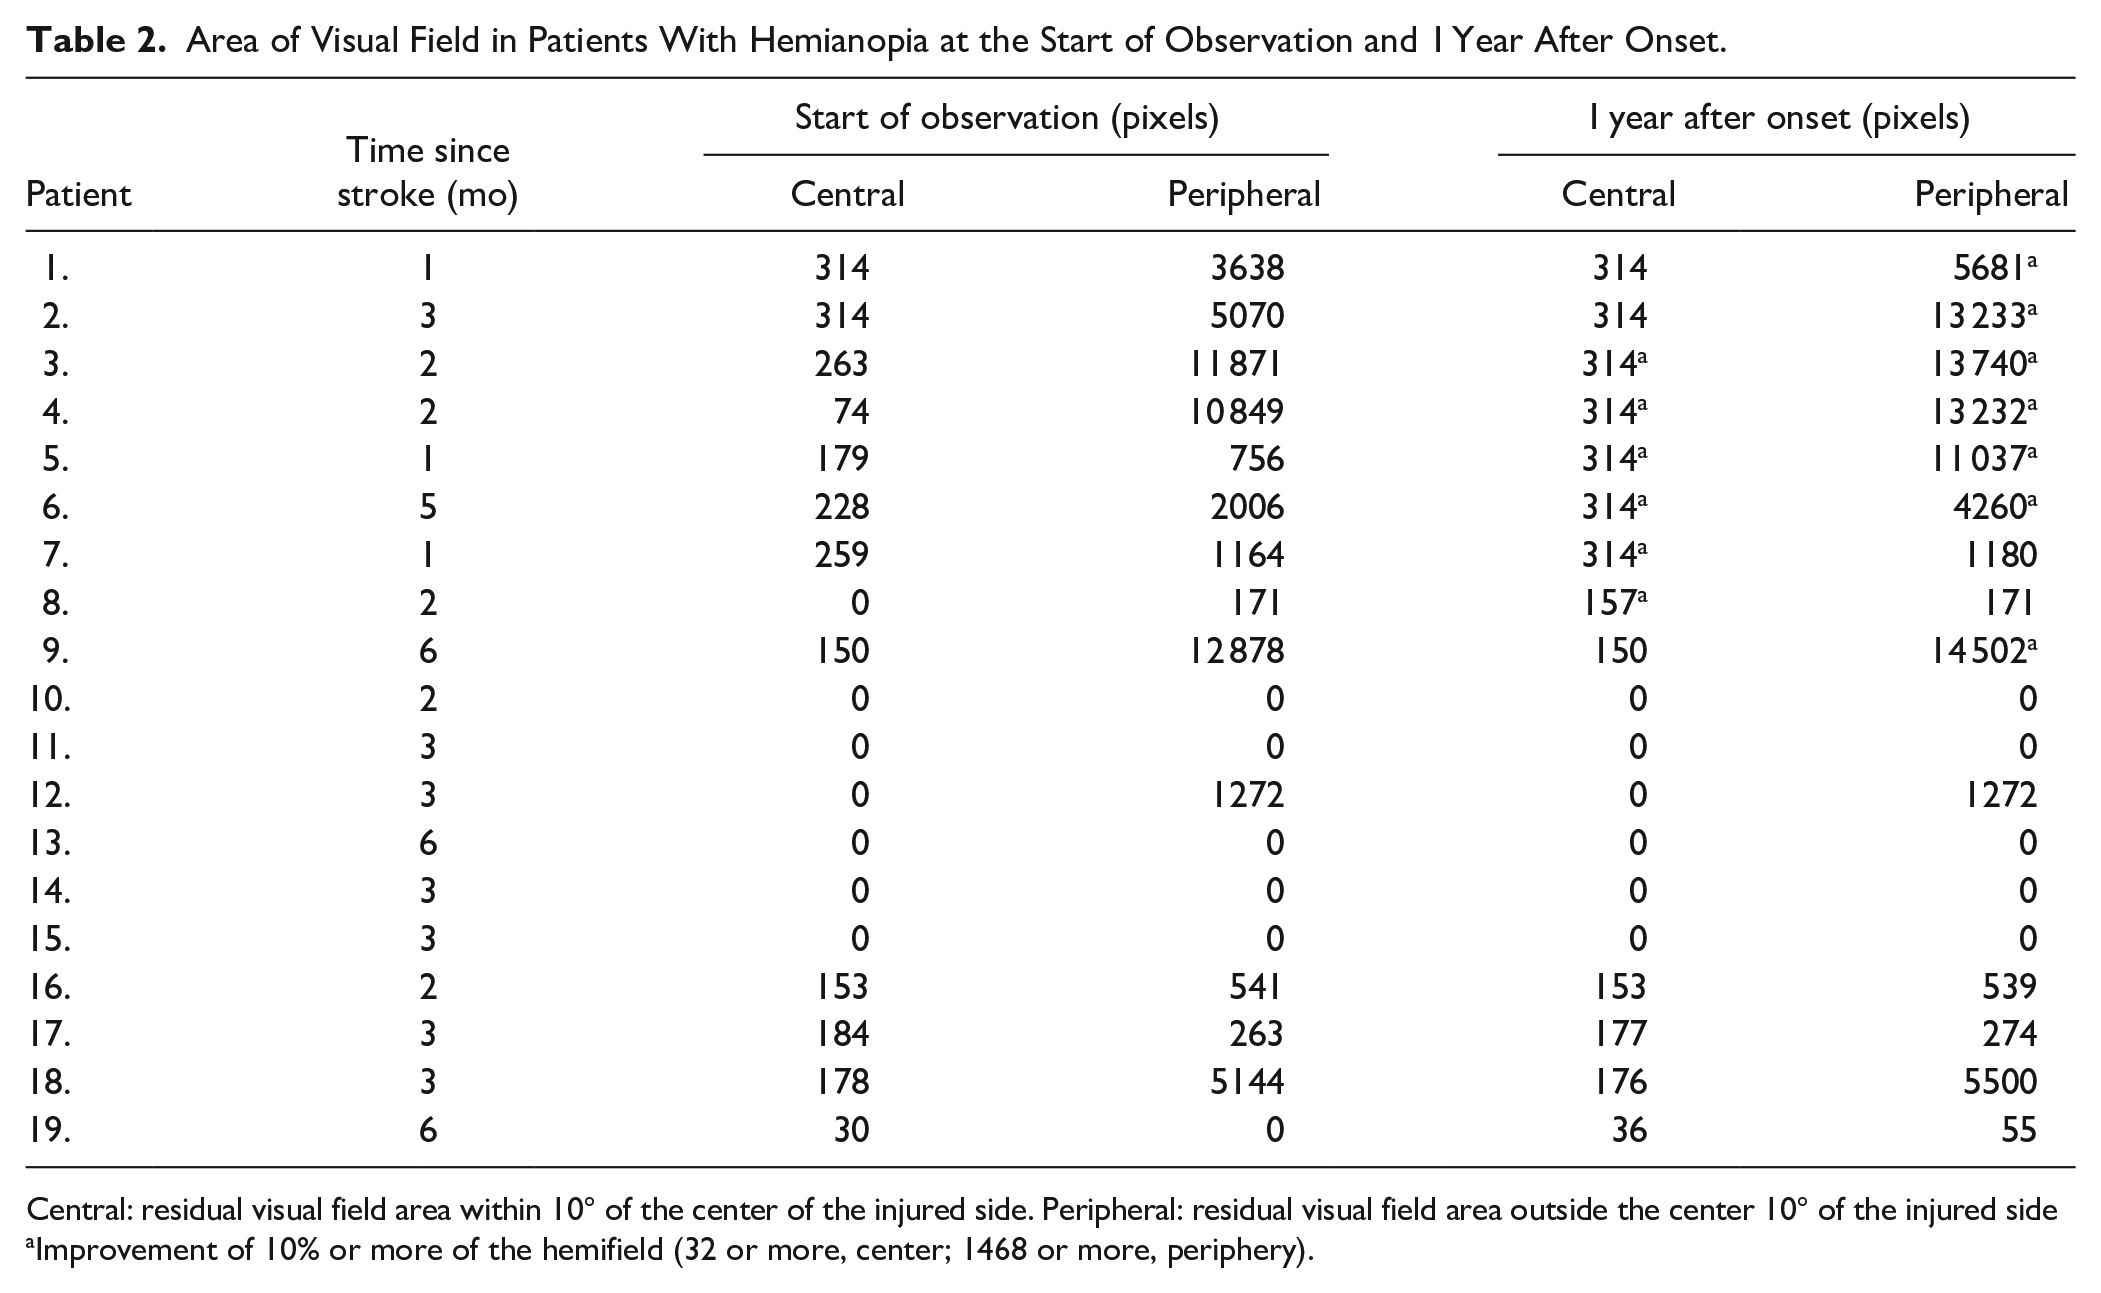
Central: residual visual field area within 10° of the center of the injured side. Peripheral: residual visual field area outside the center 10° of the injured side
Improvement of 10% or more of the hemifield (32 or more, center; 1468 or more, periphery).
Ipsilateral/Contralateral (I/C) Ratio of Glucose Metabolism in Each Area of Patients With Hemianopia.
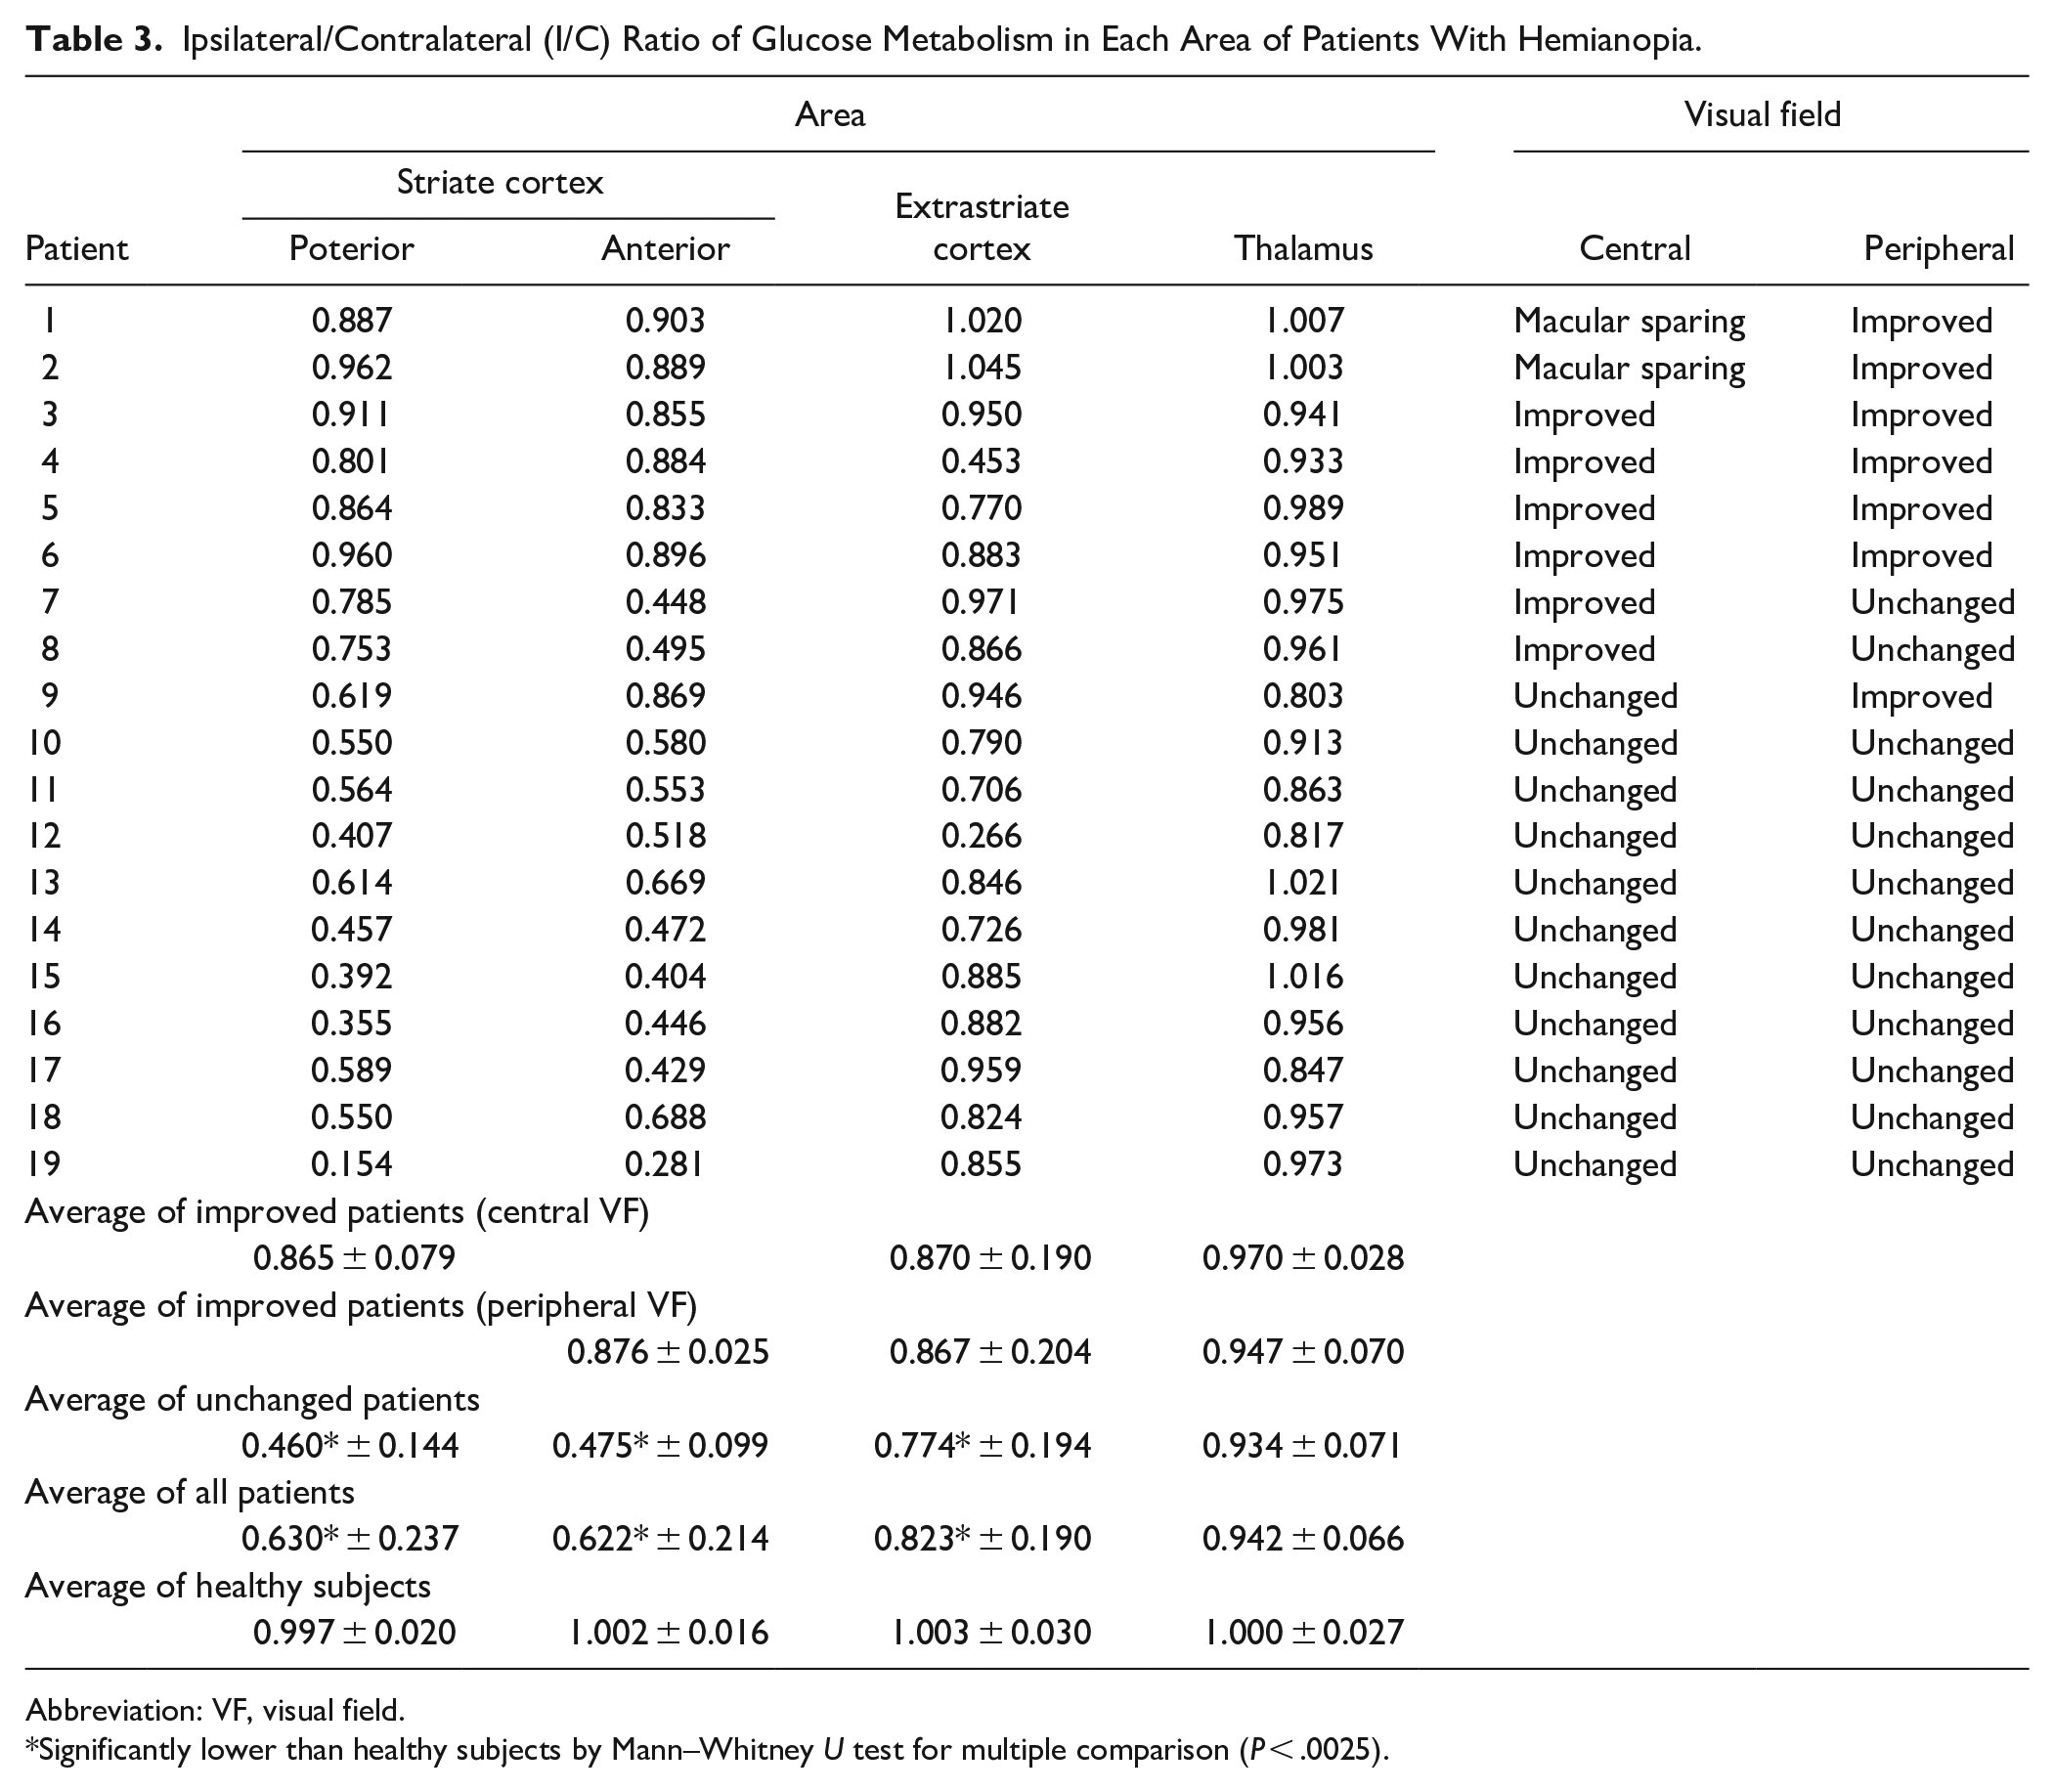
Abbreviation: VF, visual field.
Significantly lower than healthy subjects by Mann–Whitney U test for multiple comparison (P < .0025).
In the group comparison, the I/C ratio for the cerebral glucose metabolism in all areas decreased significantly in patients with hemianopia compared to that in healthy subjects (posterior striate cortex, P = .00008; anterior striate cortex, P = .00004; extrastriate cortex, P = .01) (Table 3, Figure 3). In the direct subgroup comparison, the I/C ratios in the posterior and anterior striate cortices were significantly lower in the unchanged group (posterior, P = .0003; anterior, P = .00002) than in the spontaneous improvement group; however, there were no differences between these subgroups in the I/C ratios of the extrastriate cortex and cuneus.
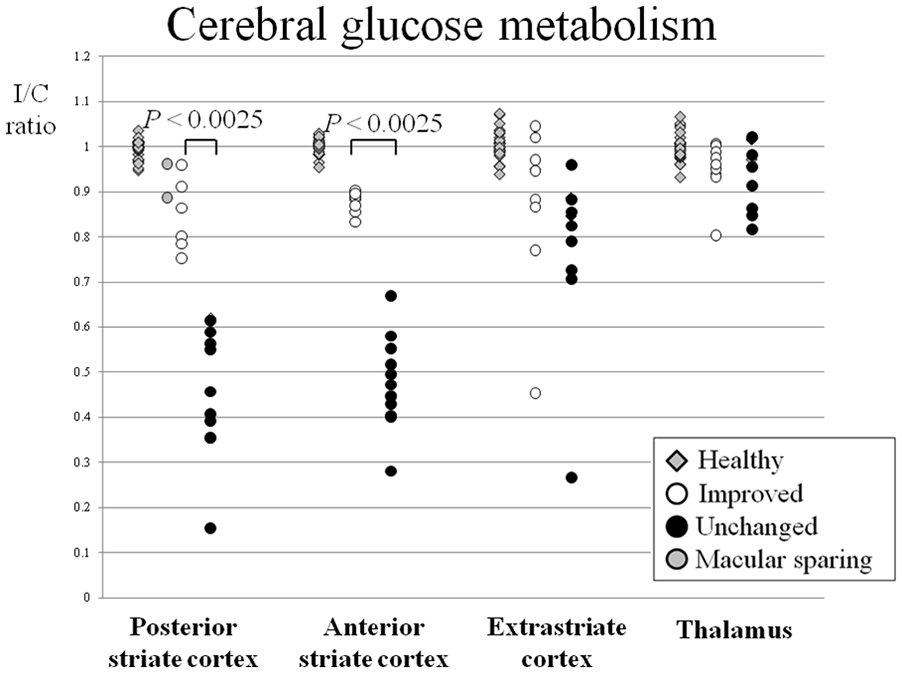
Ipsilateral/contralateral (I/C) ratio for cerebral glucose metabolism in each brain region of hemianopia patients. The I/C ratio of healthy subjects (gray squares, n = 34) and 19 patients with hemianopia are shown. The central visual field has recovered in 8 patients (including macular sparing), and their I/C ratio in the posterior striate cortex is high (>0.750) (white circle). The peripheral visual field has recovered in 7 patients, and their I/C ratio in the anterior striate cortex is high (>0.830) (white circle). Compared to recovered patients, the I/C ratio for cerebral glucose metabolism in both posterior and anterior striate cortices is lower in unchanged patients (filled circle) (P < .0025).
In an analysis involving all patients with hemianopia, there was no significant correlation with time from onset at any area (posterior striate cortex, rs = –.33 [P = .16]; anterior striate cortex, rs = .22 [P = .37]; extrastriate cortex, rs = .04 [P = .86]; thalamus, rs = –.19 [P = .79]). We thought that there is variation in the degree of striate cortex damage in unchanged patients, and that this affects glucose metabolism in the striate cortex. We also examined the correlation between I/C ratio of the posterior and anterior striate cortex and time from onset in improved patients. Although not significant due to the small number of cases, we found moderate correlations between I/C ratio of the posterior and anterior striate cortex and time from onset (posterior striate cortex, rs = .58 [P = .13]; anterior striate cortex, rs = .43 [P = .29].
Discussion
We observed improved central and peripheral visual fields in patients with high glucose metabolism level on the injured side of the posterior and anterior striate cortices. Recovery of vision following stroke-induced homonymous visual field defects is well recognized, although the neurobiological mechanisms involved in spontaneous improvement are controversial and poorly understood.
Therefore, it is important for patients to know the prognosis of their visual field loss. However, estimating the prognosis of the visual field from an early evaluation of glucose metabolism 21 is difficult, because even if neurons survive in the area of the injury, 20 glucose hypometabolism is usually observed in this area because of diaschisis during the early stage. 29 Therefore, early-stage FDG-PET findings may not reflect any actual damage to the area. In our previous study, we attempted to accurately predict the prognosis of spontaneous visual field improvement by estimating residual neurons in the striate cortex using 11C-FMZ-PET and the glucose metabolism level of the injured side in the striate cortex using FDG-PET. 4 Furthermore, we observed that the distribution of glucose metabolism in the striate cortex in patients with hemianopia more than 1 month after onset correlated 11C-FMZ-PET results and confirmed that FDG-PET results alone can predict the prognosis of the visual field. In contrast, previous PET studies have shown glucose hypometabolism in the contralateral striate cortex of patients with hemianopia following an infarction, and increased cerebral glucose metabolism in the striate cortex associated with recovery of the visual field.5,21 We suspected that the glucose metabolism level in the striate cortex reflects both the residual and current visual field functions at that time. Glucose metabolism in the injured striate cortex was restored, with spontaneous improvement in the visual field. 5 Spontaneous visual field improvement may occur when activation of the striate cortex on the injured side exceeds a certain level. 20 Moreover, in Patients 1 and 2, central visual field defects were not observed in the early stages (macular sparing), and the I/C ratio of glucose metabolism in the posterior striate cortex was high. Macular sparing may occur when glucose metabolism in the posterior striate cortex is maintained at a certain level because injury to the posterior striate cortex due to blood flow is maintained by collateral flow. 25 Macular sparing, which maintains the central visual field, may occur immediately after the onset. The major cause of macular sparing is perfusion of the calcarine cortex is by multiple arteries. The occipital pole, which generally corresponds to the macula, receives blood from posterior cerebral artery. 25 However, the calcarine cortex often receives collateral blood flow from the middle cerebral artery and pial branch and remains perfused even after occlusion of the posterior cerebral artery, resulting in macular sparing.25,30-32 In addition, the range of the corresponding striate cortex is large. The central 10° region occupied half of the surface area of the posterior striate cortex. 26 Lesions in the striate cortex do not always produce a complete loss of vision from the appropriate visual field; some central vision usually remains intact 33 owing to the fact that inputs from the center of the retina spread over a large portion of the striate cortex.
Experimental research has shown that, to some extent, the mature central nervous system is capable of self-repair and reorganization after injury. However, the mechanism by which visual field defects improve spontaneously in patients with hemianopia remains unclear.
In the early stages after stroke, functional improvement may be attributed to the resolution of brain edema, absorption of damaged tissue, or reperfusion of the ischemic penumbra.34,35 Secretion of neurotrophic factors, remodeling of neural circuits, restoration of the blood-brain barrier, reduction of inflammatory infiltration and demyelination, and elevation of trophic factors may occur in tissues after infarction.34,35 Furthermore, inorganic phosphate and lactic acid levels increase in the ischemic area after an infarction. Inorganic phosphate is involved in the regulation of amino acid metabolism, protein activation, and cell signaling and is used in the biosynthesis of ATP, nucleic acids, phospholipids, and proteins.34,36
Reorganization phenomena in the brain, along with the improvement of functions after infarction, have been reported and can be classified into 2 types. One is the overactivation of areas that belong to the physiological neural network for a specific task, and the other is the activation of unusual areas that attempt to replace the functions of the damaged tissue. 37 Previous studies have observed cortical reorganization in experimental cerebral infarction models and clinical studies in patients with stroke, which may contribute to the observed spontaneous improvement.38,39 After the initial week of onset, the improvement was presumed to be due to neuronal plasticity and substantial structural reorganization of the remaining intact brain tissue. 40 Liu et al 41 demonstrated that neuronal rewiring on the stroke impaired side of the cervical spinal cord originating from the bilateral cortices improved during the subacute and chronic phases in mice. Additionally, spontaneous motor behavioral improvement after cerebral ischemic stroke is time-dependent and strongly correlates with corticospinal tract axonal remodeling in the spinal cord and pyramidal neuronal reorganization in the cortex. 41 Suzuki et al 42 examined the cerebral response and motor function after middle cerebral artery occlusion using rats and functional MRI. They observed that lesion volume reached its maximum value within 4 days and gradually decreased over 42 days post-infarction. The BOLD signal intensity in the primary somatosensory cortex during electric stimulations of the forepaw and motor function was weak on day 1, but increased gradually thereafter.
Similarly, reorganization occurs after an infarction of the visual cortex. Zepeda et al 43 observed that cortical retinotopic maps were reorganized following ischemic lesions in kittens. They observed the longitudinal development of blood vessel patterns and improvement in response in the visual cortex to the visual stimulus at the lesion site 40 days after lesion development. The plasticity of the functional maps is accompanied by morphological and biochemical modifications in the area surrounding the lesion over time. 44 Based on these observations, we suspect that axonal remodeling in the optic radiation and pyramidal neuronal reorganization may occur on the injured side of the visual cortex in patients with hemianopia.
Limitations of the Study
There are some differences in retinotopy for each case, and in order to reliably identify each visual area, it is necessary to examine the response of each visual area using fMRI with various visual stimuli. 28 In patients in whom the visual pathway (lateral geniculate nucleus, optic radiation, and optic tract) is injured, the method used in this study may not be able to predict visual field prognosis. In the future, it will be necessary to study the prognostic estimation of the visual field in cases in which these sites are injured. However, this method of predicting visual field improvement using PET may not be clinically realistic. DWI/ADC maps and perfusion MRI are more frequently used and more practical for predicting prognosis of visual fields in clinical settings.
Conclusions
The glucose metabolic level on the injured side of the striate cortex can predict spontaneous visual field improvement in patients with hemianopia. The measurement of the cerebral glucose metabolism in the striate cortex is useful for estimating the prognosis of the visual field.
Footnotes
Acknowledgements
The authors thank all the patients and healthy participants who participated in this study.
Author Contributions
Yukihisa Suzuki: Conceptualization; Data curation; Formal analysis; Investigation; Methodology; Project administration; Resources; Software; Visualization; Writing—original draft. Motohiro Kiyosawa: Supervision; Writing—review & editing. Kenji Ishii: Conceptualization; Data curation; Project administration; Supervision; Writing—review & editing.
Declaration of Conflicting Interests
The author(s) declared no potential conflicts of interest with respect to the research, authorship, and/or publication of this article.
Funding
The author(s) received no financial support for the research, authorship, and/or publication of this article.