
Abstract
Background
Motor recovery varies across post-stroke individuals, some of whom require a better rehabilitation strategy. We hypothesized that macrostructural neuroplasticity of the motor control network including the cerebellum might underlie individual differences in motor recovery. Objectives. To gain insight into the macrostructural neuroplasticity after stroke, we examined 52 post-stroke individuals using both the Fugl-Meyer assessment and structural magnetic resonance imaging.
Methods
We performed voxel-based lesion symptom mapping and cross-sectional voxel-based morphometry to correlate the motor scores with the lesion location and the gray matter volume (GMV), respectively. Longitudinal data were available at ~8 and/or 15 weeks after admission from 43 individuals with supratentorial lesions. We performed a longitudinal VBM analysis followed by a multiple regression analysis to correlate between the changes of the motor assessment scores and those of GMV overtime.
Results
We found a cross-sectional correlation of residual motor functioning with GMV in the ipsilesional cerebellum and contralesional parietal cortex. Longitudinally, we found increases in GMV in the ipsilesional supplementary motor area, and the ipsilesional superior and inferior cerebellar zones, along with a GMV decrease in the ipsilesional thalamus. The motor recovery was correlated with the GMV changes in the superior and inferior cerebellar zones. The regaining of upper-limb motor functioning was correlated with the GMV changes of both superior and inferior cerebellum while that of lower-limb motor functioning with the GMV increase of the inferior cerebellum only.
Conclusions
The present findings support the hypothesis that macrostructural cerebellar neuroplasticity is correlated with individual differences in motor recovery after stroke.
Introduction
Post-stroke motor deficits deprive stroke survivors of an active life. Efficient strategies to enhance stroke recovery should be developed to improve the quality of life of stroke survivors. A premise of this important medical challenge includes a proper understanding of the neuroplastic mechanisms underlying stroke recovery.
Multiple factors underlie stroke recovery. The perilesional zones including the ischemic penumbra may gradually regain their functions following shrinkage of the lesions and edema. 1 More recently, we have gained knowledge on reorganization of the neural system (“neuroplasticity”) at the molecular, cellular, and network levels after neural injury.2,3 At the cellular level, neuroplasticity may involve adult neurogenesis, synaptogenesis (involving pruning), angiogenesis, oligodendrogenesis, and astrogliosis modulation. 4 In clinical settings, neuroplasticity can be probed with noninvasive neurotechnology such as transcranial magnetic stimulation, 5 electroencephalography, 6 and magnetic resonance imaging (MRI).
Neuroplasticity is induced by behavioral experiences in either an adaptive or maladaptive manner. 7 The adaptive post-stroke neuroplasticity likely involves successful motor relearning enhanced by rehabilitation.8,9 In the healthy brain, adaptive motor learning recruits the “motor control networks,” which include the primary motor and premotor cortices, supplementary motor areas (SMA), parietal cortex, basal ganglia, thalamus, and cerebellum. 10 Changes in gray matter volumes (GMV) on MRI have been used as a macrostructural measure of learning-induced neuroplasticity in healthy people who underwent motor or cognitive training over a few months.11-14 The macrostructural neuroplasticity associated with motor learning may in part reflect the formation of the “internal models” 15 underpinning motor learning.
In stroke survivors, both functional16,17 and structural18-24 MRI studies have revealed neuroplastic changes in the motor control networks. For example, voxel-based morphometry (VBM) studies (n = 10-28) have reported both decreases and increases in GMV typically between acute (~a week after the onset) and subacute stages (several months) in patients with hemiparesis.18-22 Decreased GMV was identified in the ipsilesional cortical areas,18-22 corresponding to “post-stroke cortical atrophy,” and in the contralesional cerebellum, 22 corresponding to “crossed cerebellar atrophy.” 25 By contrast, GMV increases, which may underpin the adaptive neuroplasticity leading to motor recovery, are only inconsistently described in the premotor cortex and SMA,19,20 cognitive regions,18,21,22 and subcortical nuclei, 20 probably because of limited sample sizes in those studies.
Here, to advance our understanding of post-stroke motor recovery, we analyzed structural MRI data obtained from subacute stroke patients. We did not rigidly specify the type of stroke for inclusion because of 2 reasons: to recruit a sufficiently large number of subacute stroke patients at a single hospital and to obtain a sufficiently large interindividual variability in motor deficits and recovery courses. We hypothesized that motor control networks including the cerebellum might show macrostructural neuroplasticity induced by motor re-learning after stroke. A cross-sectional data analysis revealed the ipsilesional cerebellum as the potential substrates supporting residual motor functioning after stroke. In a longitudinal data analysis, we hence paid particular attention to testing the macrostructural neuroplasticity in the ipsilesional cerebellum, given its role in motor learning 15 among other motor and non-motor functions. We tested correlational relationship between the degree of motor recovery correlated with the level of motor recovery as indexed by the Fugl-Meyer assessment (FMA) and GMV changes in the brain regions (including the cerebellum) that showed macrostructural neuroplasticity after stroke.
Methods
Participants
Sixty-one patients with stroke at a subacute stage agreed to participate in this study upon admission to the Tokyo Metropolitan Rehabilitation Hospital. All participants provided written informed consent according to the study protocol, which was approved by the local ethics committee (Tokyo Metropolitan Rehabilitation Hospital). Inclusion criteria were: (1) clinically first-ever unilateral ischemic or hemorrhagic stroke (subarachnoid hemorrhage excluded), (2) transferred to the hospital for rehabilitation within 2 months after onset, and (3) no obvious cognitive impairment. Exclusion criteria were: (1) contraindication for physiotherapy, (2) contraindication for MRI, and (3) inability to provide a consent because of a cause other than aphasia. Research data were available from 54 post-stroke patients (mean age 62 ± 12 years, range 41-83 years) out of 61 patients (Table 1). The primary symptom at admission was right hemiparesis (n = 18), left hemiparesis (n = 28), right sensory disturbance (n = 1), left sensory disturbance (n = 1), right ataxia (n = 2), left ataxia (n = 1), dysphagia (n = 1), aphasia (n = 1), and left visual disturbance (n = 1).
Symptoms and the Sites of Lesions.
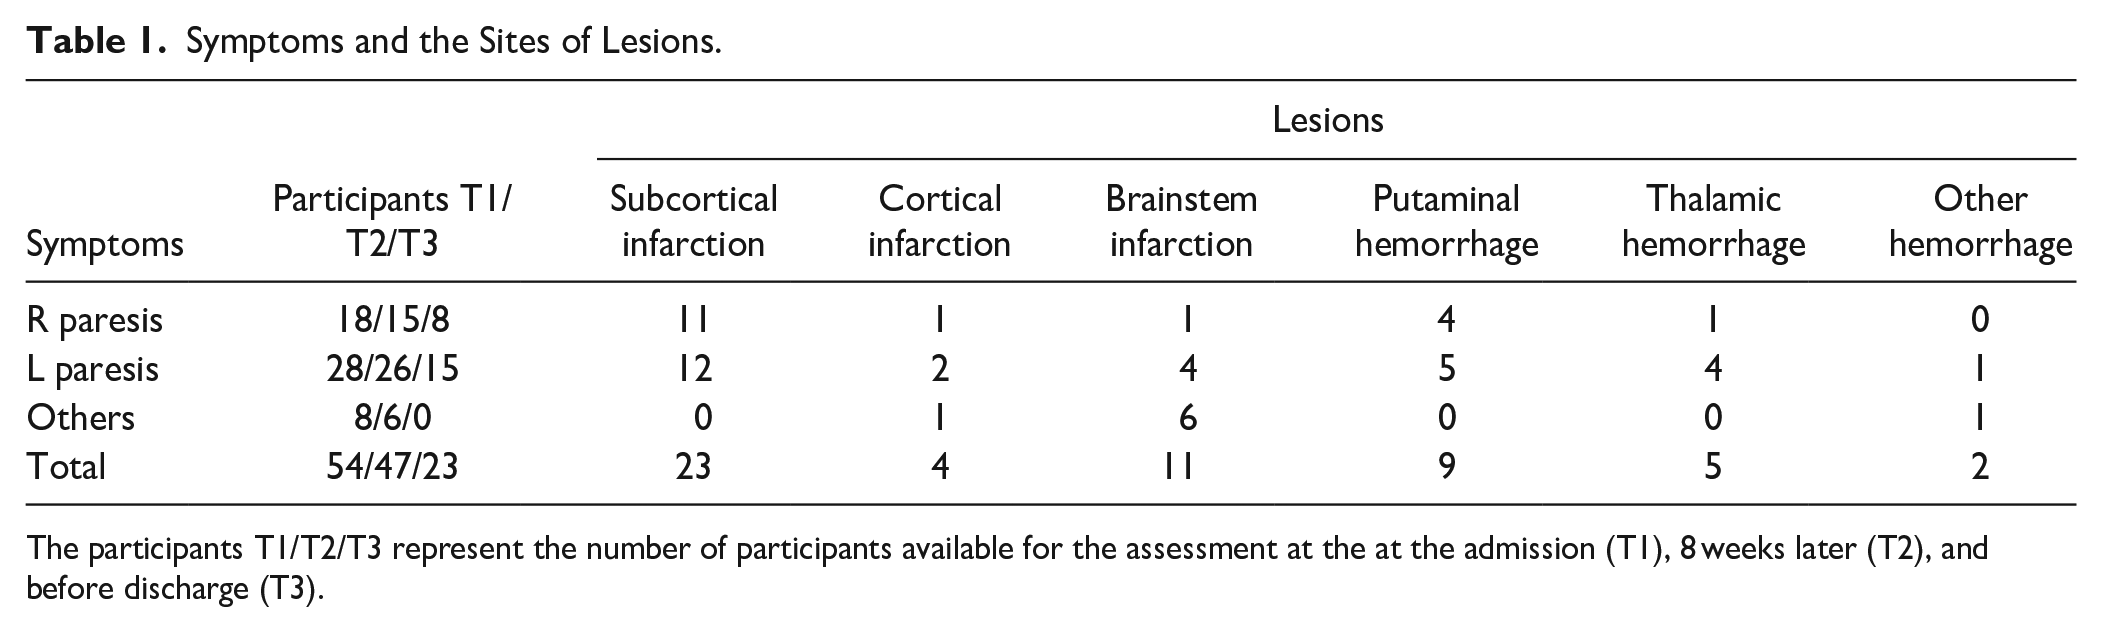
The participants T1/T2/T3 represent the number of participants available for the assessment at the at the admission (T1), 8 weeks later (T2), and before discharge (T3).
Study Design
We designed a 16-week longitudinal study, during which post-stroke patients underwent 3 assessments after admission to a single rehabilitation hospital. A rehabilitation program was administered to all patients. The content of the program was tailored to each patient’s condition upon the agreement of the in-charge rehabilitation team. Each patient underwent the tailor-made rehabilitation program for 2 or 3 hours a day. When possible, the assessments were performed at admission (T1), ~8 weeks later (T2), and before discharge (T3). Fifty-two participants completed both full motor assessment and MRI at least once, providing data for a cross-sectional VBM analysis. We also used a voxel-based lesion-symptom mapping (VLSM) analysis 26 to characterize the distribution of brain damage in the enrolled patients. The second MRI (~8 weeks later) was available from 46 participants while the third MRI was available from 25 participants before discharge (Figure 1). The cross-sectional VMB analysis identified the ipsilateral cerebellum, among the nodes of the motor control networks, as the correlates supporting residual motor functioning after stroke. We considered that the inclusion of data from patients with brainstem or cerebellar lesions would make the interpretation of the findings difficult in the longitudinal data analysis. We thus limited the longitudinal VBM analysis to patients with supratentorial regions (n = 43). Longitudinal assessment of both GMV and motor deficit was available from 41 patients.
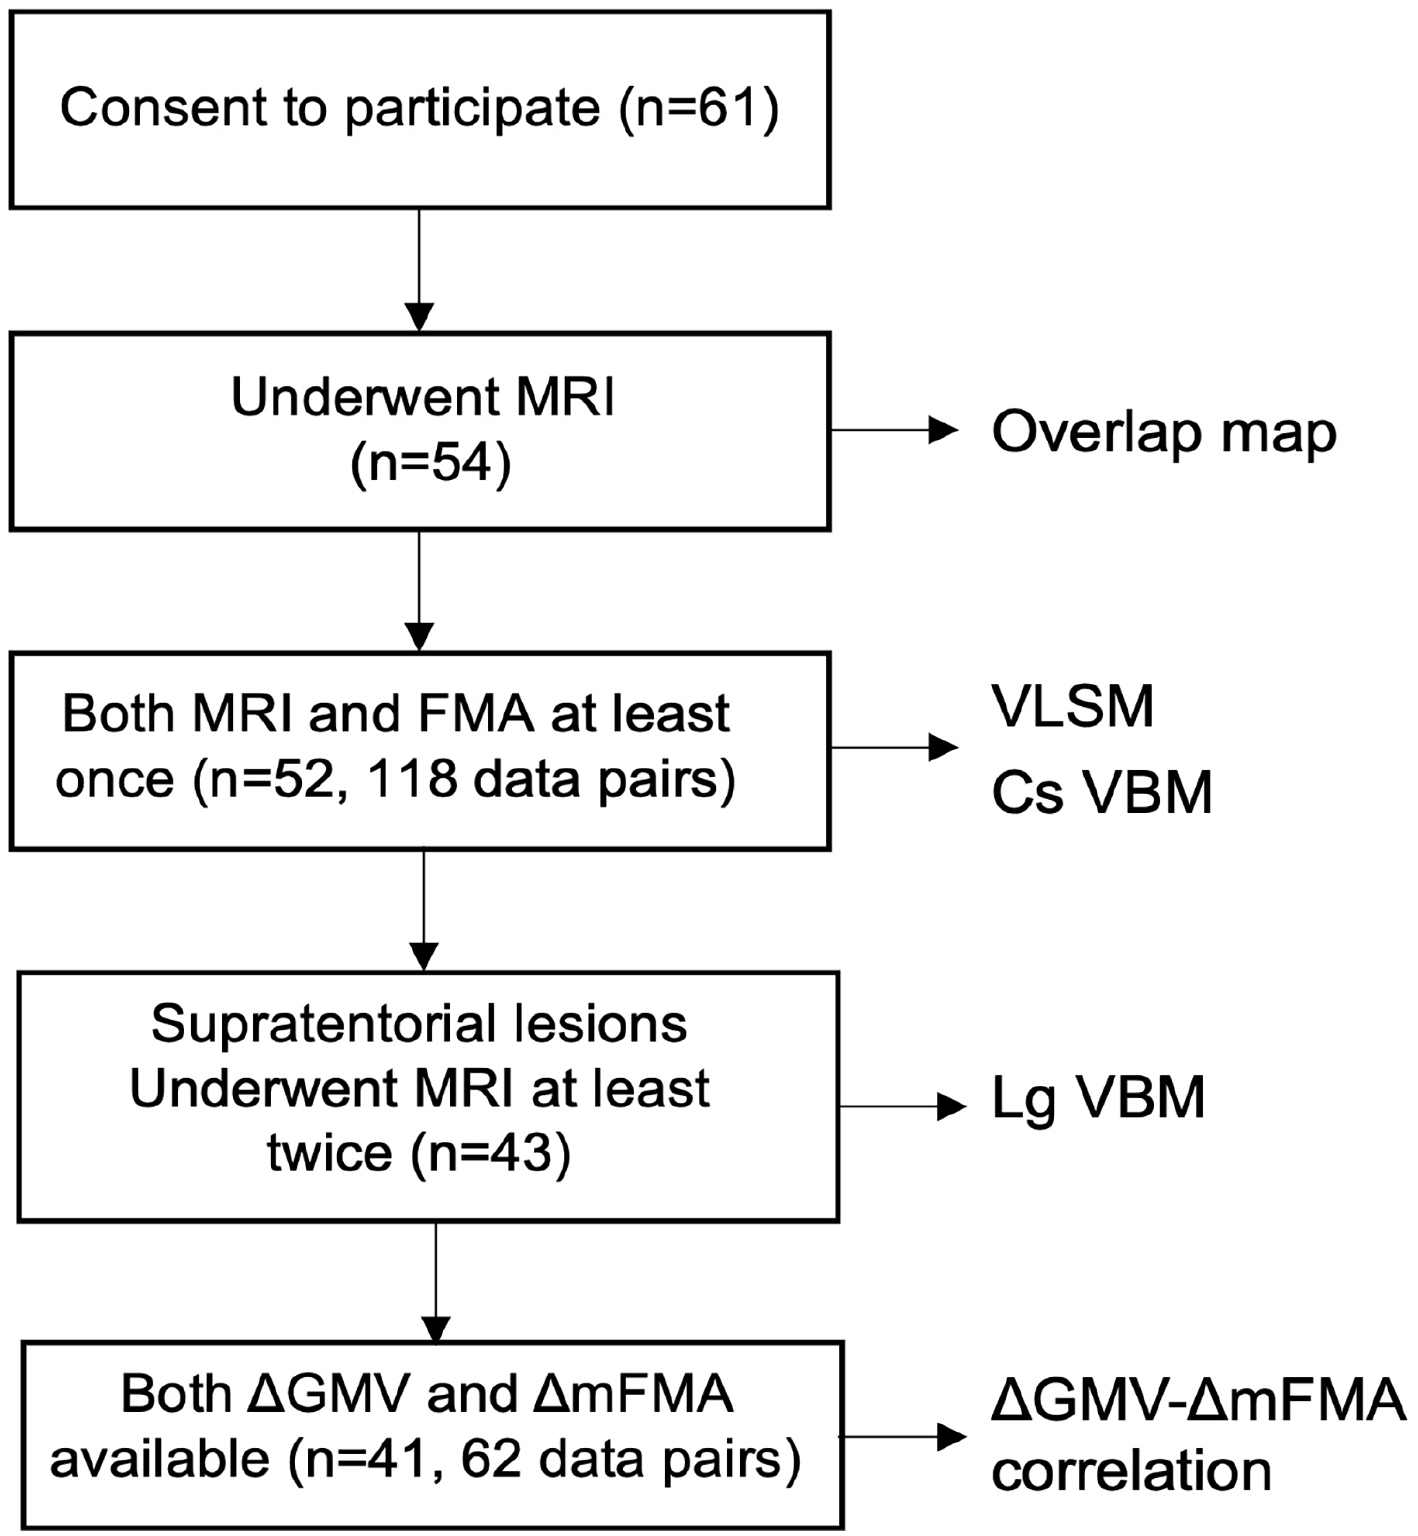
The flow of analyses. A total of 52 patients completed the assessment with both clinical batteries and MRI at least once. We limited the longitudinal VBM analysis to patients with supratentorial regions (n = 43). Longitudinal assessment of both GMV and motor deficit was available from 41 patients (62 data pairs).
Motor Assessment
As a measure of motor recovery, we used the FMA, which is a composite scale of stroke-related impairment with 5 domains: motor functioning (upper and lower limbs), sensory functioning, balance, range of joint motion, and pain. In this study, we mainly used the motor domain of the FMA (mFMA; maximum score = 100 points), which combined the score of the upper limb section (maximum score = 66 points) and lower limb section (maximum score = 34 points). We also analyzed the sensory FMA score (maximum score = 24 points) to supplement the findings. The FMA score was obtained by in-charge physicians who are specialized in rehabilitation medicine.
MRI Acquisition
MRI was conducted on a 3-Tesla scanner (Discovery 750 W, GE Healthcare, USA) equipped with a 24-channel head receiver coil. Three-dimensional T1-weighted (3D-T1W) structural MRI was obtained with a time-of-flight spoiled gradient echo sequence (repetition time = 7.66 ms, echo time = 3.10 ms, flip angle = 12°, and voxel size = 1.0 × 1.0 × 1.2 mm3).
MRI Preprocessing
SPM12 (http://www.fil.ion.ucl.ac.uk/spm) implemented on MATLAB (Mathworks, Inc., Natick, MA, USA) was used for MRI preprocessing. Because of marked differences in the locations and image properties of the lesions, the lesion masks were delineated manually by a neurologist with expertise in neuroimaging (TH), using MRIcron (https://www.nitrc.org/projects/mricron). The region masks were delineated slice-by-slice on 3D-T1W MRI and concatenated into a 3D volume. The lesion masks were used to create a lesion overlap map as a summary of the lesion location (Figure 2A). The lesion masks also enabled the use of cost-function masking in the spatial normalization process to the Montreal Neurological Institute space, 27 using the Clinical Toolbox (https://www.nitrc.org/projects/clinicaltbx/). The spatially normalized images were flipped along the anterior-posterior axis, so that the supratentorial lesion side was on the left side of the brain in all cases.
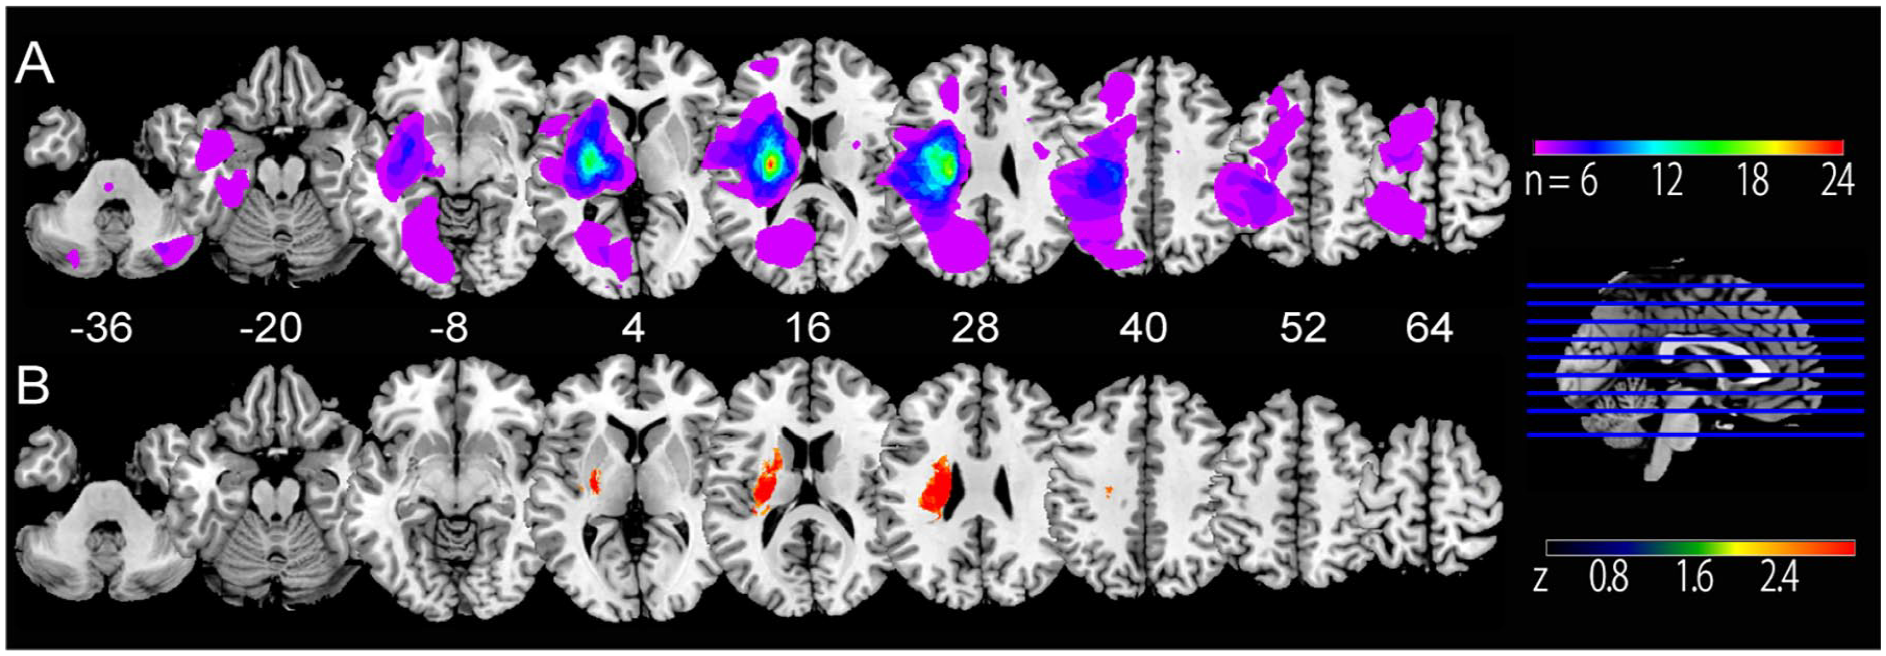
Lesion overlap map and VLSM. (A) The colored region indicates the overlap of lesions across the patients. (B) VLSM. The colored areas indicate the lesions correlated with the level of motor impairment. The lesions are flipped to locate the supratentorial lesions to the left side.
Voxel-Based Lesion-Symptom Mapping
For VLSM, we included the datasets in which both structural MRI and mFMA were available at least once at the same timepoint (52 patients). The search volume was defined as areas with >5% overlap across the participants (see Figure 2A). In each voxel, VLSM tested the effects of having a lesion and those having no lesion on mFMA. Statistical inference was based on the Brunner–Munzel rank order with 1000 permutations (P < .05 with multiple comparisons within the search volume), using the non-parametric mapping toolbox in MRIcron.
Cross-Sectional VBM Analysis
For the cross-sectional VBM analysis, we examined a correlation between GMV and the level of motor impairment. To this end, we included the datasets for which both structural MRI and mFMA were available at least once. With this criterion, 118 data sets from the 52 patients were included. The analysis was performed using the computational anatomy toolbox (CAT12) and SPM12. The cost-function masking-normalized T1W MRI was segmented into GM, white matter (WM), cerebrospinal fluid, and non-brain voxels. We then used diffeomorphic anatomical registration using exponentiated Lie algebra (DARTEL) to create a study-specific GM template. The GM from each patient was further normalized to the study-specific template. The normalized GM image had a voxel size of 1.5 × 1.5 × 1.5 mm3. After spatial smoothing with a Gaussian kernel of 8-mm full width at half maximum, a generalized linear model (GLM) analysis was performed, with patients treated as a between-subject variable. In this cross-sectional analysis, mFMA was treated as a covariate of interest whereas age and total intracranial volume were considered covariates of no interest. Sphericity correction was performed to deal with dependency across the times. The correlation between GMV and mFMA was tested at P < .05 corrected for multiple comparisons.
Longitudinal VBM Analysis
To gain deeper insight into the findings from the cross-sectional analysis (see Results section), we studied the patients with supratentorial lesions who underwent MRI at least twice. From 43 patients who met these criteria, the data from T1 (n = 43), T2 (n = 41), and T3 (n = 24) were entered into a whole-brain generalized linear model analysis, treating participants as a between-subject variable and the times (T1, T2, and T3) as a within-subject variable. Age, total intracranial volume, and the stroke type (infarction or hemorrhage) were included in the design matrix as covariates. Sphericity correction was performed. Changes in GMV across the times were tested with F-statistics at P < .05 corrected for multiple comparisons.
Correlation Between Motor Recovery and Brain Structural Changes
To examine the temporal profile of GM changes overtime, GMV values were retrieved from each of the identified clusters in the longitudinal VBM analysis. A multiple regression model with the ordinary least square was then used to test whether the difference in GMV between the time points (ΔGMV) accounted for the corresponding difference in mFMA (ΔmFMA) as a dependent variable, using the python statsmodels. The explanatory variables included the age and the stroke type (infarction or hemorrhage) in addition to the ΔGMV. We also ran multiple regression analyses using the same set of explanatory variables and ΔmFMA of the upper limb and lower limb separately as a dependent variable. The correlation was also tested for the ΔFMA sensory scale. The variance inflation factor was between 1 and 2 in all the explanatory variables, excluding problematic collinearities. The model fit was assessed using the adjusted R2, F-statistics, and Akaike and Bayesian Information Criteria (AIC and BIC, respectively). The AIC and BIC provide metrices to compare across different models to infer which model fits better (no thresholding value). The significance of the parameter estimates (β) was assessed using 1-sample t-tests for each explanatory variable. For the multiple regression analysis, we used 62 data pairs from 41 patients because ΔmFMA was not available from 2 patients. To visualize the association of ΔmFMA with ΔGMV in the areas where we found significant association in the first-round regression analyses, we computed the residuals after removing the effects of other regressors. This second-round multiple regression analyses yielded ΔGMV corrected for the effects of non-interest for each plot (corrected ΔGMV). The ΔmFMA (total, upper limb, or lower limb) was plotted against the corrected ΔGMV for each region.
Results
Motor Assessment
The mFMA was 62.3 ± 29.2 (mean ± standard deviation) at T1 (41 ± 15 days from stroke onset), 70.9 ± 27.0 at T2 (55 ± 6 days from T1), and 65.6 ± 27.7 at T3 (109 ± 22 days from T1). The upper-limb mFMA was 38.5 ± 23.9 at T1, 43.2 ± 23.0 at T2, and 38.9 ± 22.4 at T3 and lower-limb mFMA was 23.8 ± 7.8 at T1, 27.8 ± 6.0 at T2, and 26.7 ± 6.6 at T3.
Lesion Overlap Map and VLSM
The stroke lesions varied across the participants but were most consistently located in the basal ganglia, thalamus, and WM involving the internal capsule, corona radiata, and centrum semiovale (Figure 2A). In the VSLM analysis, mFMA was correlated with WM lesions involving the internal capsule and the corona radiata (Figure 2B).
Cross-Sectional VBM
In the cross-sectional VBM, mFMA was correlated with GMV in the ipsilesional cerebellum and the contralesional parietal cortex (Figure 3, Table 2A).
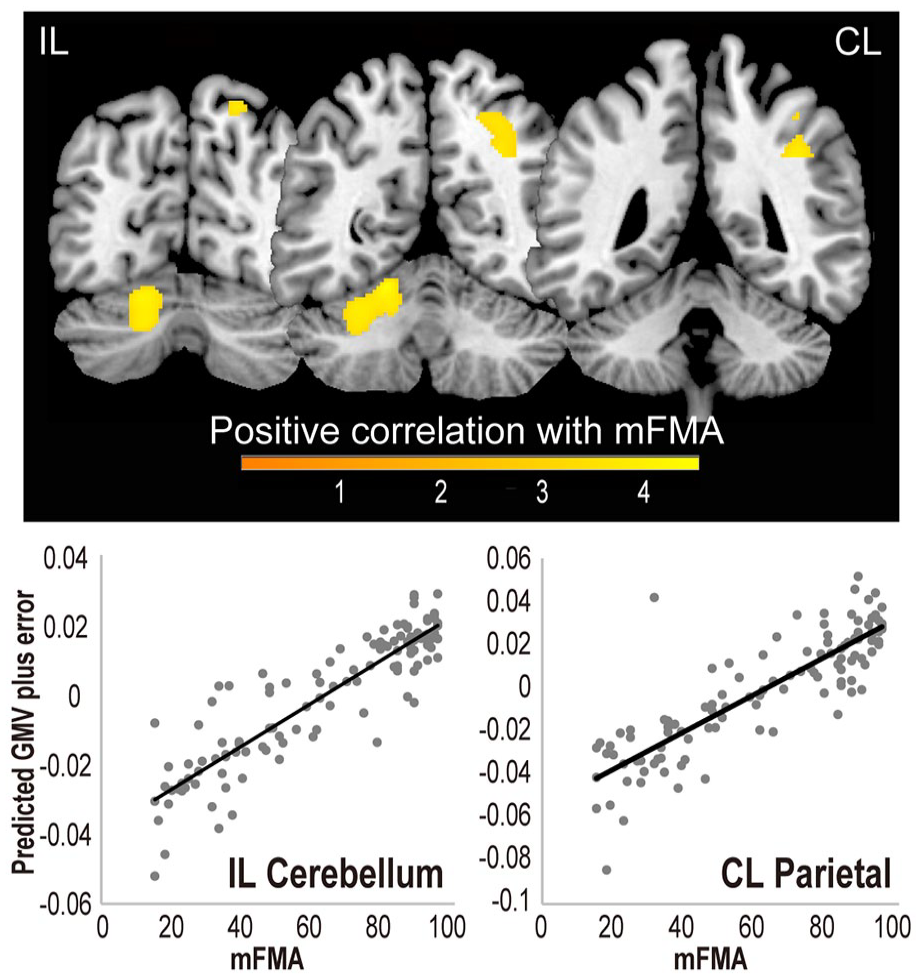
Cross-sectional voxel-based morphometry (VBM) analysis. The warm colored areas indicate regions where gray matter volume (GMV) was correlated with residual motor ability (family-wise error corrected P < .05). The superior cerebellar region is on the ipsilesional side (IL), while the parietal region is on the contralesional side (CL). The color bar represents the t-value. Below, the GMV-derived parameters retrieved from the peak voxels of the IL cerebellum and CL parietal cortex are plotted against the mFMA. Gray dots represent the SPM predicted fitted responses plus errors and the black lines regression lines.
Voxel-Based Morphometry (VBM) Analysis.
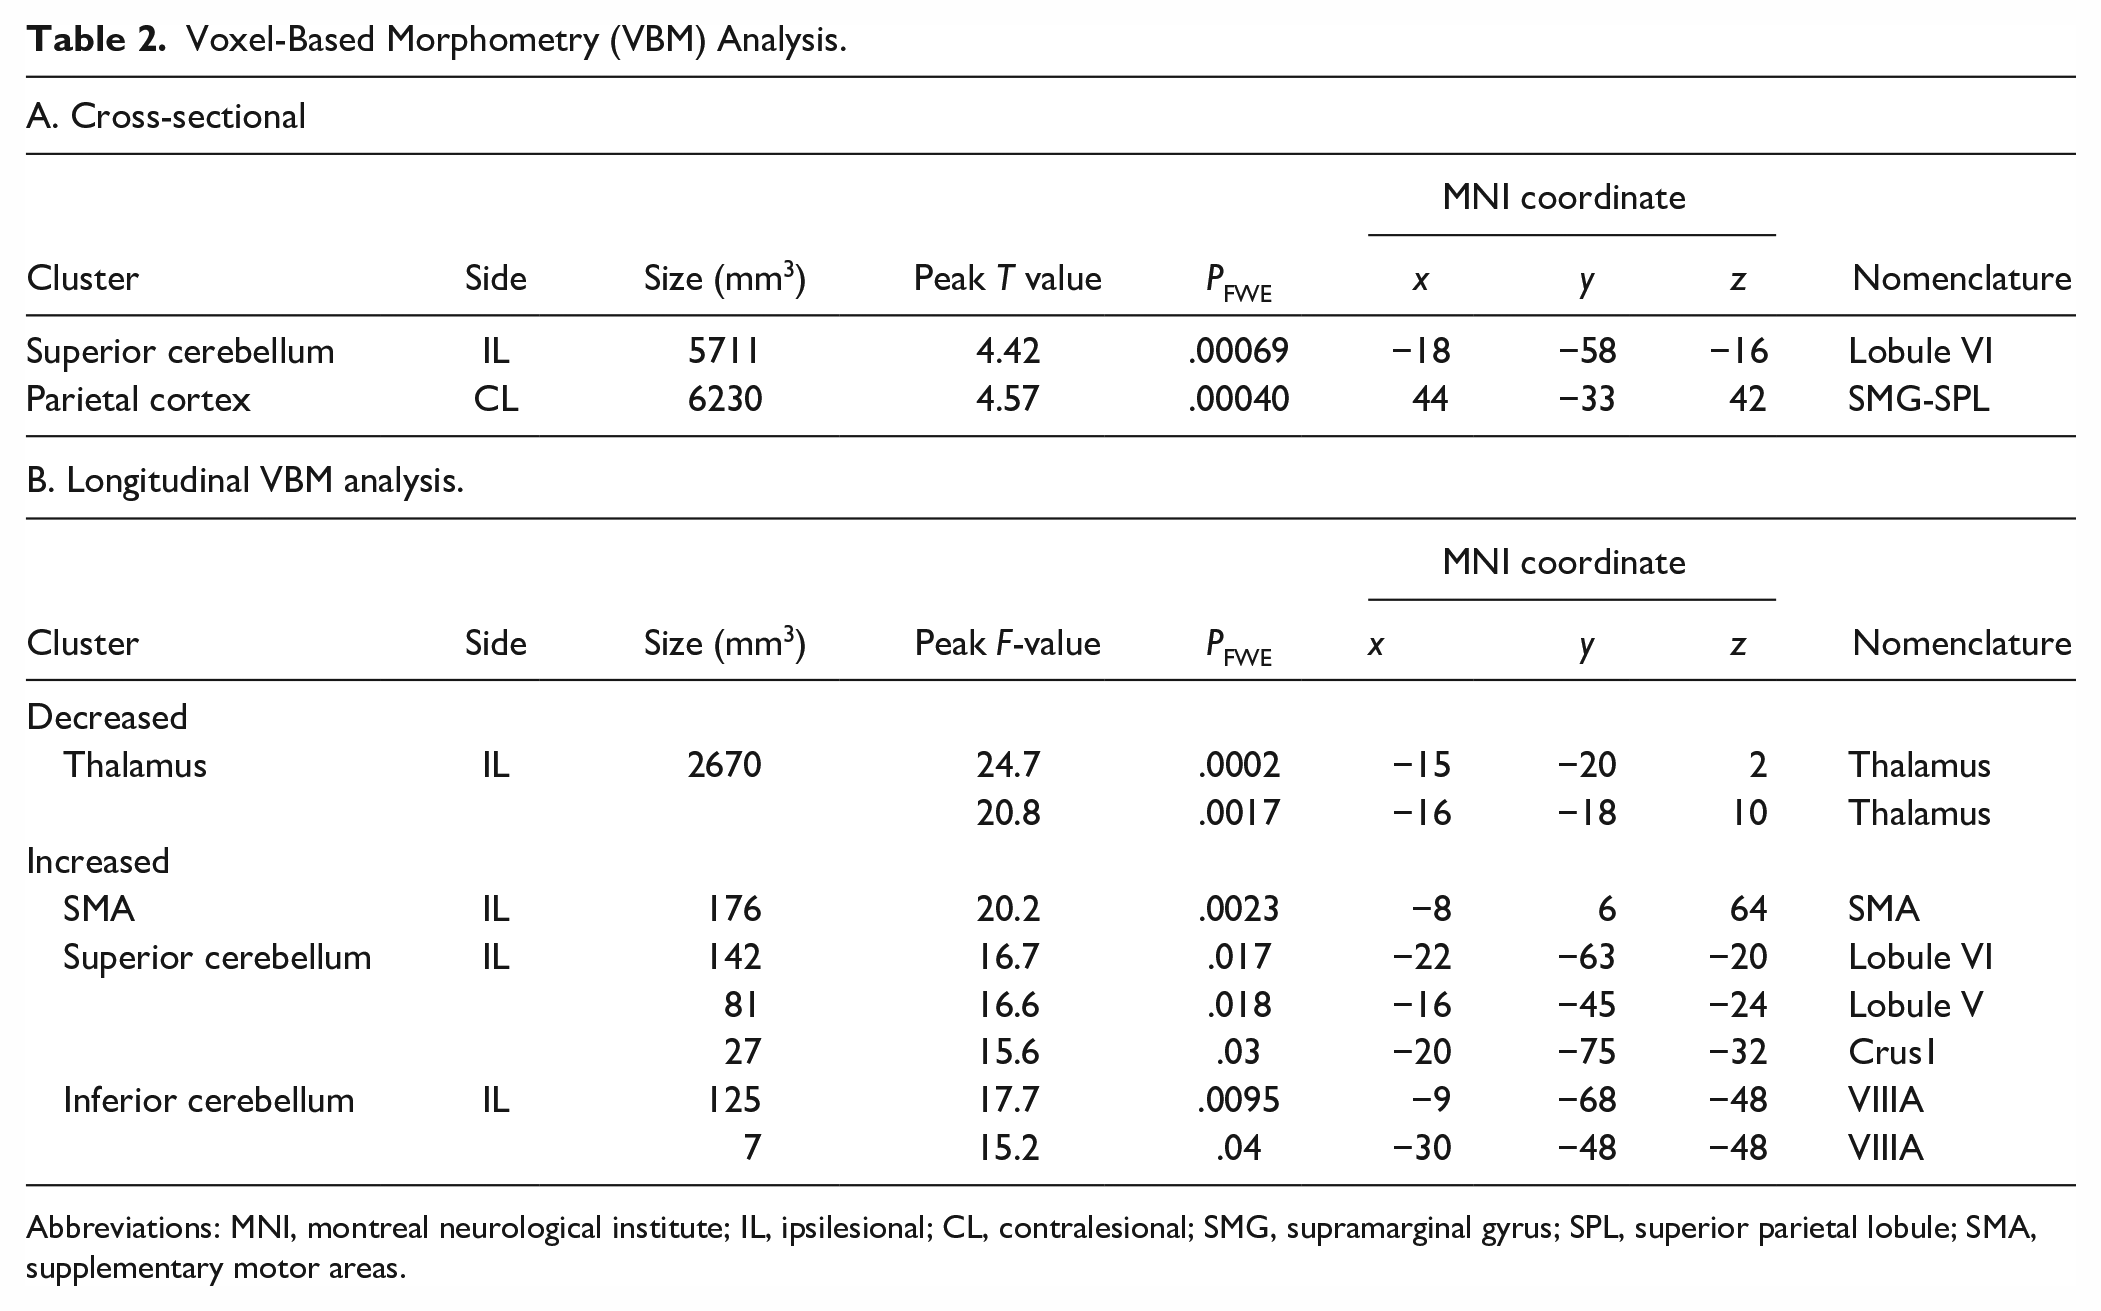
Abbreviations: MNI, montreal neurological institute; IL, ipsilesional; CL, contralesional; SMG, supramarginal gyrus; SPL, superior parietal lobule; SMA, supplementary motor areas.
Longitudinal VBM
For the patients available for the longitudinal VBM analysis, the mean mFMA was 57.0 ± 27.9 at T1, 68.8 ± 26.2 at T2, and 66.3 ± 27.5 at T3, which were significantly different across the time points (F[2,60] = 26.2, P < .001, partial η2 = .47; Figure 4A). The mean mFMA 33.8 ± 23.2 at T1, 40.8.8 ± 22.7 at T2, and 39.3.3 ± 22.3 at T3 (F[2,60] = 14.2, P < .001, partial η2 = .32) for the upper limb section and 22.5 ± 7.4 at T1, 27.1 ± 5.9 at T2, and 26.7 ± 6.5 at T3 for the lower limb section (F[2,60] = 28.9, P < .001, partial η2 = .49).
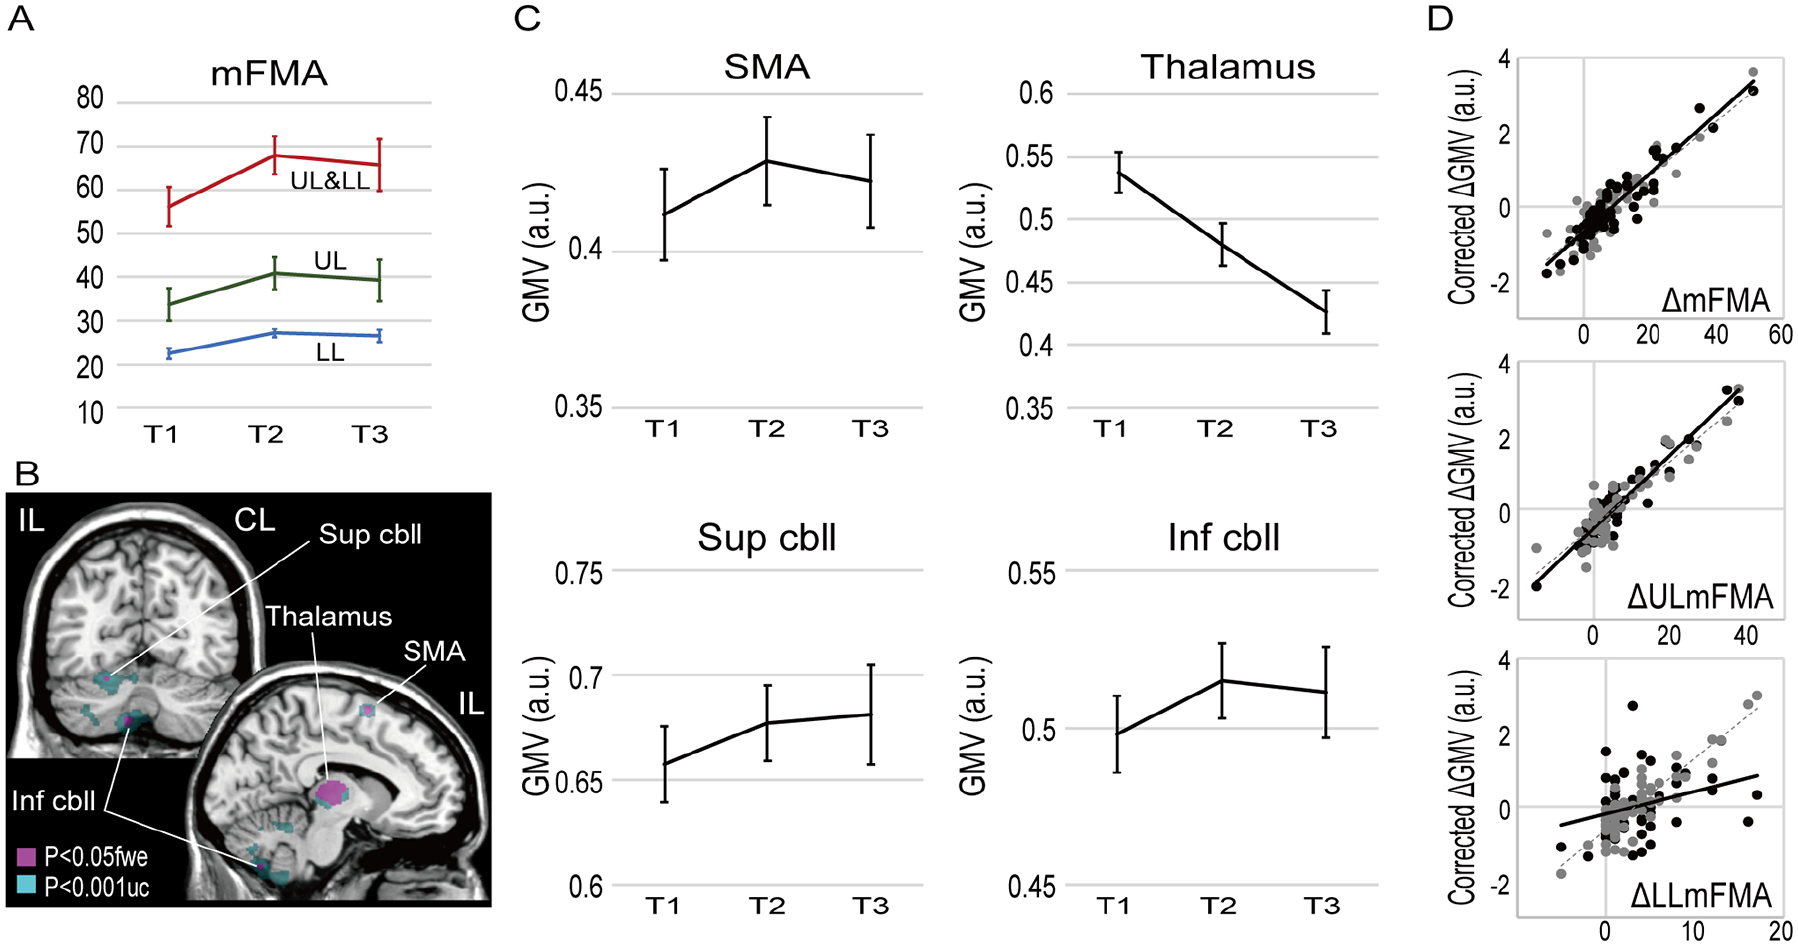
Longitudinal voxel-based morphometry (VBM) analysis. (A) Changes in the motor impairment (mFMA) for the total mFMA (UL&LL), mFMA of the upper limb (UL), and the lower limb (LL) across admission (T1, n = 43), second assessment (T2, n = 41), and third assessment (T3, n = 23). (B) F statistics identified 4 clusters with significant gray matter volume changes over time: the supplementary motor areas (SMA), thalamus, superior cerebellum (Sup cbll), and the inferior cerebellum (Inf cbll). For display purposes, the magenta areas show the clusters with peak an F value > 14.8 (P < .05 corrected for family wise error), while the cyan areas show the extent of the cluster with an F value > 7.7 (uncorrected P < .001). (C) Changes in GMV (arbitrary unit, a.u.) over time in stroke recovery. The error bars indicate the standard error of the mean. (D) The corrected ΔGMV (a.u.), which was ΔGMV after removing the effects of other covariates, is plotted against the ΔmFMA, ΔmFMA of the upper limb (ΔULmFMA) and the lower limb (ΔULmFMA) in the Sup cbll (black) and Inf cbll (gray).
In the longitudinal VBM analysis (Figure 4B, Table 2B for details), increased GMV was observed in the ipsilesional SMA (partial η2 = .35 at the peak), and the ipsilesional superior (partial η2 = .36) and inferior (partial η2 = .39) cerebellum, while decreased GMV was observed in the ipsilesional thalamus (partial η2 = .38).
Correlation Between ΔmFMA and ΔGMV
We tested whether a multiple regression model with age, stroke type (hemorrhage or infarction), and the GMV changes (ΔGMV) as explanatory variables accounted for the mFMA changes across the tine points (ΔmFMA). The multiple regression model revealed a significant fit with the data (adjusted R2 = .23, partial η2 = .30, P = .0025 by F[6,55] = 3.92, AIC = 167.9, BIC = 182.8). The ΔmFMA showed correlation with the ΔGMV in the superior cerebellum (β = −.50, t = −3.46, p = .001) and the inferior cerebellum (β = .30, t = 2.03, P = .047), but not with the SMA ΔGMV (β = .23, t = 1.07, P = .095), the thalamus ΔGMV (β = −.23, t = −1.66, P = .102), age (β = −.08, t = −0.68, P = .50), or the stroke type (β = .13, t = 1.02, P = .30). The ΔmFMA showed a strong correlation with the ΔGMV after correcting for the effects other variables (corrected ΔGMV in Figure 3D, upper panel) in both the superior cerebellum (r = .93) and the inferior cerebellum (r = .89).
The multiple regression model fitted with the motor recovery scores when it was separately applied to the ΔmFMA of the upper limb (adjusted R2 = .185, partial η2 = .27, P = .007 by F[6,55] = 3.31, AIC = 170.8, and BIC = 185.7),the lower limb (adjusted R2 = .157, partial η2 = .24, P = .016 by F[6,55] = 2.89, AIC = 172.9, and BIC = 187.8). The upper-limb ΔmFMA was correlated with both the superior cerebellar ΔGMV (β = −.50, t = −3.47, P = .001) and the inferior cerebellar ΔGMV (β = .30, t = 2.03, P = .047). The lower-limb ΔmFMA was correlated only with the inferior cerebellar ΔGMV (β = .41, t = 2.71, P = .009). Consistently, the upper-limb ΔmFMA showed a strong correlation with the adjusted ΔGMV (Figure 3D, middle panel) in both the superior cerebellum (r = .95) and the inferior cerebellum (r = .89). The lower-limb ΔmFMA the was correlated with the adjusted ΔGMV (Figure 3D, lower panel) strongly in the inferior cerebellum (r = .89), but only weakly in the superior cerebellum (r = .31), in agreement with the multiple regression analysis.
To interrogate if these longitudinal brain structural changes were also associated with sensory recovery, we tested the multiple regression model using the ΔFMA sensory scale (19.3 ± 4.5 at T1, 21.1 ± 3.8 at T2, and 21.4 ± 4.4 at T3), which differed across the time points (F[2,60] = 10.6, P < .001, partial η2 = .26). The multiple regression model however failed to explain the ΔFMA sensory scale with the ΔGMV (adjusted R2 = .15, partial η2 = .15, P = .146 by F[6,55] = 1.67, AIC = 179.6, and BIC = 194.5).
Discussion
We analyzed structural MRIs and FMA in subacute poststroke patients from multiple perspectives. The lesion overlap map and the VLSM analysis indicated that the WM lesions were primarily responsible for the variance of motor deficits in our patients. The cross-sectional VBM analysis revealed correlation of their residual motor ability with GMV in the ipsilesional cerebellum and the contralesional parietal cortex. The longitudinal VBM analysis revealed decreases in GMV in the ipsilesional thalamus and increases in GMV in the “motor control networks” including SMA and the ipsilesional superior and inferior cerebellum. Moreover, we found that the GMV changes of the superior and inferior cerebellum were correlated with motor recovery consistent with the “double motor representations” of the cerebellum. The upper-limb ΔmFMA was correlated with both superior and inferior cerebellar ΔGMV while the lower-limb ΔmFMA was correlated only with the inferior cerebellar ΔGMV. The novel evidence of the macrostructural cerebellar neuroplasticity underlying stroke recovery supports our a priori hypothesis about the role of the motor control network, especially the cerebellum, in motor relearning underlying stroke recovery.
Post-Stroke Atrophy
The reduction of GMV from several months to a year after the stroke onset was previously reported in the thalamus22,28 and the basal ganglia.18,19 In the longitudinal VBM analysis, we also found significant decreases in GMV in the thalamus. These findings fit with the concept of accelerated brain atrophy in the first 3 months after stroke. 28 Conversely, Abela et al 20 found increased, rather than decreased, GMV in the ipsilesional basal ganglia and thalamus between 3 and 9 months after the stroke onset. Note, however, that the study by Abela et al 20 examined stroke involving the motor cortex, which is likely associated with different recovery mechanisms than that for the subcortical damage mainly observed in the present cohort.
Macrostructural Cerebellar Neuroplasticity Correlated With Motor Recovery
The cross-sectional and longitudinal VBM analyses consistently revealed that macrostructural neuroplasticity of the ipsilesional cerebellum might underlie motor recovery after stroke. This finding deemed particularly important because of the correlation between the ΔmFMA and ΔGMV in the ipsilesional cerebellum. Previous studies have reported inconsistent findings on post-stroke macrostructural neuroplasticity in the cerebellum. Decreased GMV in the contralesional cerebellum has been widely reported after stroke.18-22 Notably, Yu et al 22 found that the atrophy progression of the contralesional cerebellum was correlated with poor motor recovery. This phenomenon is termed the cross cerebellar atrophy coupled with ipsilesional supratentorial atrophy. 25 A similar cerebellar GMV reduction was reported in patients with pontine infarction, which likely disrupted the mossy fibers to the cerebellum. 29 Nevertheless, Fan et al 18 reported a moderate increase in GMV in the ipsilesional cerebellum (lobule VI) after stroke, although this cerebellar GMV change was not correlated with motor recovery.
The role of the cerebellum in motor control and learning is most well established among various functions of the cerebellum. 30 Anatomically, the cerebellar hemisphere is subdivided into the anterior lobe (lobules I-VI) and posterior lobe (lobules VII-X), which are separated by the primary fissure. The cerebellum has 2 separate whole-body motor representations (double motor representations): one in the anterior lobe (lobules IV and V) and the other in the posterior lobule (including lobule VIII).31,32 In our cross-sectional analysis, mFMA was correlated with GMV in the anterior cerebellar lobule V and VI. This zone coincided with the superior cerebellar zone (Supplemental Material Information), which showed macrostructural neuroplasticity in the longitudinal VBM analysis. Additionally, we found macrostructural neuroplasticity in the inferior cerebellar zone, corresponding to the lobule VIIIA in the posterior lobe. The present superior and inferior cerebellar zones agree with double motor representations in the anterior and posterior–inferior lobes of the cerebellum.31,32 The correlation of upper limb ΔmFMA with both superior and inferior cerebellar ΔGMV is consistent with the wide upper-limb representations in the cerebellum. Notably, we found association between ΔmFMA of lower limb and ΔGMV only of the inferior cerebellum, which mainly represents lower limb movement. 31
How can the neuroplastic changes of the motor cerebellum support stroke recovery? Only a few among the previous longitudinal VBM studies18-24 explicitly reported rehabilitation during the follow-up period. The participants in the present study underwent intensive in-hospital rehabilitation programs in the subacute stage of stroke. Thus, the neuroplastic changes would include the effects of both spontaneous recovery and rehabilitation. Consistent with this concept, the superior cerebellar zone corresponds to the cerebellar region, where previous task functional MRI (fMRI) studies found increased motor task-related activity after rehabilitation training.16,17 Luft et al 17 also reported increased brain activity in the ipsilesional cerebellum and contralesional frontoparietal cortices after 6-week training with rhythmic cueing. Furthermore, Johansen-Berg et al 16 found increased activity in the bilateral cerebellum and the contralesional frontoparietal cortices after a 2-week constrained-induced therapy. These studies of longitudinal task fMRI combined with rehabilitative interventions support a role for the ipsilesional cerebellum and contralesional frontoparietal cortex in motor retraining. Note, however, that effective rehabilitation training should influence motor performance, which in turn modulates brain activity during fMRI. Thus, it is difficult for these task fMRI studies alone to segregate between neuroplastic changes and the resulting improvement in motor performance. Given that structural measurement is not influenced by task performance at measurement, our findings complement these fMRI studies16,17 to support a role for cerebellar neuroplasticity in rehabilitation-mediated motor recovery.
Numerous human neuroimaging studies have reported changes in cerebellar activity and connectivity in association with motor or procedural learning, even in older adults.15,33,34 Training-induced increases in cerebellar GMV have also been reported in patients with cerebellar degeneration (2-week postural training) 35 and in healthy people (2-month video-game training). 36 These studies provide empirical evidence supporting the concept that cerebellar GMV changes reflect the formation of new cerebellar networks, corresponding to the “internal models” or feedforward controllers of newly learned movement or procedure.15,37 Hence, a possible interpretation of the cerebellar macrostructural neuroplasticity is the formation of internal models, corresponding to the local neural circuits encoding relearned motor patterns and procedures.
Ipsilesional SMA and Contralesional Parietal Cortex
It is rather unlikely that the cerebellum alone is responsible for motor recovery. The SMA, which plays an important role in motor learning, showed neuroplastic changes in the present study. This is reasonable because the SMA was preserved in our patient group (Figure 2A). Additionally, the contralesional parietal cortex correlated with residual motor ability. Thus, the fronto-parietal cortex is potentially involved in stroke recovery. The cerebellum is thought to be involved in error-based learning by receiving inputs from the inferior olivary nucleus (climbing fibers) and the cerebral cortex via the pontine nucleus (mossy fibers). After processing in the cerebellar local circuits, the cerebellar output projects to the cerebral cortex via the thalamus. Hence, cerebellar neuroplasticity should accompany neuroplasticity in the cortico-cerebellar circuits. Indeed, the integrity of cortico-cerebellar connectivity was shown to reflect residual motor performance in post-stroke patients. 24
Limitations
Longitudinal data were not available from all patients. Furthermore, mFMA at T3 tended to be lower than that at T2, indicating that more severely impaired patients required longer in-hospital rehabilitation. The heterogeneity of our study cohort was also a limitation, although this may have introduced adequate data variations, thus helping to detect findings that were probably underestimated in previous studies. In relation to the heterogeneity issue, we needed to flip the lesion side to obtain clear results; thus, we cannot discuss differences in the effects of the lesion side on motor recovery. We also failed to find the GMV changes correlated with sensory recovery probably because we mainly recruited patients with motor impairment, resulting in small variations in the measurements correlated with the sensory score. A larger and more comprehensive dataset is required to fully explore all the aspects of, and potential contributing factors to, the mechanisms underlying recovery after stroke. An important step toward this is to form a multi-site consortium such as the ENIGMA Stroke Recovery Working Group. 38
The neurobiological mechanisms underlying macrostructural neuroplasticity remain unclear. 39 At the cellular level, the macrostructural neuroplasticity is supposed to involve axonal sprouting, synaptogenesis (also involving pruning), angiogenesis, oligodendrogenesis, and modulation of astroglia. There is still a gap between these cellular level mechanisms and GMV increases or decreases; researchers are now trying to fill the gap. In an animal model study, rehabilitative training induced cerebellar GM changes involving synaptogenesis and increased glial cell size. 40 We have also established an animal model in which operant conditioning induces macrostructural neuroplasticity in the cerebellum. 41 Using this model, we are currently examining the neurobiological mechanisms associated with cerebellar GMV changes during motor training.
Conclusions
The present study supported that the involvement of the macrostructural neuroplasticity of the motor control network, the cerebellum in particular, underlies motor recovery after stroke. The macrostructural neuroplasticity likely corresponds to the formation of the internal models, thereby generally supporting the statement that “Thus rehabilitation needs to emphasize techniques that promote formation of appropriate internal models and not just repetition of movement. 8 ” Theoretically, this process is achieved through motor learning relying on both motor commands and sensory information about the motor outcomes. Hence, rehabilitation techniques should emphasize both the motor efferents and sensory afferents.
Supplemental Material
sj-docx-1-nnr-10.1177_15459683231207356 – Supplemental material for Macrostructural Cerebellar Neuroplasticity Correlates With Motor Recovery After Stroke
Supplemental material, sj-docx-1-nnr-10.1177_15459683231207356 for Macrostructural Cerebellar Neuroplasticity Correlates With Motor Recovery After Stroke by Takashi Hanakawa, Fujiko Hotta, Tatsuhiro Nakamura, Keiichiro Shindo, Naoko Ushiba, Masaki Hirosawa, PT, MS, Yutaka Yamazaki, OT, BS, Yoshinao Moriyama, PT, PhD, Syota Takagi, PT, BS, Katsuhiro Mizuno and Meigen Liu in Neurorehabilitation and Neural Repair
Footnotes
Author Contributions
T. Hanakawa, F. Hotta, K. Mizuno, and M. Liu designed the study; F. Hotta, K. Shindo, N. Ushiba, M. Hirosawa, Y. Yamazaki, Y. Sato, and S. Takagi collected the data; T. Hanakawa and T. Nakamura analyzed the data; T. Hanakawa drafted the paper. All authors have been involved in revising this manuscript for intellectual content and have approved the final version of the manuscript.
Declaration of Conflicting Interests
The author(s) declared no potential conflicts of interest with respect to the research, authorship, and/or publication of this article.
Funding
The author(s) disclosed receipt of the following financial support for the research, authorship, and/or publication of this article: This study was supported in part by the Japan Agency for Medical Research and Development (17dm0107033h0005, 18 dm0207070, 18 dm0307003) and KAKENHI (19H03536 and 19H05726) from the Japan Society for the Promotion of Science and Japan Science and Technology Agency, CREST, grant number JPMJFR206G to TH.
Supplementary material for this article is available on the Neurorehabilitation & Neural Repair website along with the online version of this article.
References
Supplementary Material
Please find the following supplemental material available below.
For Open Access articles published under a Creative Commons License, all supplemental material carries the same license as the article it is associated with.
For non-Open Access articles published, all supplemental material carries a non-exclusive license, and permission requests for re-use of supplemental material or any part of supplemental material shall be sent directly to the copyright owner as specified in the copyright notice associated with the article.