
Abstract
Background. Neuroimaging biomarkers are valuable predictors of motor improvement after stroke, but there is a gap between published evidence and clinical usage. Objective. In this work, we aimed to investigate whether machine learning techniques, when applied to a combination of baseline whole brain volumes and clinical data, can accurately predict individual motor outcome after stroke. Methods. Upper extremity Fugl-Meyer Assessments (FMA-UE) were conducted 1 week and 12 weeks, and structural MRI was performed 1 week, after onset in 56 patients with subcortical infarction. Proportional recovery model residuals were employed to assign patients to proportional and poor recovery groups (34 vs 22). A sophisticated machine learning scheme, consisting of conditional infomax feature extraction, synthetic minority over-sampling technique for nominal and continuous, and bagging classification, was employed to predict motor outcomes, with the input features being a combination of baseline whole brain volumes and clinical data (FMA-UE scores). Results. The proposed machine learning scheme yielded an overall balanced accuracy of 87.71% in predicting proportional vs poor recovery outcomes, a sensitivity of 93.77% in correctly identifying poor recovery outcomes, and a ROC AUC of 89.74%. Compared with only using clinical data, adding whole brain volumes can significantly improve the classification performance, especially in terms of the overall balanced accuracy (from 80.88% to 87.71%) and the sensitivity (from 92.23% to 93.77%). Conclusions. Experimental results suggest that a combination of baseline whole brain volumes and clinical data, when equipped with appropriate machine learning techniques, may provide valuable information for personalized rehabilitation planning after subcortical infarction.
Keywords
Introduction
Patients with acute cerebral infarction experience either proportional recovery or poor recovery within 3 months after stroke onset.1-4 However, clinically validated models for predicting such spontaneous motor recovery are scarce. The typically employed initial upper extremity on the Fugl-Meyer Assessment (FMA-UE) score alone may not be able to reliably predict future motor improvements in patients with severe deficits because those patients usually have very high outcome variability.2,5 Recently, there have been studies showing that diffusion tensor imaging (DTI) or task-based functional magnetic resonance imaging (fMRI) can improve the accuracy of future motor recovery prediction.6-9 However, either DTI or task-based fMRI requires a very high compliance of patients and a high-standard imaging equipment. Moreover, they usually involve very complex imaging data processing. These reasons hinder the widespread utility of those advanced imaging techniques in routine clinics. In prediction studies using structural MRI, to date, the extent to which lesions interfere with descending corticospinal tract (CST), namely the CST lesion load, has been shown to be able to accurately predict subsequent recovery patterns after stroke.5,10-14 Nevertheless, clinical applications of this indicator are still limited due to complex imaging data processing, e.g., segmenting out both stroke lesions and CST.
It has been reported that baseline gray matter and white matter volumes in task-related brain areas could predict individual performance improvements after motor skill learning in nonhuman primates and healthy subjects.15,16 Also, baseline measures of brain volumes have been employed in predicting subsequent changes in cognitive performance over a 10-year period in healthy elderly women and disability progression and cognitive dysfunction over a 6-year period in patients with multiple sclerosis.17,18 However, whether baseline brain volume measures in the first few days after stroke could accurately predict motor outcome at an individual level remains unclear.
Recently, machine learning has become ubiquitous for solving complex problems in medical image analysis. 19 In prediction studies, automated discrimination algorithms are usually employed. In addition to discrimination, incorporating resampling, feature selection as well as ensemble techniques might help further improve prediction performance. It is well known that resampling can address data imbalance issue. 20 Feature selection has been proven to be effective and efficient in preparing data for feature-based classification problems, especially in high-dimensional settings. If used appropriately, it can automatically remove irrelevant features to increase computational efficiency and a model’s generalization ability. 21 And the ensemble strategy is very intuitive in making a decision via majority voting. 22 For some machine learning tasks, an ensemble strategy aggregates multiple models to obtain a combined model that outperforms every single model to achieve better performance and suppress overfitting. Despite the importance of resampling, feature selection and ensemble, choosing appropriate classification algorithms is still one of the most crucial components in designing an automated prediction system.
A primary goal of this paper was to design a sophisticated machine learning scheme, including resampling, feature selection and classification, to accurately predict individual motor recovery patterns within 3 months after acute supratentorial subcortical infarction. For the proposed prediction scheme, we also aimed at identifying a suitable set of features. We hypothesized that a combination of baseline clinical data and baseline brain volumes could accurately predict individual motor outcomes, performing much better than using each individual type of features (either clinical data or brain volumes). Extensive validation experiments were conducted.
Material and Methods
Participants and Behavioral Tests
This research was approved by the First Affiliated Hospital of Sun Yat-Sen University Clinical Research Review Board. Oral and written informed consent was obtained from each patient personally or by proxy. Inclusion criteria included: (1) first unilateral supratentorial subcortical cerebral infarct (<7 days) without cortical lesions as confirmed by T1-weighed imaging, T2-weighted imaging, and diffusion-weighted imaging (Figure 1); (2) no occlusion of a major artery, as evaluated by ultrasound and magnetic resonance angiography or CT angiography; (3) 18 to 75 years old; (4) an FMA-UE score <66 points
9
; and (5) have been receiving routine rehabilitation therapies.7,23-25 Exclusion criteria included: (1) inability to undergo cerebral MRI; (2) any revascularization therapy, including intravenous alteplase or mechanical approaches; (3) traumatic brain injury, epilepsy, Parkinson’s disease, psychiatric diseases, or systemic diseases such as terminal carcinoma, renal failure, and cirrhosis; and (4) any other neurological deficits (aphasia) or use of medications that are likely to affect motor examination outcomes during follow-up. Lesion maps from participants exhibiting proportional vs poor recovery. All lesions are aligned to the same hemisphere for visualization. Colors represent the numbers of patients with lesions at the given location.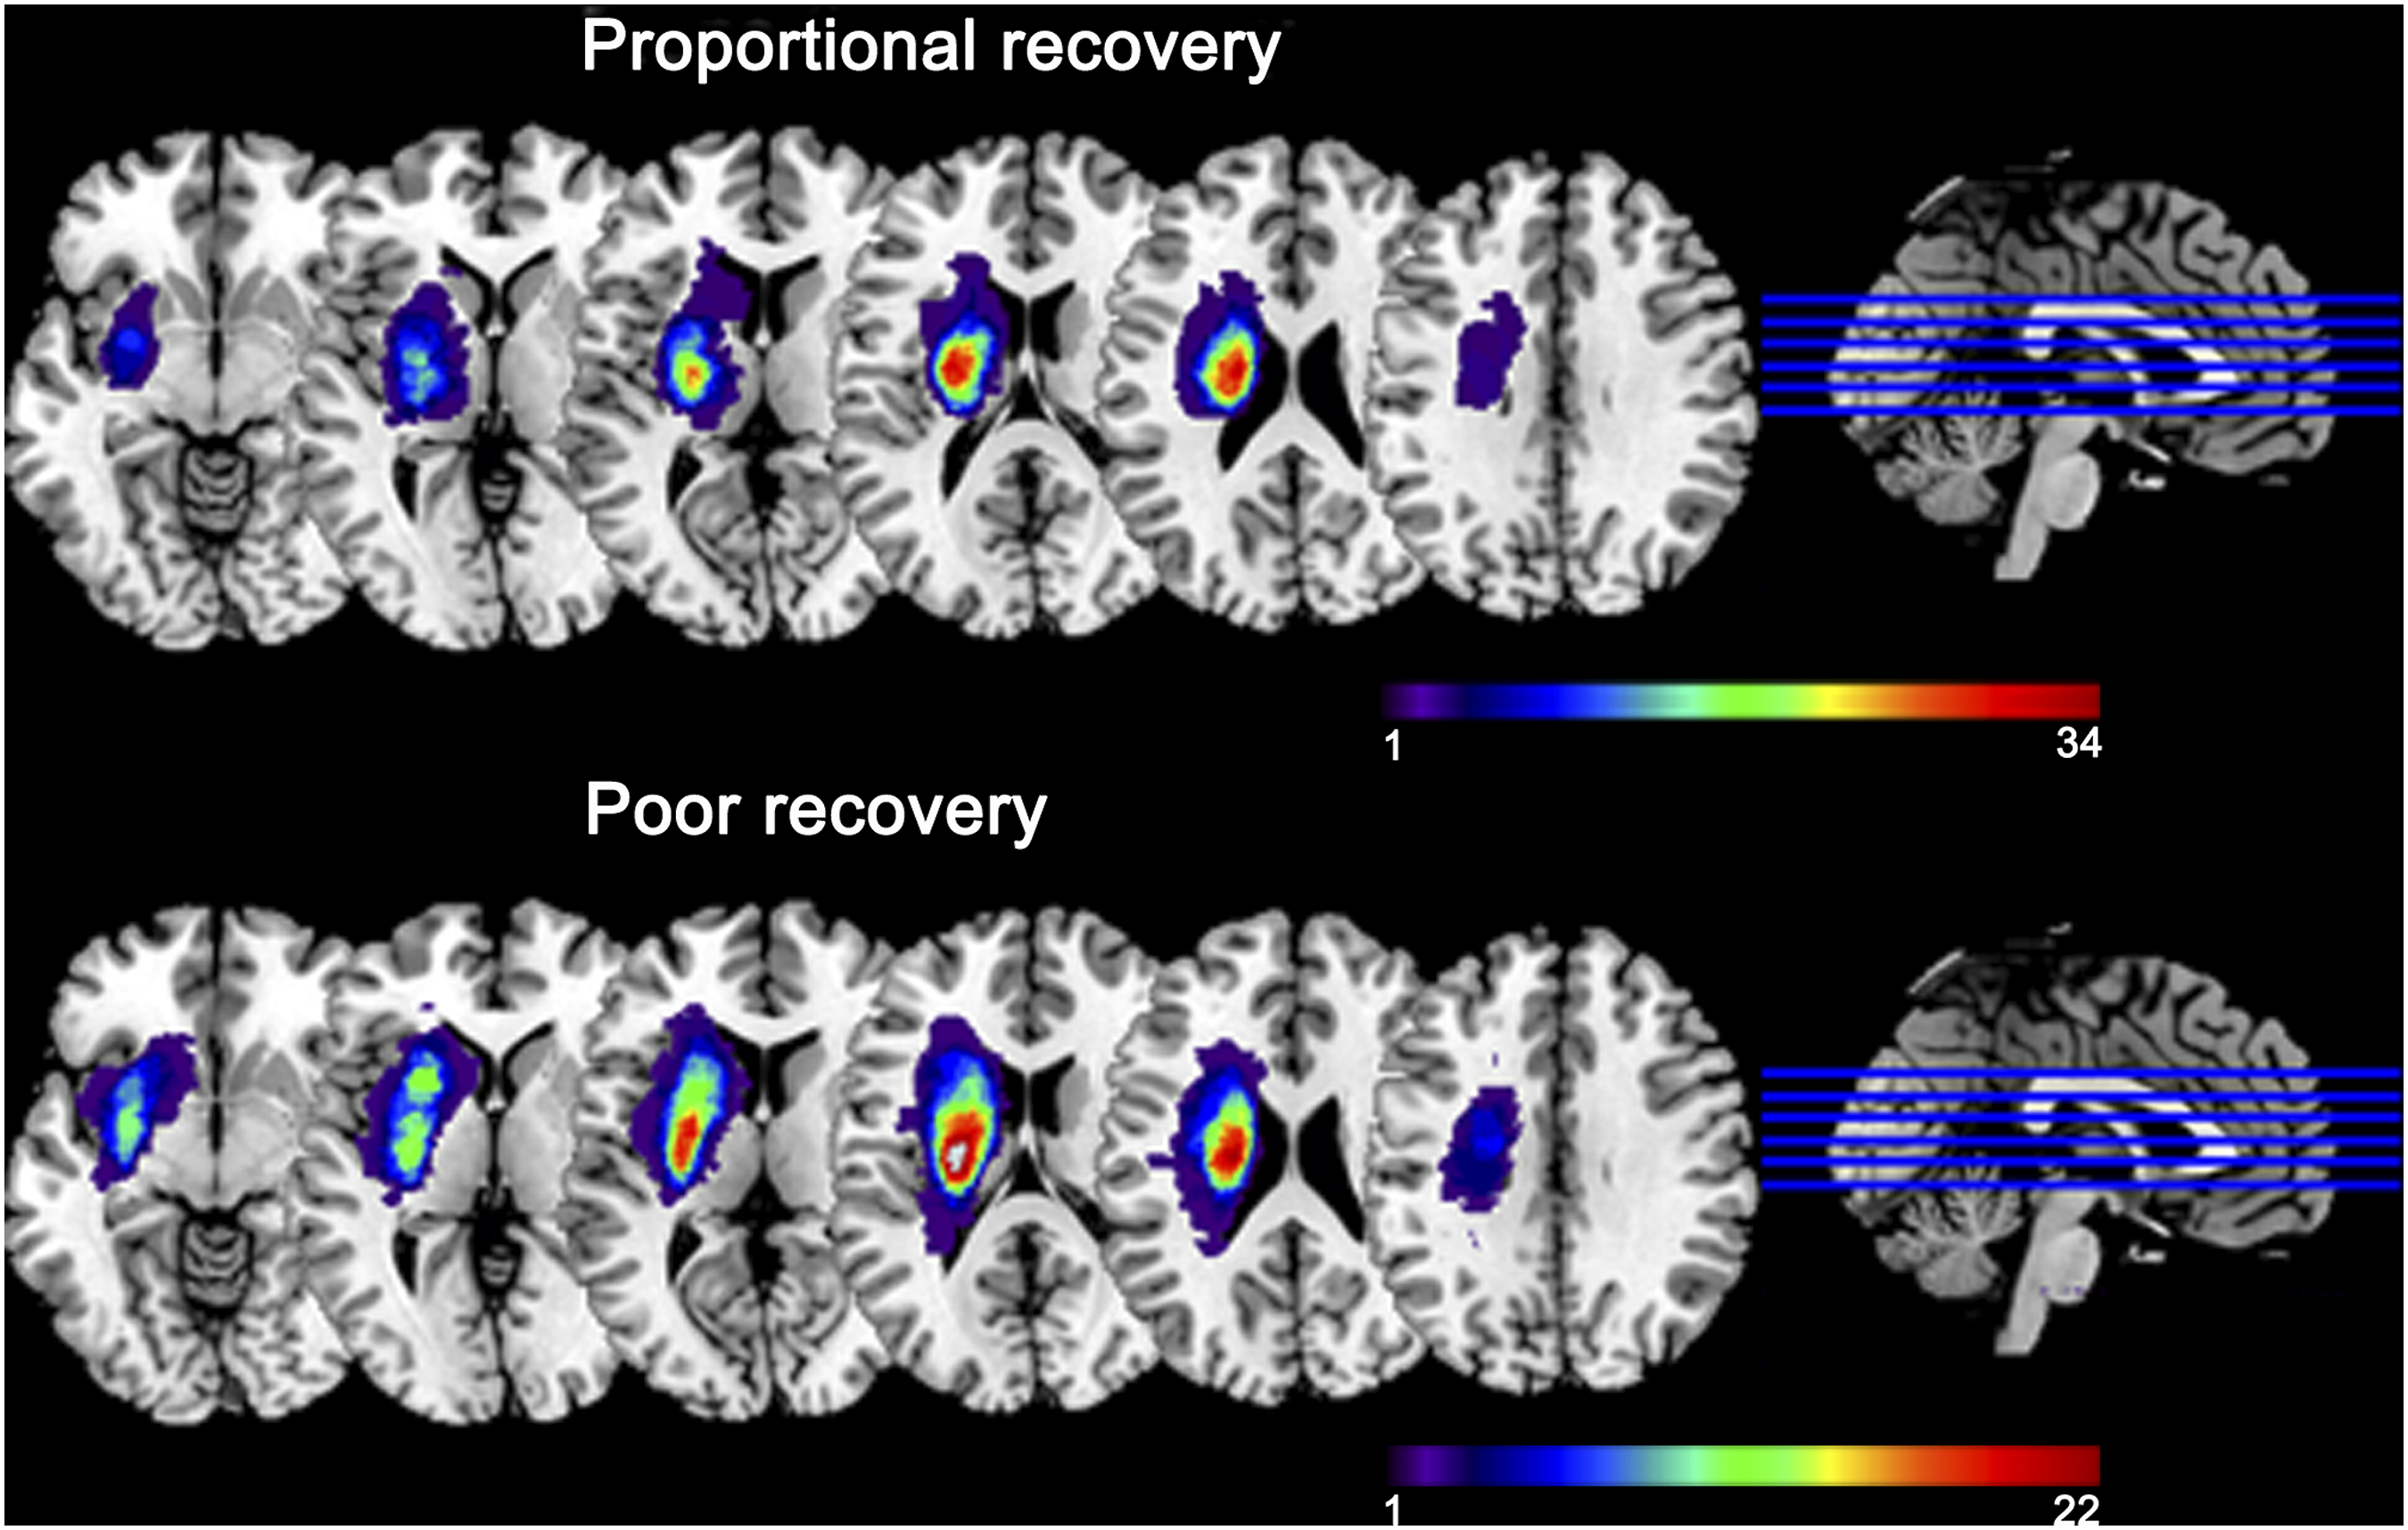
Experimental Design
The study protocol of this work was planned as a 12-week longitudinal investigation, with patients undergoing neurological and motor assessments two times after stroke onset: within 1 week after symptom onset (W1, <7 days) and at the end of week 12 (W12, 84 ± 4 days).7,23-25
Clinical Assessments
A detailed neurological examination, including an initial neurological deficit evaluation using the National Institutes of Health Stroke Scale (NIHSS) as well as motor deficit assessments at W1 and W12 using the Fugl-Meyer Scale, were performed by a trained neurologist who was blind to the MRI examination results. The difference between the FMA-UE scores at W1 and W12 was used to estimate motor recovery. The initial impairment degree (FMA-UEimpairment) for each patient was defined as the maximum FMA-UE score (66) minus the patient’s FMA-UE score at baseline (W1). According to the proportional recovery rule, 1 the expected improvement was computed as 70% of the impairment at the initial evaluation, namely
ΔFMA-UEpredicted = .7 × FMA-UEimpairment.
Model residuals were defined as the differences between predicted and observed motor function recovery scores from W1 to W12. These model residual values were then employed to assign patients to the proportional recovery group (model residuals ≤15, n = 34) or the poor recovery group (model residuals >15, n = 22). 7
Image Acquisition
All patients were scanned at W1 using a 3T scanner (Tim Trio; Siemens, Erlangen, Germany) with a 12-channel head coil. The 3D T1-weighted acquisition was conducted using a magnetization-prepared rapid acquisition gradient echo pulse sequence with the following scanning parameters: repetition time (TR)/echo time (TE)/inversion time (TI)/number of excitations (NEX)/flip angle = 2530 ms/3.45 ms/1100 ms/1/7°, 192 slices, 256 × 256 matrix dimensions, and a 1 × 1 × 1-mm3 voxel size. A total of 6 patients were excluded from analyses because of distortion on MRI either caused by movement (n = 3) or early scan termination (n = 3). This resulted in a study sample of 56 patients with supratentorial subcortical infarction (21 women and 35 men, median age: 53 years; Figure 1).
Feature Extraction, Resampling, and Scaling
Two types of features were used in this study, including the motor data at admission (FMA-UE scores) and brain structure volumes from T1-weighted images. The reason why brain volumes were employed is because brain morphometrics can provide vital information for disease diagnoses and prognoses. To obtain volumetric segmentations, all T1-weighted images were processed with a fully automated segmentation pipeline known as braingps (https://mricloud.org).
26
This segmentation pipeline builds its basis on a two-level Bayesian parameter estimation algorithm called the multiatlas likelihood fusion (MALF) algorithm in the framework of the random deformable template model.
27
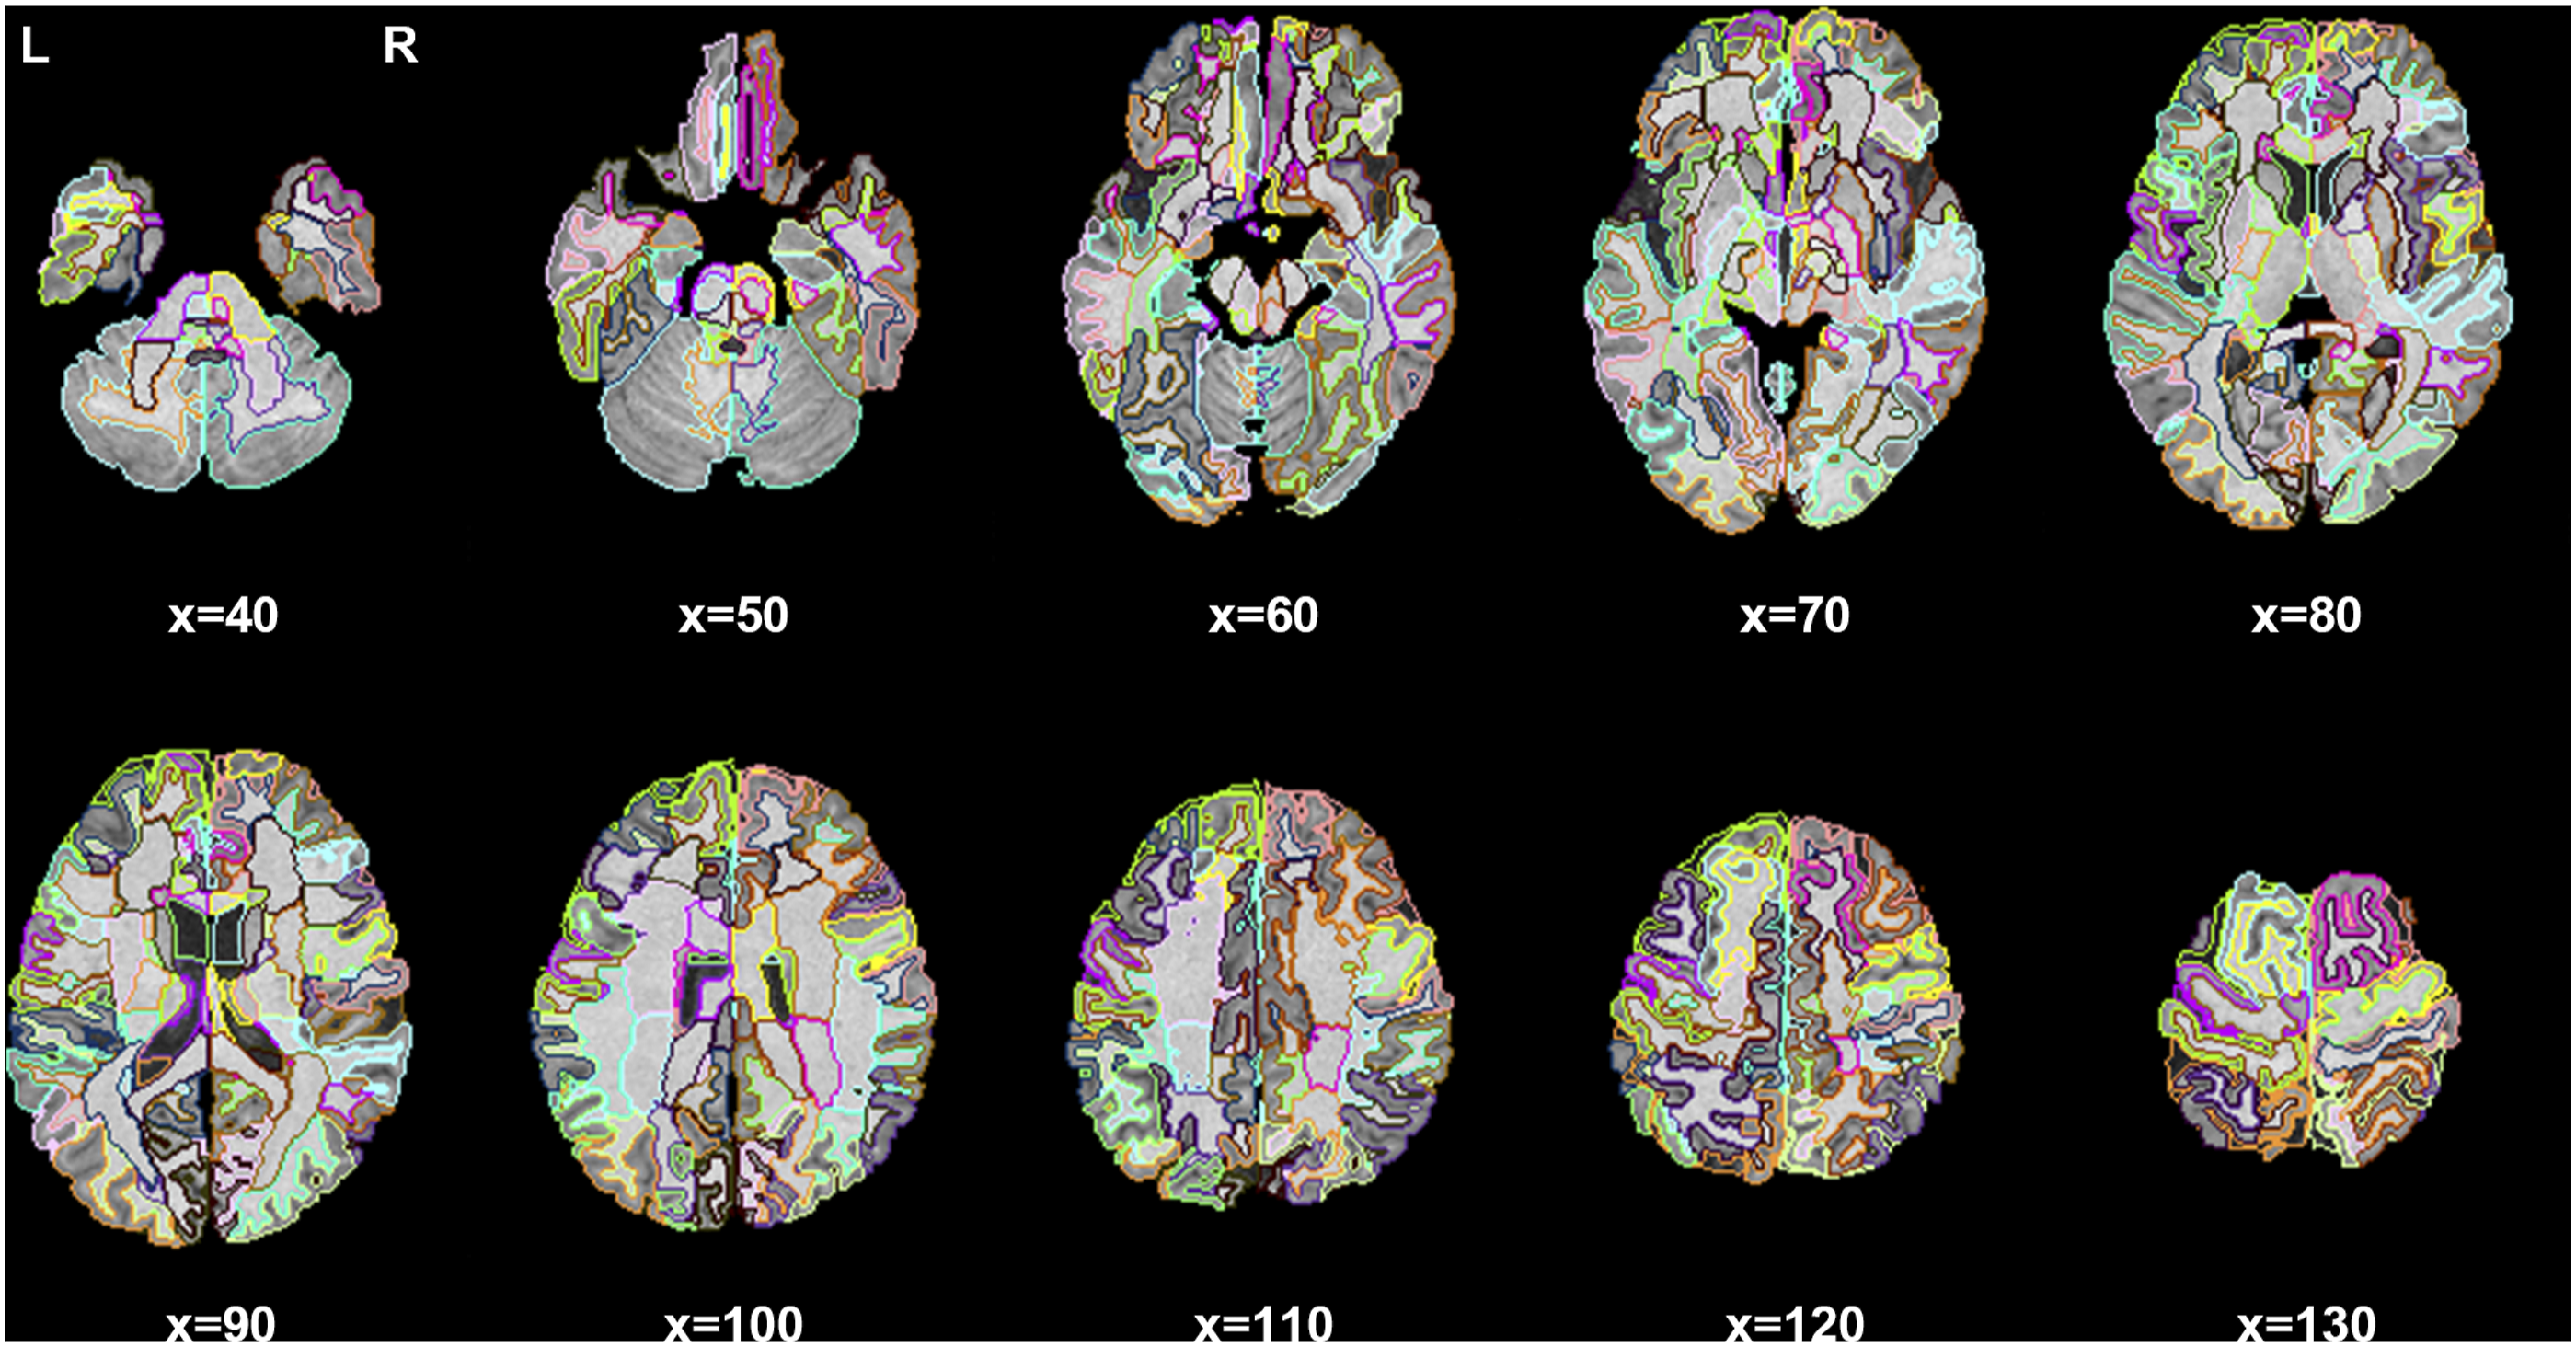
More detailed information about the MALF algorithm can be found in our previous studies.27,28 This pipeline segmented each whole brain into 274 brain structures, and their volumes then served as our discrimination features. The baseline whole brain segmentation of a representative patient is shown in Figure 2, and more details about each structure (abbreviation and full name) can be found in Supplemental Table S1. A whole brain segmentation example (Axial view) obtained from the MALF algorithm. L, left hemisphere; R, right hemisphere; x, the axial slice index.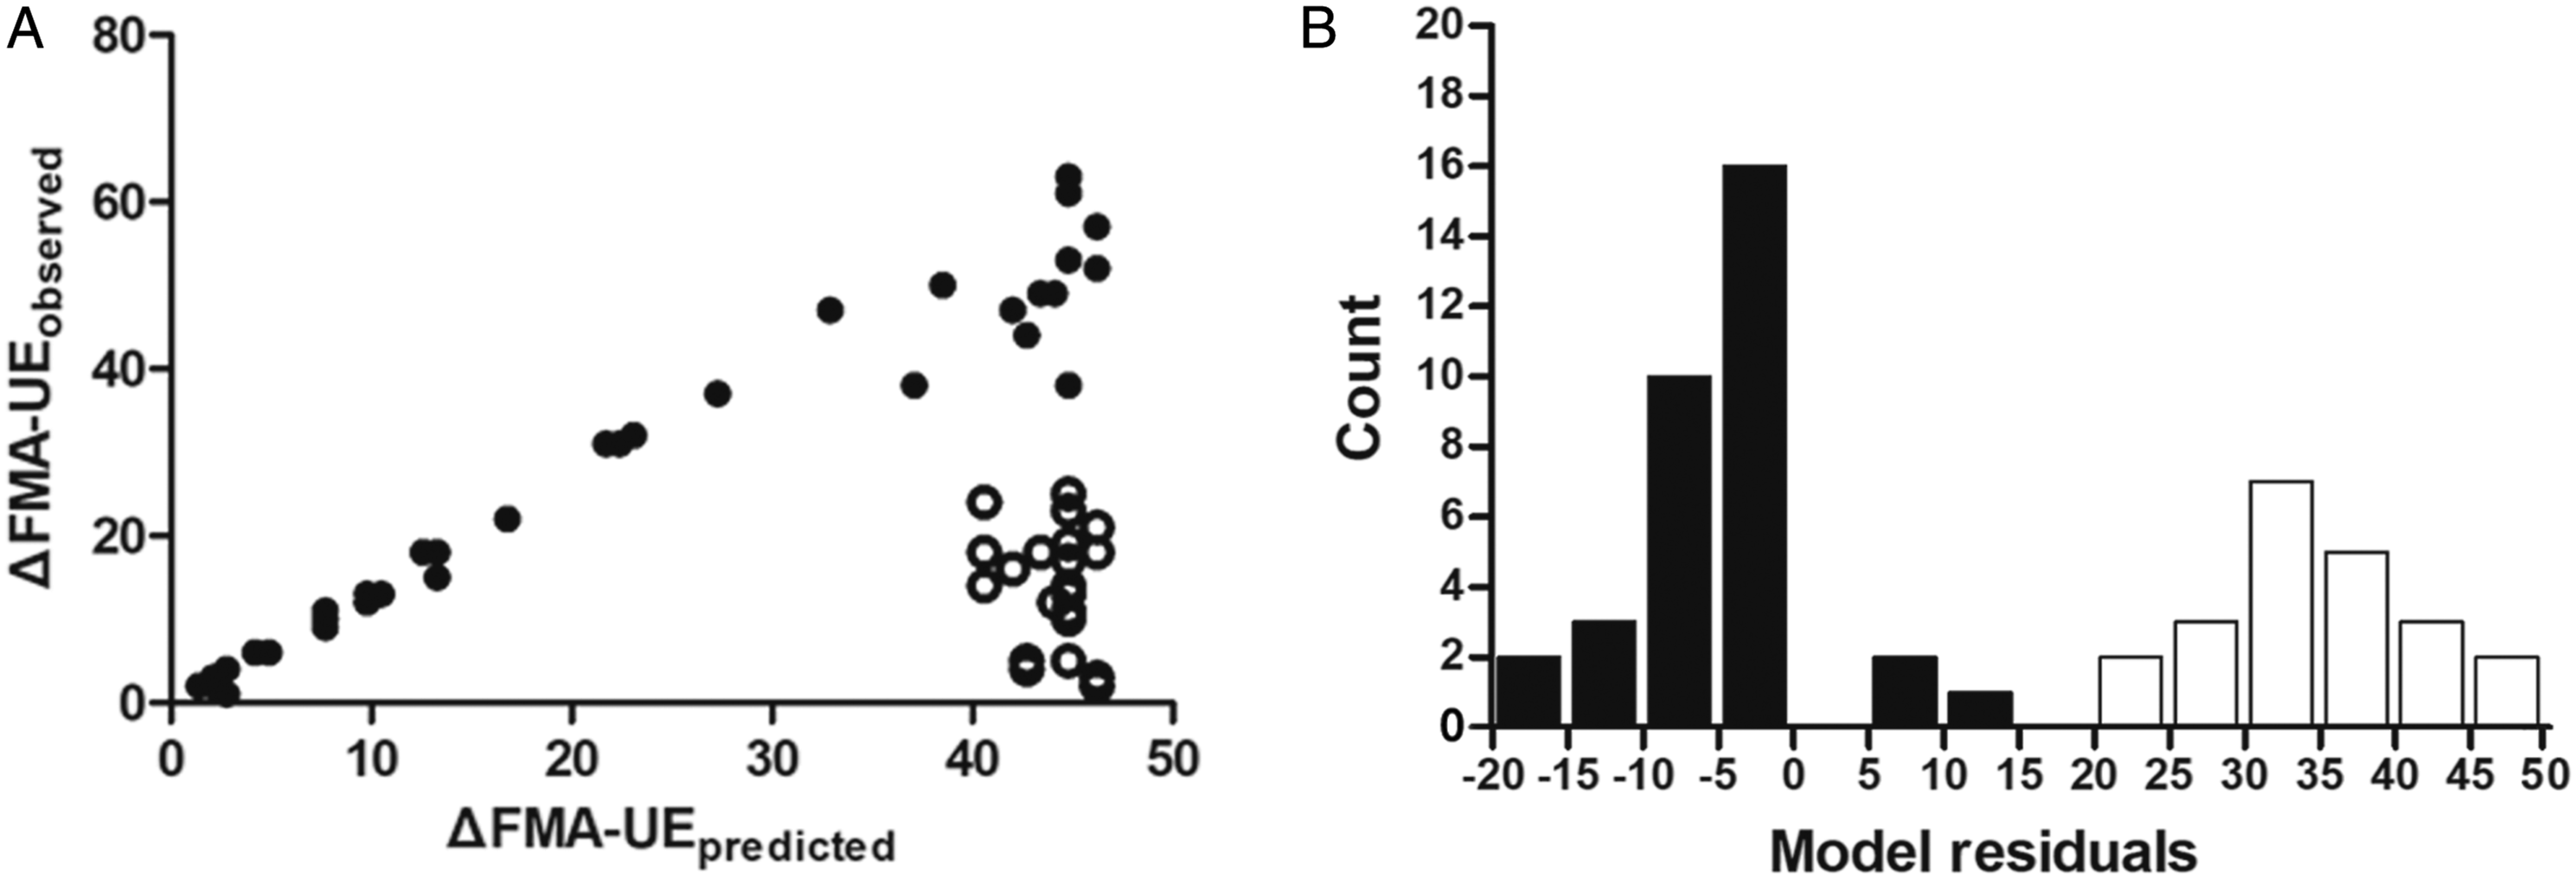
Due to the imbalance of samples, we applied Synthetic Minority Over-sampling Technique for Nominal and Continuous (SMOTE-NC) 29 on the minority class, i.e., poor recovery group. SMOTE-NC over-samples the minority class by taking each minority sample and generating synthetic ones utilizing its k nearest neighbors within the minority class. 29 Here, we selected k to be 5.
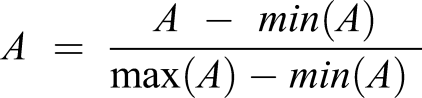
Please note that the two types of features that we employed have different ranges making certain features dominate others, which is inappropriate in most machine learning algorithms. To alleviate this issue, we scaled all original features to lie in the [0, 1] range utilizing Min–Max normalization. Specifically, each feature was scaled as below
Feature Selection and Classifiers
Due to the relative high dimension of the volume features compared to the sample size (274 vs 56), we performed feature selection to reduce feature dimension. There were two feature selection methods used in our experiments, namely Conditional Infomax Feature Extraction (CIFE) 30 and ReliefF. 31 The reason why we used those two methods is because both of them are fast and model agnostic. CIFE selected the mostly related features based on the mutual information between features and class labels. 30 ReliefF calculated and sorted the weight of each feature according to the values of several nearest neighbors within the same class and the values of several nearest neighbors within each of the other classes. 31
In classifying between proportional and poor recovery groups, we tested two ensemble methods when building the classifiers, namely Bagging 32 and Gradient Boosting Decision Tree (GBDT). 33 In certain situations, ensemble methods can suppress overfitting caused by limited-size data and provide more reliable results by incorporating several weak models to construct a stronger one. The overall balanced accuracy, F1, sensitivity, specificity and area under the receiver operating characteristic curve (ROC AUC), and area under the precision recall curve (PR AUC) were used as metrics to evaluate the performance of different classification models.
Two-Tier Cross-Validation
To obtain stable and reliable results, a stratified 5-fold cross-validation was repeated 100 times, namely the data was randomly split into 5-folds for a total of 100 times and the proportion of each class is the same in each fold. The 5-fold partition results may vary from time to time due to a new random distribution at each time. At each of the 100 times, a two-tier cross-validation strategy was employed, with the inner cross-validation used to estimate the optimal set of parameters and the external one used to quantify the classification performance. The entire classification procedure is illustrated in Supplemental Figure S1. Within each iteration, a fold was used for test and all remaining folds for training. Please note in either outer loop or inner loop, the training folds were resampled using SMOTE-NC and the training folds and the test fold were scaled with the aforementioned scaling method. Then we performed another inner 5-fold cross-validation for 5 times to exhaustively search the optimal set of parameters from predefined candidates using the grid search strategy by calculating the accuracy of each combination of parameters. The set of parameters that we searched included the ratio of selected features and the hyperparameters of the classifier of interest. We chose the combination of the highest ROC AUC to be the optimal set of parameters and applied them to our feature selection and training processes. The selected features were obtained from the training data. After training the model, we used the selected features of the test data to evaluate the trained model. In one outer loop 5-fold cross-validation, we repeated the classification procedure 5 times and obtained one cross-validation result. Lastly, the means and standard deviations of the results from the 100 times cross-validation were calculated and the frequency of each selected feature was identified. All experiments in this study were conducted using the scikit-learn package (version: 0.21.3) 34 which is a popular machine learning library.
Statistical Analysis
In analyzing the demographic information, clinical characteristics, and behavioral test scores, categorical data were assessed using Pearson chi-square or Fisher exact tests (when the expected number was ≤ 5), parametric data were assessed using the independent t test after normality testing by the Shapiro–Wilk test, and nonparametric data were assessed using the Mann–Whitney U-test (2-tailed significance level of .05). All analyses were conducted using SPSS 16.0 for Windows software (SPSS Inc., Chicago, IL), and statistical significance was set at P < .05.
Results
Participant Characteristics and Behavioral Evaluations
Participants’ demographic information, clinical characteristics, and behavioral test scores.
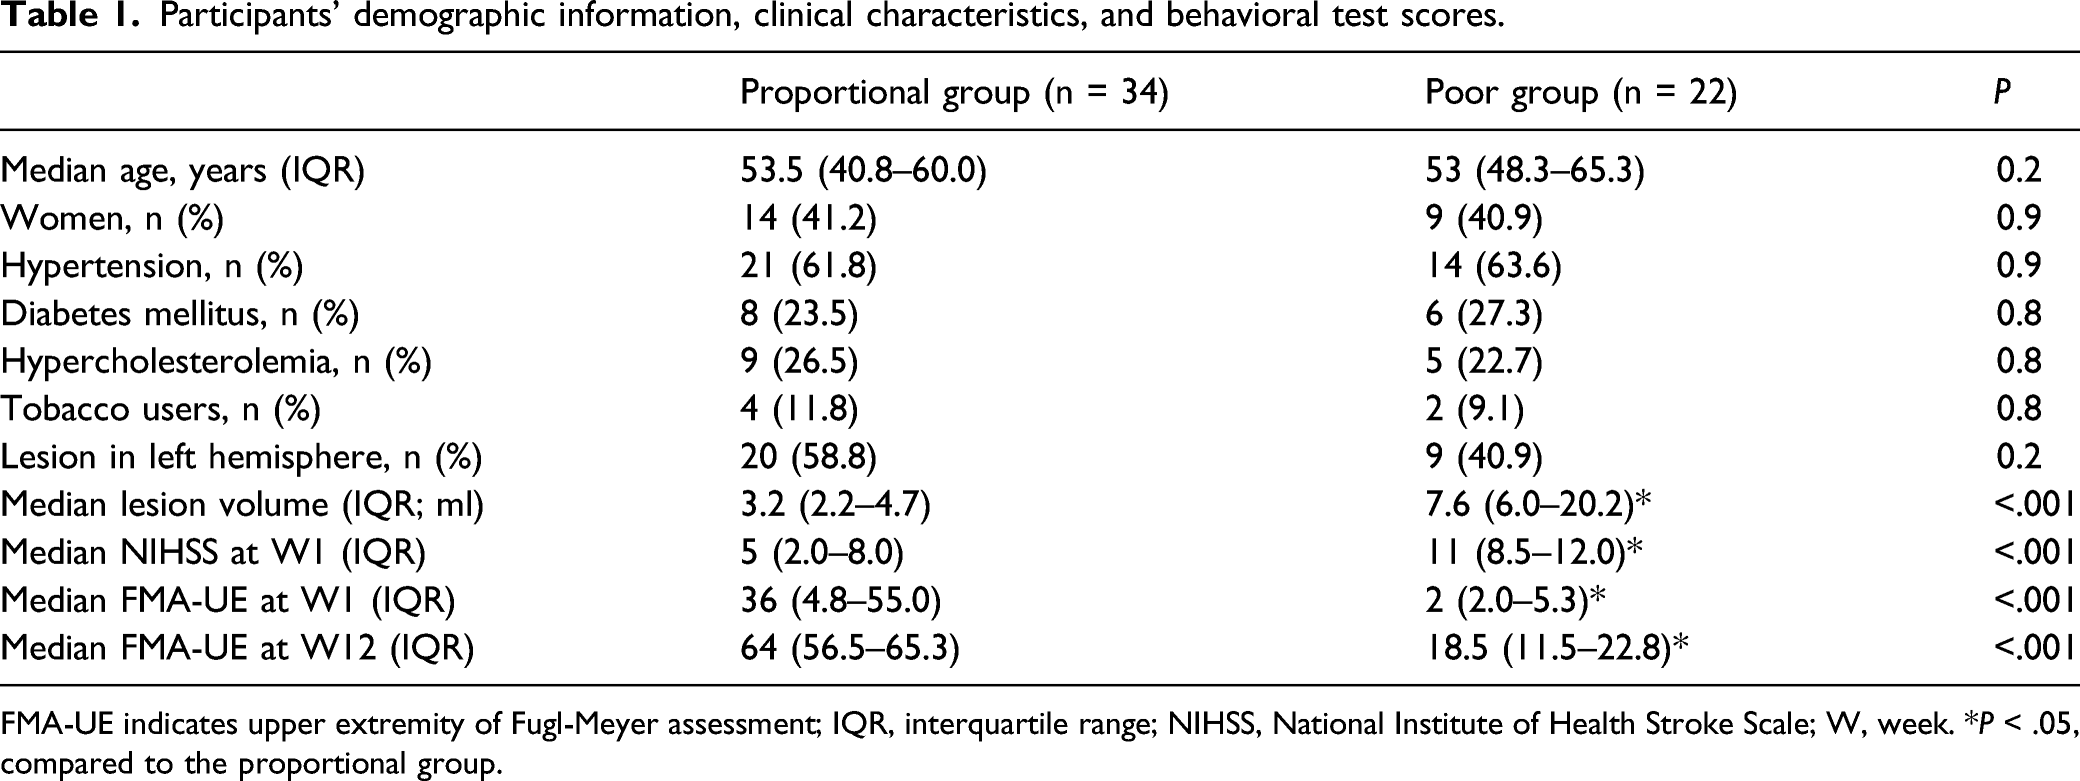
FMA-UE indicates upper extremity of Fugl-Meyer assessment; IQR, interquartile range; NIHSS, National Institute of Health Stroke Scale; W, week. *P < .05, compared to the proportional group.
The recovery of motor function after supratentorial subcortical infarction follows two different paths. (A) The model Δ Fugl-Meyer assessment of the upper extremity (FMA-UE) = .7 × (66 - FMA-UEimpairment), represented by a continuous line, predicted future FMA-UE improvement in most subjects (n = 34, filled circles), but there was a significant poor recovery subset (n = 22, unfilled circles). (B) Poor recovery patients were defined as cases with model residuals >15 (unfilled bars).
Classification Performance
The results of all classification experiments are shown in Supplemental Table S3. The proposed machine learning scheme, with CIFE being the feature selection approach, SMOTE-NC being the resampling strategy, and Bagging being the classification algorithm, achieved an overall balanced accuracy of 87.71% and an F1 of 84.43% when using a combination of baseline FMA-UE and baseline whole brain volumes to be the features. In addition, it yielded an accuracy of 93.77% in identifying patients with poor recovery (ie, sensitivity) and an accuracy of 81.65% in identifying patients with proportional recovery (ie, specificity). Compared with only using the FMA-UE score, adding brain volume features largely improved the classification performance, especially the overall balanced accuracy (from 80.88% to 87.71%), the F1 (from 77.04% to 84.43%), the PR AUC (from 61.99% to 75.52%), and the sensitivity (from 92.23% to 93.77%). Please note it is inappropriate to train a tree-based classifier with only one feature. We reported the results of using only the FMA-UE score for an ablation analysis purpose.
As shown in Supplemental Table S3, when making use of both types of features, CIFE benefited each of the two classification techniques. Specifically, CIFE increased the balanced accuracy of Bagging from 81.46% to 87.71% and that of GBDT from 76.99% to 83.5%. CIFE also increased the F1 and the ROC AUC of the two classification techniques in most experimental settings. However, in the same setting, ReliefF reduced the balanced accuracy of Bagging from 81.46% to 80.97% and that of GBDT from 76.99% to 74.49%. ReliefF also reduced the F1 and the ROC AUC of the two classification techniques. A similar pattern was also observed for the Bagging algorithm. In other words, regardless of the feature selection approaches, Bagging largely outperformed GBDT when jointly using the two types of features; 87.71% vs 83.5% when using CIFE for feature selection and 80.97% vs 74.49% when using ReliefF for feature selection. In our experiments, permutation tests are applied to statistically compare the results of different models, the P-values of which are listed in Supplemental Table S4. In most experimental settings, the proposed pipeline is better than other models. Such observations may well explain the superiority of the proposed “SMOTE-NC+CIFE+Bagging” scheme.
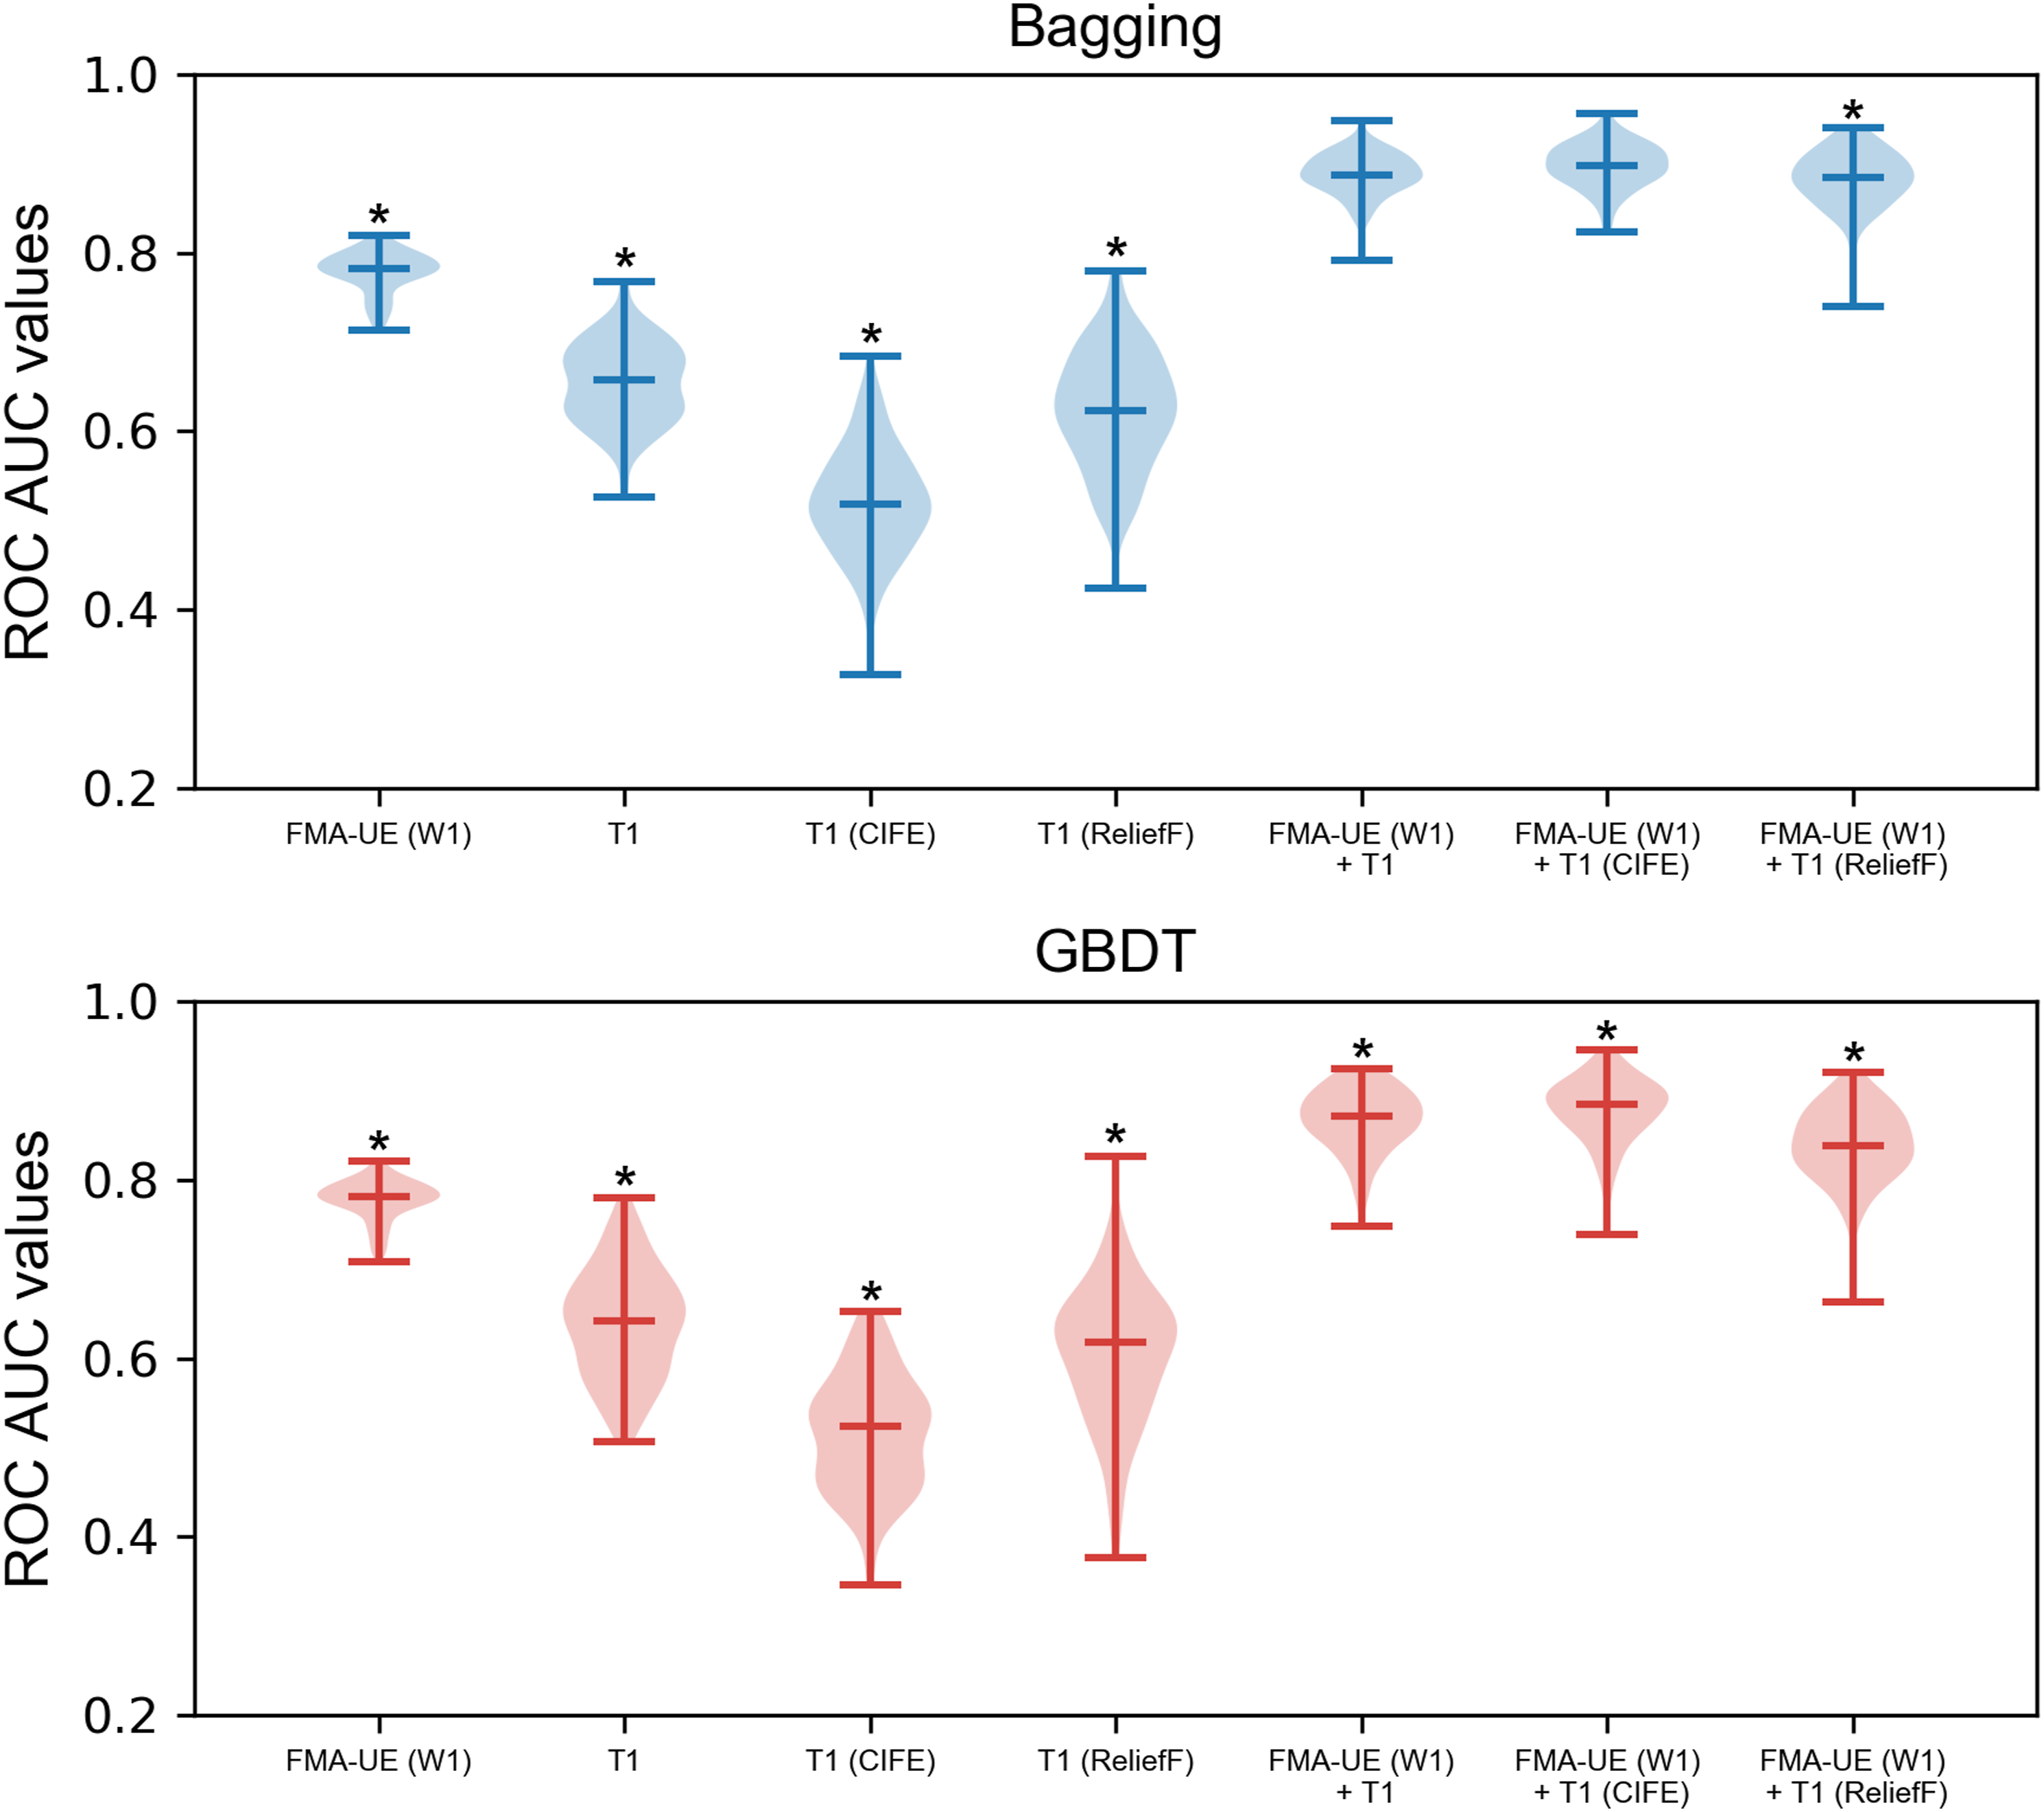
The frequency of each feature that had been selected in the proposed “SMOTE-NC+CIFE+Bagging” pipeline is listed in Supplemental Table S1. For a better visualization purpose, we show each brain region whose frequency is no smaller than .5 in Figure 4. The ROC AUC plots of the classification models with SMOTE-NC being the resampling strategy are presented in Figure 5. Clearly, the proposed pipeline is statistically significantly superior to other compared ones in most experimental settings. Visualization of each brain region whose frequency (relative importance) is no smaller than .5, as quantified by the color bar. L, left hemisphere; R, right hemisphere; x, the axial slice index. A violin plot for the minimum, maximum, median as well as the distribution of ROC AUC values of different models with SMOTE-NC. ROC AUC, area under the receiver operating characteristic curve; SMOTE-NC, Synthetic Minority Over-sampling Technique for Nominal and Continuous; FMA-UE, upper extremity Fugl-Meyer assessment score; W, week; CIFE, Conditional Infomax Feature Extraction; GBDT, Gradient Boosting Decision Tree. *P < .05, indicating that the proposed “SMOTE-NC+CIFE+Bagging” pipeline statistically outperforms that corresponding method.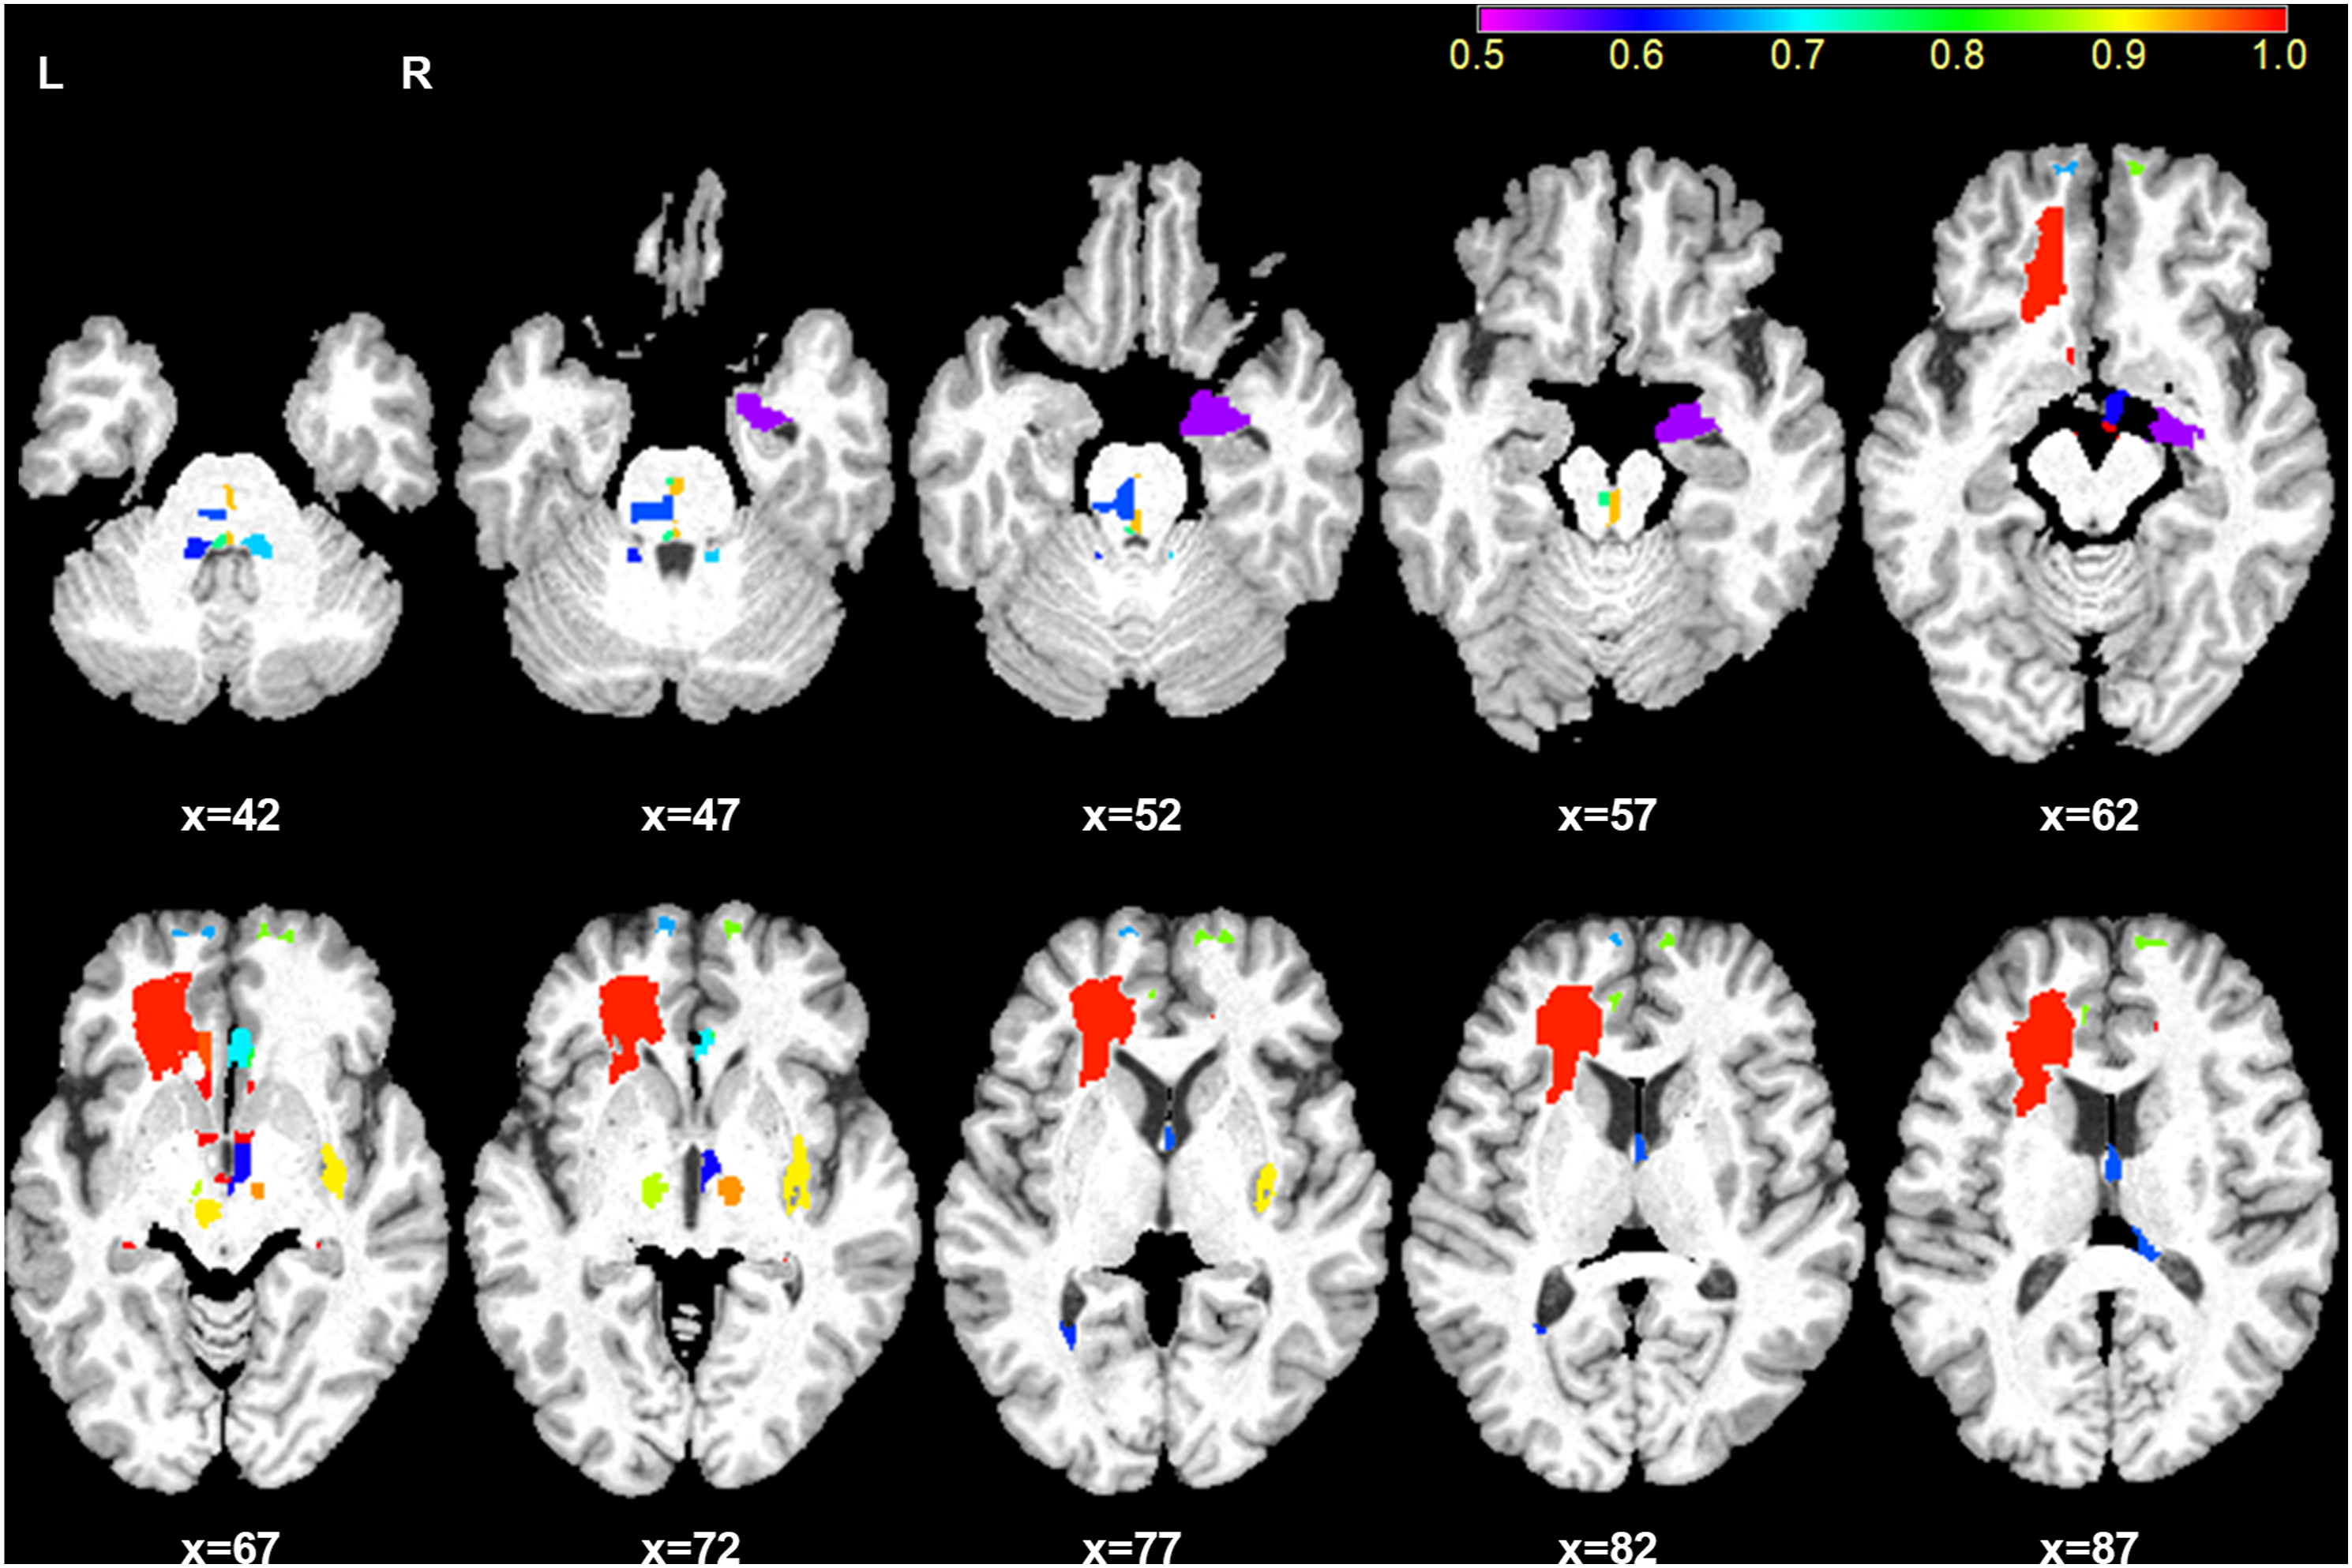
In this work, we also investigated the potential of clinical measures for prediction and that of lesion volume; Supplemental Table S5 shows the classification results of using clinical measures and brain volume/lesion volume; Supplemental Table S6 shows the classification results of using FMA-UE score and lesion volume. A combination of clinical measures and brain volume/lesion volume as well as a combination of FMA-UE score and lesion volume did not outperform our proposed “SMOTE-NC+CIFE+Bagging” pipeline
Discussion
In this study, we observed that either the motor score (FMA-UE) at admission or baseline whole brain volumes had a limited ability in predicting individual spontaneous improvement of motor function within 3 months after acute subcortical infarction. However, a combination of those 2 types of features can largely enhance the prediction power, together with sophisticated machine learning techniques, especially in identifying patients with poor recovery.
We found that patients with poor recovery had greater initial motor impairments and larger stroke lesion sizes at the acute stage and had less motor improvements within 3 months after supratentorial subcortical infarction compared to patients with proportional recovery. These findings are in line with recent DTI studies showing that early damages, especially those in terms of the CST integrity, may account for acute motor impairment and subsequent recovery patterns after stroke.7,35,36 Previous structural MRI studies confirmed that the only consistently replicated predictor of the motor behavioral consequences of stroke is the lesion location. The resolution of motor impairment after stroke depends more on the extent to which lesions interfere with descending CST rather than lesion volumes.5,10,14 These existing evidences may to some extent explain our finding that brain volumes within the first week after stroke had a limited power in predicting long-term motor outcomes. However, it has also been reported that baseline gray matter and white matter volumes in task-related brain regions could predict individual performance improvements after motor skill learning in healthy subjects 16 and that baseline whole brain volumes could be used to predict subsequent changes in cognitive performance in healthy elderly women and disability progression and cognitive dysfunction in patients with multiple sclerosis, indicating brain volumes’ discriminating ability. In this study, compared with using motor score at admission only, the accuracy of predicting individual motor improvement within 3 months poststroke was improved substantially when also simultaneously using brain volumes in the acute phase of stroke as the discriminating features.
There are several other interesting findings that are worthy of mentioning. First, when using the SMOTE-NC strategy, the overall performance was enhanced in most experimental settings, indicating that SMOTE-NC is effective for class balance. Second, for each of the 2 classification techniques, feature selection did not really improve the performance when only utilizing brain volumes to serve as the classification features. A plausible reason is that the prediction power of baseline whole brain volumes themselves might be very limited, even after feature selection.
In this study, we also reported the frequency of each of the brain structures that had been selected to belong to the optimal set of features (Supplemental Table S1). According to the frequency of each feature that had been selected in the proposed “SMOTE-NC+CIFE+Bagging” pipeline, the bilateral fimbria, the mammillary body, the subcortical white matter of the subgenual anterior cingulate cortex, and the right subcortical white matter of the rostral anterior cingulate cortex were identified to be the most predictive regions. These regions nevertheless did not overlap with the lesioned areas. The frequency may to some degree implicitly indicate correlation between the corresponding brain structure and motor function recovery after stroke. The fimbria that serves as one of the subregions of fornix, the mammillary body, and the anterior cingulate cortex are components of Papez circuit, which is a central pathway of the limbic system that is involved in memory processing. 37 Unfortunately, we found that the baseline volume measures of motor-related areas had relatively limited ability to predict individual motor outcome after stroke compared to cognitive-related areas. Although the exact mechanism is not thoroughly clear, the importance of cognitive ability for the recovery of motor function after stroke has been extensively reported.38,39 Furthermore, cognitive strategy-based interventions have been confirmed to improve the recovery of motor function in patients with stroke.40,41 Based on recent findings, the plastic changes of brain structures that occurred during spontaneous motor recovery after subcortical stroke were primarily located in cognitive-related brain areas.42-44 Structural plasticity of motor-related areas is more likely to occur after patients receive specific motor task-based interventions following stroke.45,46 Taken all together, our findings indicate that the baseline brain volumes of cognitive-related areas might have an important role in the spontaneous recovery of motor function after subcortical stroke. However, whether these structures experienced plastic alterations during motor recovery or after stroke remain unknown. Future studies should be conducted to clarify this point.
Obviously, there is no single machine learning scheme that consistently performs well in all tasks. Our results revealed that the proposed “SMOTE-NC+CIFE+Bagging” scheme was superior to other combinations of resampling, feature selection, and classification techniques when using the two types of features, indicating this scheme is more suitable for the two types of features. Both Bagging and GBDT are based on decision tree but have different ensemble strategies. In our experiments, the Bagging algorithm was superior to GBDT when using a combination of the two types of features, regardless of the feature selection approach.
Previous studies have tried to use clinical and/or image-based features to predict motor recovery or motor outcome after stroke. For example, Weimar et al 47 employed a logistic regression model to predict a good-versus-poor functional outcome in 1754 patients with acute stroke using only clinical features consisting of age, gender, prior stroke, right and left arm paresis at admission, diabetes, NIHSS at admission, fever, Rankin Scale 48–72 hours later, neurological complications, and lenticulostriate infarction, with an accuracy of 80.7% having been obtained. This suggests that using clinical information alone may not accurately predict dichotomized functional outcomes after stroke. As such, an additional inclusion of image-based features might enhance the prediction accuracy. In a previous structural MRI study, Feng et al 5 conducted a multivariate regression analysis, with the initial motor impairment (FMA-UE), CST lesion load, age, race, gender, days of therapy, reperfusion therapy and lesion volume being the multiple predictors and the motor outcome at 3 months poststroke being the response, in 76 first-ever acute ischemic stroke patients. They found that only the initial FMA-UE score and CST lesion load were significant predictors and they together explained 81% of the variance in the motor outcome at 3 months poststroke. Compared with the aforementioned studies, our prediction model required fewer clinical data and achieved a higher accuracy than using clinical data alone. Only FMA-UE and T1-weighted image of a patient at baseline were needed to make an accurate future prediction, which could help lighten the burden on clinicians. Previously, 2 DTI studies utilizing multivariate logistic regression confirmed that a combination of initial clinical behavioral biomarkers and local diffusion homogeneity in the ipsilesional CST, particularly at the posterior limb of the internal capsule, or CST asymmetry can successfully discriminate between proportional recovery and poor recovery patients at 3 months after acute ischemic stroke, with overall accuracies of 82.4% and 80% having been achieved.7,8 Additionally, multivariate support vector machine analyses based on a combination of task-related fMRI activity for voluntary movements of the affected hand and assessment of motor performance at the acute stage successfully classified good-versus-poor motor outcomes at 4-6 months after stroke with an accuracy of 86% and a sensitivity of 90%. 9 In our study, imaging data processing was simpler than that in studies using DTI, task-related fMRI, or other structural MRI biomarkers. T1-weighted images could be automatically processed with the braingps pipeline.
Some previous studies have also employed decision trees to predict motor outcome after stroke, exhibiting certain similarities with this work. For example, Stinear et al 48 integrated baseline clinical variables and age into a classification and regression tree (CART) to predict upper limb function after 3 months after stroke (excellent, good, limited, or poor). Compared with our proposed pipeline, they did not utilize any resampling strategy, feature selection approach nor ensemble technique. However, both of us used CART; we employed it as the decision tree model in the Bagging algorithm. Tozlu et al 49 employed SMOTE resampling and 5 classification algorithms (elastic net, random forest, artificial neural network, support vector machine, and CART) to predict upper limb outcome (responder or nonresponder) with demographic and baseline clinical data. In our pipeline, we only employed CART, but in an ensembling fashion. In addition to the methodological differences, the clinical variables and patient division criteria of those studies were also different from ours. For comparison with those works, we have conducted additional experiments using their decision tree-based pipelines, but with features remaining the same (a combination of FMA-UE and whole brain volumes). The comparison results are shown in Supplemental Table S7. Apparently, our proposed pipeline significantly outperforms theirs.
Our machine learning pipeline provided not only a state-of-the-art balanced accuracy (87.71%) in predicting individual motor outcome after stroke but also a high accuracy of 93.77% in identifying patients with poor recovery (i.e., high sensitivity). However, there are still several potential limitations of this study. First, our sample size is limited. Only 56 patients were enrolled in our experiments. However, we have fully employed cross-validation strategies, namely multiple two-tier cross-validation experiments, to improve the robustness and reliability of the presented observations. Our findings may motivate future studies with larger sample sizes. Second, in this study, our findings cannot be readily generalized to the wider population of all patients with stroke because our study sample consisted of only patients with first supratentorial subcortical infarction who were oriented and able to communicate. One of our future research plans is to enlarge the sample size and recruit patients with other types of stroke. Last, we only considered discriminating the proportional recovery group from the poor recovery group. Making use of regression analyses to predict the exact motor score of each individual patient is our next research focus.
In summary, we here show that a combination of motor score and brain volume measures from T1-weighted MRI, together with a sophisticated machine learning scheme, can accurately and reliably predict individual motor improvement within 3 months after acute subcortical infarction. Our prediction model requires less clinical data and relatively simple imaging data processing, demonstrating the clinical practicability of our approach for acute, disabled patients with supratentorial subcortical infarction. Our proposed methodology should be tested in the future in terms of its potential for offering noninvasive diagnostic markers to predict cognitive and language outcomes and to optimize rehabilitation procedures after stroke.
Supplemental Material
sj-pdf-1-nnr-10.1177_15459683211054178 – Supplemental Material for Machine Learning for Predicting Motor Improvement After Acute Subcortical Infarction Using Baseline Whole Brain Volumes
Supplemental Material, sj-pdf-1-nnr-10.1177_15459683211054178 for Machine Learning for Predicting Motor Improvement After Acute Subcortical Infarction Using Baseline Whole Brain Volumes by Gang Liu, Jiewei Wu, Chao Dang, Shuangquan Tan, Kangqiang Peng, Yaomin Guo, Shihui Xing, Chuanmiao Xie, Jinsheng Zeng and Xiaoying Tang in Neurorehabilitation and Neural Repair
Footnotes
Declaration of Conflicting Interests
The author(s) declared no potential conflicts of interest with respect to the research, authorship, and/or publication of this article.
Funding
The author(s) disclosed receipt of the following financial support for the research, authorship, and/or publication of this article: This work was supported by the National Key R&D Program of China (2017YFC1307500 and 2017YFC0112404), the National Natural Science Foundation of China (62071210, 81600998, 81601522, 81501546, 81771137, and 81971103), the Shenzhen Basic Research Program (JCYJ20190809120205578), the High-level University Fund (G02236002), the Key-Area Research and Development Program of Guangdong Province (2018B030340001), the Natural Science Foundation of Guangdong Province (2016A030310132 and 2021A1515010600), the Sun Yat-sen University Clinical Research 5010 Program (2018001), the Guangdong Provincial Key Laboratory of Diagnosis and Treatment of Major Neurological Diseases (2020B1212060017), the Southern China International Cooperation Base for Early Intervention and Functional Rehabilitation of Neurological Diseases (2015B050501003 and 2020A0505020004), Guangdong Provincial Engineering Center for Major Neurological Disease Treatment, and Guangdong Provincial Translational Medicine Innovation Platform for Diagnosis and Treatment of Major Neurological Disease.
Supplementary Material
Supplemental material for this article is available online.
References
Supplementary Material
Please find the following supplemental material available below.
For Open Access articles published under a Creative Commons License, all supplemental material carries the same license as the article it is associated with.
For non-Open Access articles published, all supplemental material carries a non-exclusive license, and permission requests for re-use of supplemental material or any part of supplemental material shall be sent directly to the copyright owner as specified in the copyright notice associated with the article.