
Abstract
Background. Patients with Parkinson’s disease (PD) are highly vulnerable to develop cognitive dysfunctions, and the mitigating potential of early cognitive training (CT) is increasingly recognized. Predictors of CT responsiveness, which could help to tailor interventions individually, have rarely been studied in PD. This study aimed to examine individual characteristics of patients with PD associated with responsiveness to targeted working memory training (WMT). Methods. Data of 75 patients with PD (age: 63.99 ± 9.74 years, 93% Hoehn & Yahr stage 2) without cognitive dysfunctions from a randomized controlled trial were analyzed using structural equation modeling. Latent change score models with and without covariates were estimated and compared between the WMT group (n = 37), who participated in a 5-week adaptive WMT, and a waiting list control group (n = 38). Results. Latent change score models yielded adequate model fit (χ2-test p > .05, SRMR ≤ .08, CFI ≥ .95). For the near-transfer working memory composite, lower baseline performance, younger age, higher education, and higher fluid intelligence were found to significantly predict higher latent change scores in the WMT group, but not in the control group. For the far-transfer executive function composite, higher self-efficacy expectancy tended to significantly predict larger latent change scores. Conclusions. The identified associations between individual characteristics and WMT responsiveness indicate that there has to be room for improvement (e.g., lower baseline performance) and also sufficient “hardware” (e.g., younger age, higher intelligence) to benefit in training-related cognitive plasticity. Our findings are discussed within the compensation versus magnification account. They need to be replicated by methodological high-quality research applying advanced statistical methods with larger samples.
Keywords
Introduction
Parkinson’s disease (PD) is the second most frequent neurodegenerative disorder of older age, with around 20% of patients showing mild cognitive impairment (PD-MCI) even at time of PD diagnosis 1 and up to 80% developing PD dementia in course of their disease. 2 Non-pharmacological interventions such as cognitive training (CT) are increasingly discussed to prevent or delay cognitive impairment and the progression to PD dementia.3,4
As working memory (WM) has been ascribed the role of a processing resource for other cognitive abilities 5 and is a vulnerable function in healthy aging, 6 WM has already become a main target for CT in healthy older adults. In this population, recent meta-analyses7-9 on WM training (WMT) reveal significant positive training effects in trained tasks and near-transfer (i.e., untrained WM) tasks. However, the debate on the degree of far-transfer effects (i.e., effects in untrained domains) is unsolved, questioning the practical importance of WMT.7-9 Notably, WM and executive functions belong to the most vulnerable cognitive domains in PD. 10 Furthermore, targeted WMT in healthy individuals has been associated with changes in frontoparietal and subcortical neural networks and particularly dopaminergic functions11,12—neural networks and neurotransmitter systems on the one hand directly associated with WM, 13 on the other hand, especially vulnerable in PD. 14 Therefore, first randomized controlled trials (RCTs) on targeted WMT in PD have been conducted recently.15,16
However, evidence on the effectiveness of WMT in PD is limited to direct training and partial near-transfer effects15-17 and the degree of far-transfer effects is unclear. Furthermore, even within near-transfer effects, responsiveness to training is highly heterogeneous, with some patients improving stronger than others, some patients maintaining, and others even decreasing their performance. 16 Individual differences in cognitive plasticity might be able to explain this variance.18,19 Identifying such predictors of WMT responsiveness could promote the movement away from a one-treatment-suits-all-approach to the development of a “personalized” or “stratified” precision medicine in the context of the broad spectrum of CT interventions.20,21
Importantly, prognostic research might be especially reasonable in the context of large heterogeneity among treatment effects: This heterogeneity could lead to very small insignificant and even null effects reported in single trials as well as meta-analyses, as effects in opposite directions between participants might eliminate overall reported effects. Prognostic research then bears the potential to identify predictors of treatment responsiveness to answer the question, if there are systematic relationships between individual characteristics and treatment response. One could argue that conducting prognostic analyses on null effects might be dealing with pure noise. However, the adherence to high methodological standards,20,22 for example, by comparing prognostic factors between a control group and the group receiving the treatment of interest, allows prognostic research to detangle unsystematic fluctuations and predictors of systematic retest effects, such as practice effects or regression to the mean, from predictors of treatment response.
Previous studies in healthy aging have, for example, investigated baseline performance, intelligence, age, and education as possible predictors of WMT responsiveness. 23 The results were summarized in a recent systematic review, 23 indicating large heterogeneity and several methodological shortcomings across studies. Even though only an elaborated individual participant data meta-analysis will be able to overcome the current research gaps regarding both general effectiveness and mechanisms of WMT responsiveness in healthy aging, the available evidence so far indicated that individuals with lower baseline performance, less education, younger age, and higher intelligence seemed to benefit most from WMT. Furthermore, motivational processes seem to constitute an important variable regarding CT success in healthy older adults. 24
Fellman and colleagues 15 investigated predictors of direct WMT effects in PD. Trained task improvement over the course of WMT was positively predicted by higher baseline general cognitive abilities, higher education, and shorter disease duration. Others, however, found lower baseline performance25,26 or longer disease duration27,28 to be positive predictors for CT responsiveness in PD. Notably, the applied statistical methods were highly heterogeneous ranging from simple correlational approaches and group comparisons to advanced methods such as growth curve analyses.
By analyzing data of an RCT on the effectiveness of WMT in PD, 16 the aim of this study was to investigate individual characteristics associated with WMT responsiveness in PD, including both posttest and 3-month follow-up data, with an advanced statistical approach, that is, structural equation modelling (SEM). Since previous research in this field is inconclusive and data are rare, we pursue a rather exploratory approach, and no directional hypotheses were formulated. We investigated predictors of immediate versus 3-month follow-up WMT responsiveness separately for near-transfer and far-transfer outcomes, as underlying mechanisms might be heterogeneous and their analysis will further help to develop individualized interventions strengthening cognition in the long term.
Methods
Study Design
The original study was designed as a single-blind RCT to evaluate the effects of a 5-week computerized WMT compared with a waiting list control group (CG). Clinical and neuropsychological assessment took place at baseline, the week after the 5-week training/waiting period (posttest, 5.67 ± 0.58 weeks after baseline), and at 3-month follow-up (14.03 ± 0.86 weeks after posttest). Patients were recruited via the University Hospital of Cologne, Germany, as well as regional neurologists and PD support groups. During all assessments, patients were on their regular medication. Outcome assessors were blinded for group allocation, patients were not.
Summarizing the results of the 2 prior publications on the neuropsychological and clinical outcomes in this trial, statistically significant positive training effects for the WMT group compared with the CG were reported in the WM domain only.16,17 Reliable far-transfer effects in cognitive and clinical variables were not found for either point of time. However, variability of training effects was large across participants with some patients improving over time and some patients remaining stable or even showing declined performance over time. 16 The WMT effect on neural correlates investigated with a newly developed WM paradigm and functional MRI was small, but decreased activation in areas relevant for working memory could be observed, with activation changes correlating with behavioral change. 29 Further details are reported in Ophey and colleagues 16 and Giehl and colleagues.17,29
Standard Protocol Approvals, Registrations, and Patient Consents
The study protocol was approved by the local ethics committee of the Medical Faculty of the University of Cologne (vote-no.16-043), conducted in compliance with the Helsinki Declaration of 1975, as revised in 2008, and registered with the German Clinical Trials Register (drks.de, DRKS00009379). Before the baseline assessment, all participants gave written informed consent for participation. The reporting of the original RCT 16 followed the CONSORT (Consolidated Standards of Reporting Trials) guidelines.
Participants
Inclusion criteria for study participation were age between 45 and 85 years, diagnosis of idiopathic PD according to UK brain bank criteria, 30 and normal or corrected-to-normal vision and hearing. Exclusion criteria were cognitive dysfunctions according to the level-II diagnostic criteria for PD-MCI 31 or PD dementia, 32 severe depressive symptoms operationalized by the Geriatric Depression Scale (GDS ≥ 11), 33 deep brain stimulation and other reported psychiatric, neurological, and life-threatening diseases. Included patients were randomized to either the WMT group (n = 37) or CG (n = 39). 75 of these 76 patients completed the posttest, and 72 patients completed the 3-month follow-up. For details on inclusion and exclusion criteria, see Ophey and colleagues, 16 and for details on study flow, refer to the flow chart in Figure 1.
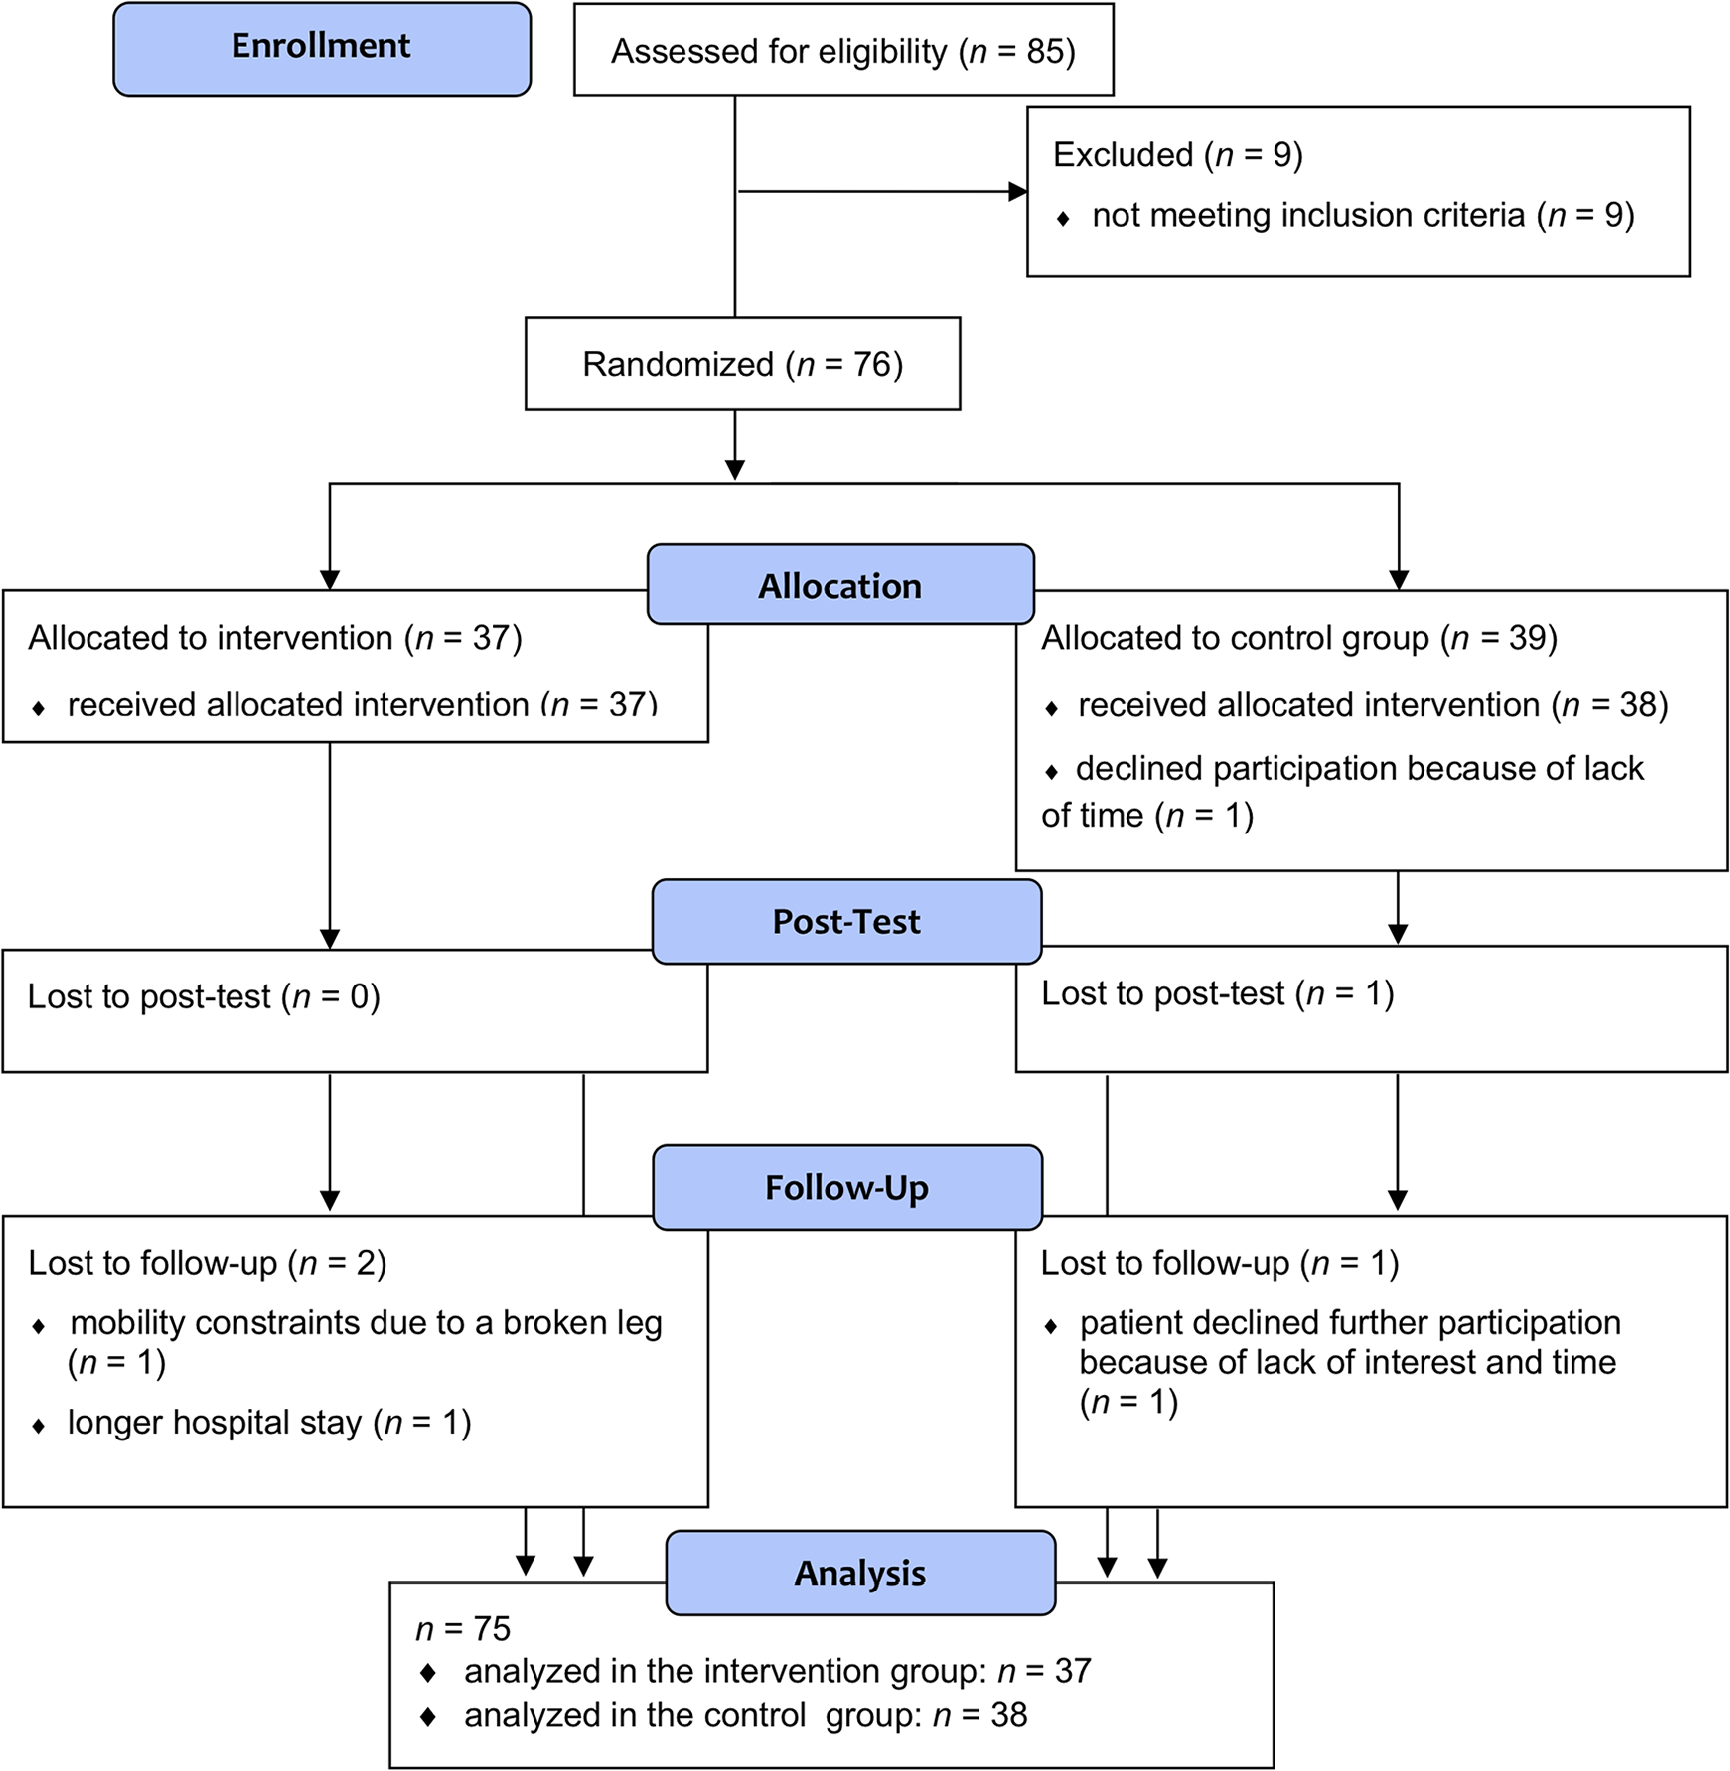
Flowchart: Enrollment, treatment allocation, posttest, and 3-month follow-up of study participants.
For this post hoc analysis, we included all patients for which at least one follow-up assessment was carried out (i.e., posttest and/or 3-month follow-up). Therefore, our final sample consisted of n = 37 patients in the WMT group, n = 38 patients in the CG. On average, our patients (47% female) were 63.99 ± 9.74 years old, and diagnosed with PD 6.36 ± 5.39 years ago, with the wide majority of patients showing mild to moderate motor impairment (93% Hoehn & Yahr stage 2, Unified Parkinson’s Disease Rating Scale–III, UPDRS-III, 16.81 ± 8.28). Further details on patient characteristics can be obtained from Table 1.
Patient Characteristics. a
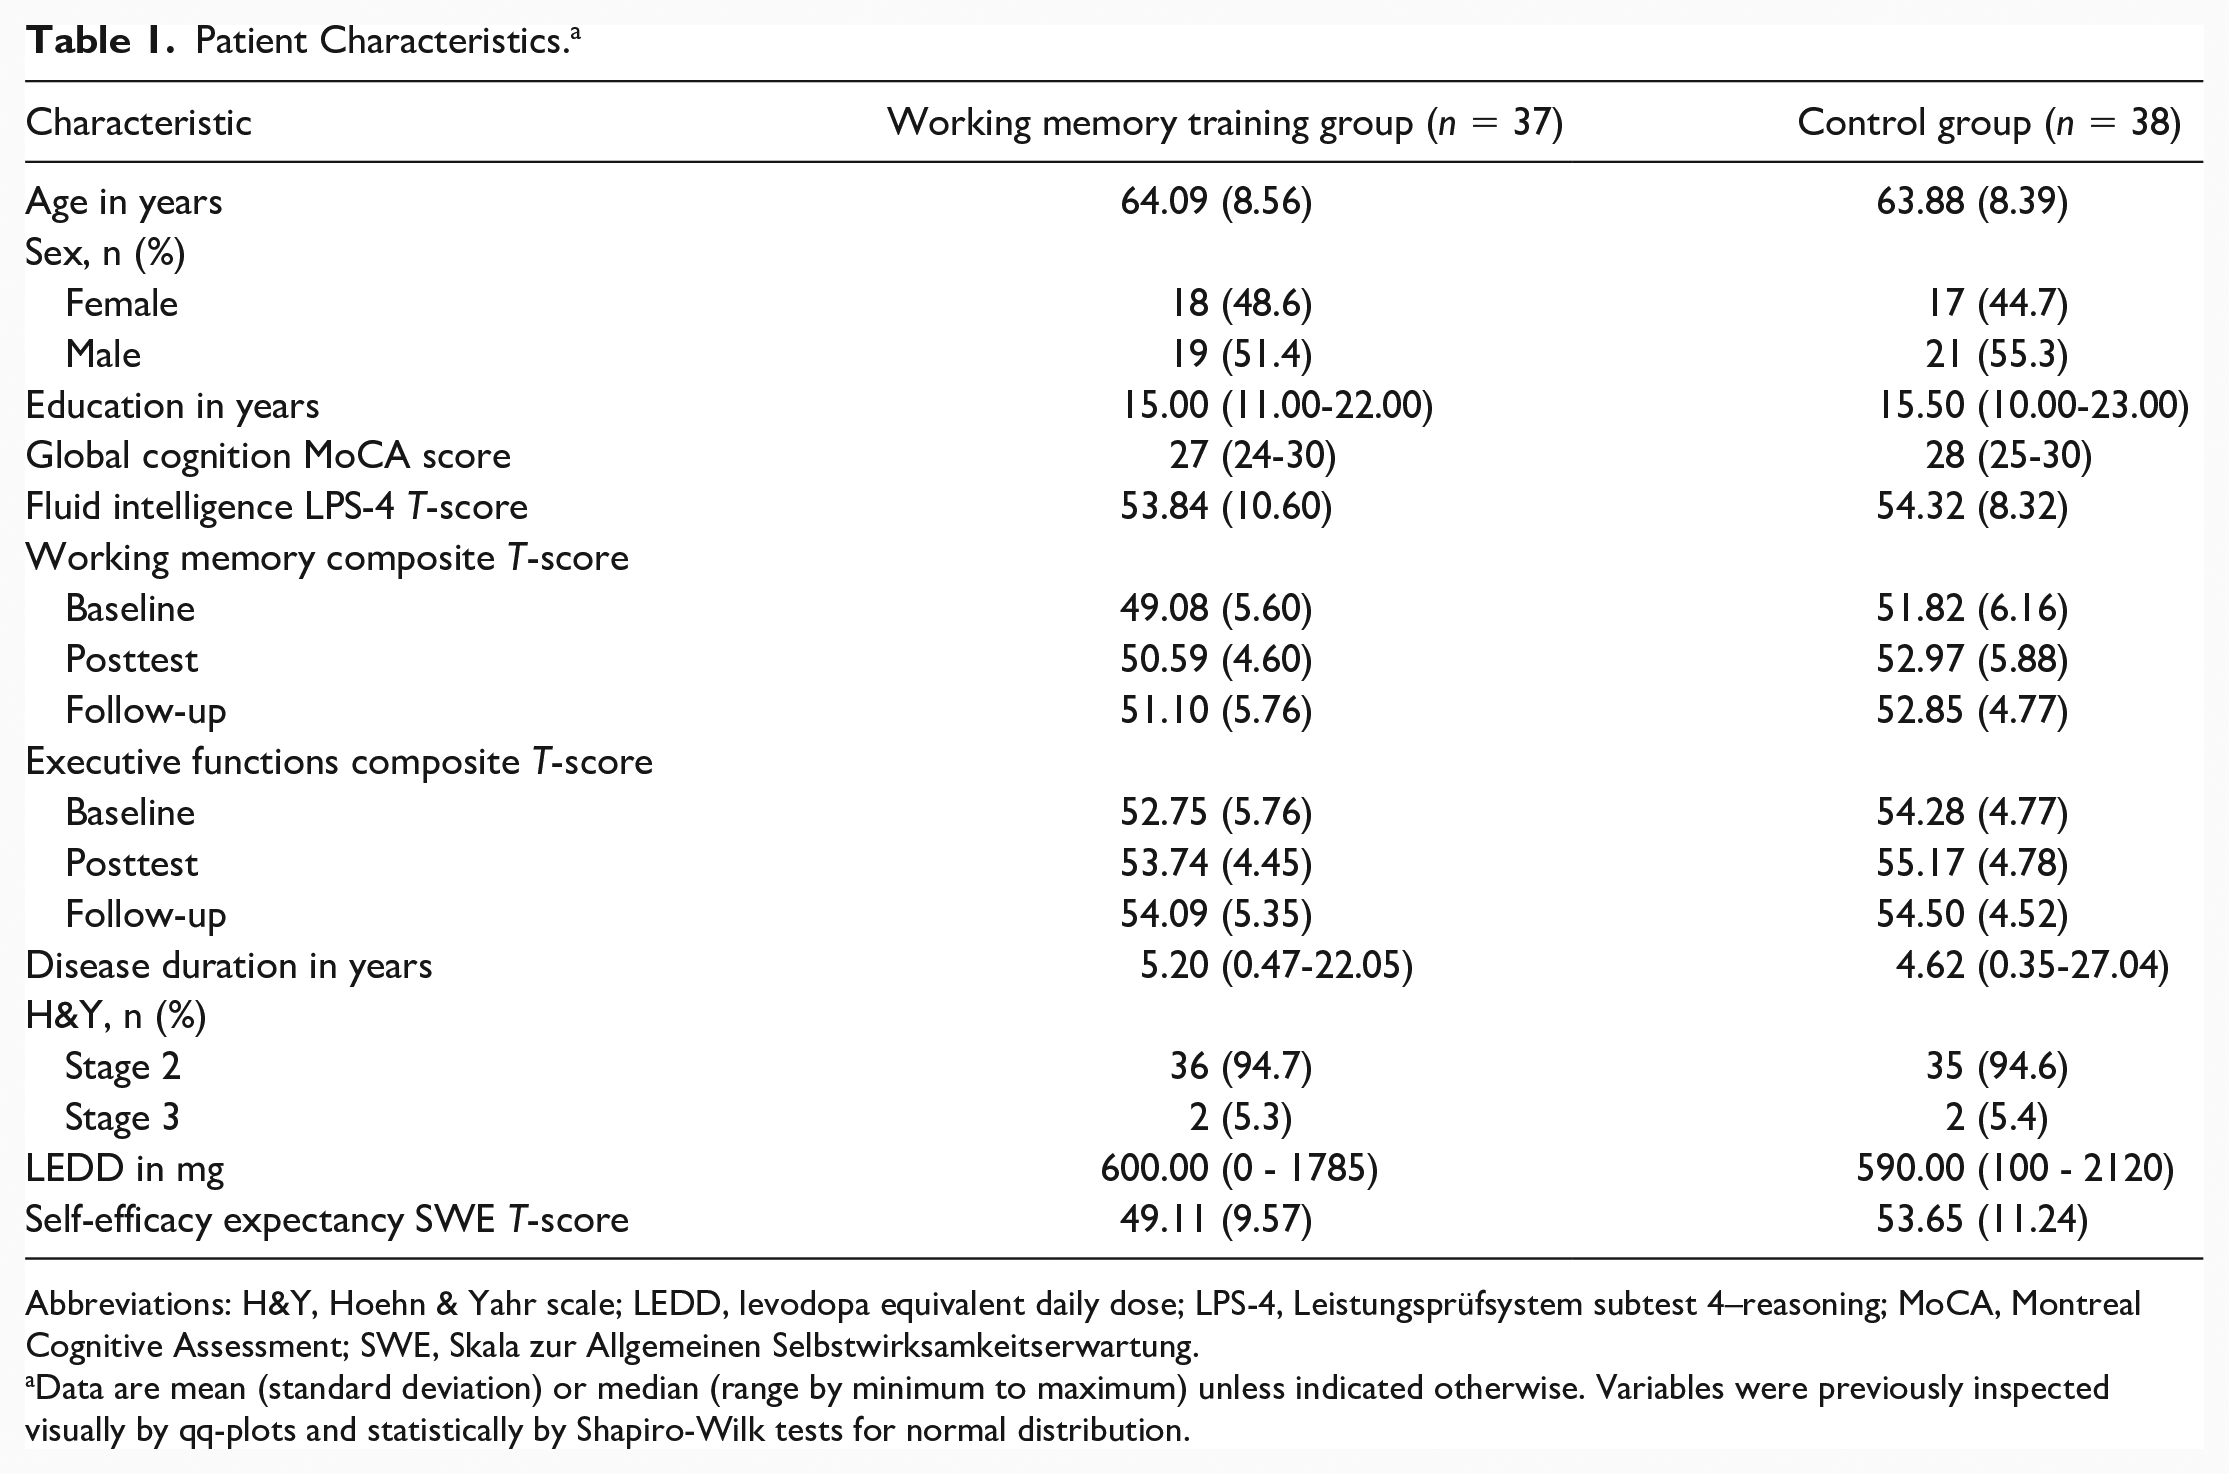
Abbreviations: H&Y, Hoehn & Yahr scale; LEDD, levodopa equivalent daily dose; LPS-4, Leistungsprüfsystem subtest 4–reasoning; MoCA, Montreal Cognitive Assessment; SWE, Skala zur Allgemeinen Selbstwirksamkeitserwartung.
Data are mean (standard deviation) or median (range by minimum to maximum) unless indicated otherwise. Variables were previously inspected visually by qq-plots and statistically by Shapiro-Wilk tests for normal distribution.
Intervention
The computerized WMT consisted of 5 varying WM tasks per training session selected out of a total of 9 different WM tasks based on the online CT program NeuroNation (Synaptikon GmbH, Berlin, Germany). The WMT was accessed online and administered at home for 30 minutes a day, 5 days a week, over 5 weeks and adapted to user performance across training sessions. More details are described in Ophey and colleagues. 16 No training was applied between posttest and 3-month follow-up. The CG was a waiting list CG and was granted access to the WMT after their last follow-up.
Statistical Analysis
All statistical analyses were conducted in R (https://www.r-project.org). SEM was carried out using the R package lavaan. The R code can be obtained from Supplementary Material 1. We fitted latent difference score models (LDSM), where the difference between the measured outcome at posttest and baseline (or 3-month follow-up and baseline), that is, the change through WMT, is represented as a latent variable (Δposttest, Δfollow-up). The measured outcome at posttest or 3-month follow-up in turn is the sum of the measured outcome at baseline and the corresponding latent difference score.
To specify this in terms of SEM,* as represented in Figure 2a for the basic LDSM, both, the path coefficients from baseline to posttest/3-months follow-up and from the latent difference score to the measured outcome at the respective point of time, are set equal to 1. By setting the intercepts and residuals for measured outcomes at posttest and 3-months follow-up equal to 0, the estimated intercept of Δposttest/Δfollow-up (α i ) represents the average observed difference score at the respective point of time, and the estimated variance (ψ i,i ) of Δposttest/Δfollow-up represents the variability of the change through training. The covariance (ψi-1,i) between baseline and Δposttest/Δfollow-up represents the correlation between the measured outcome at baseline and the change through training.
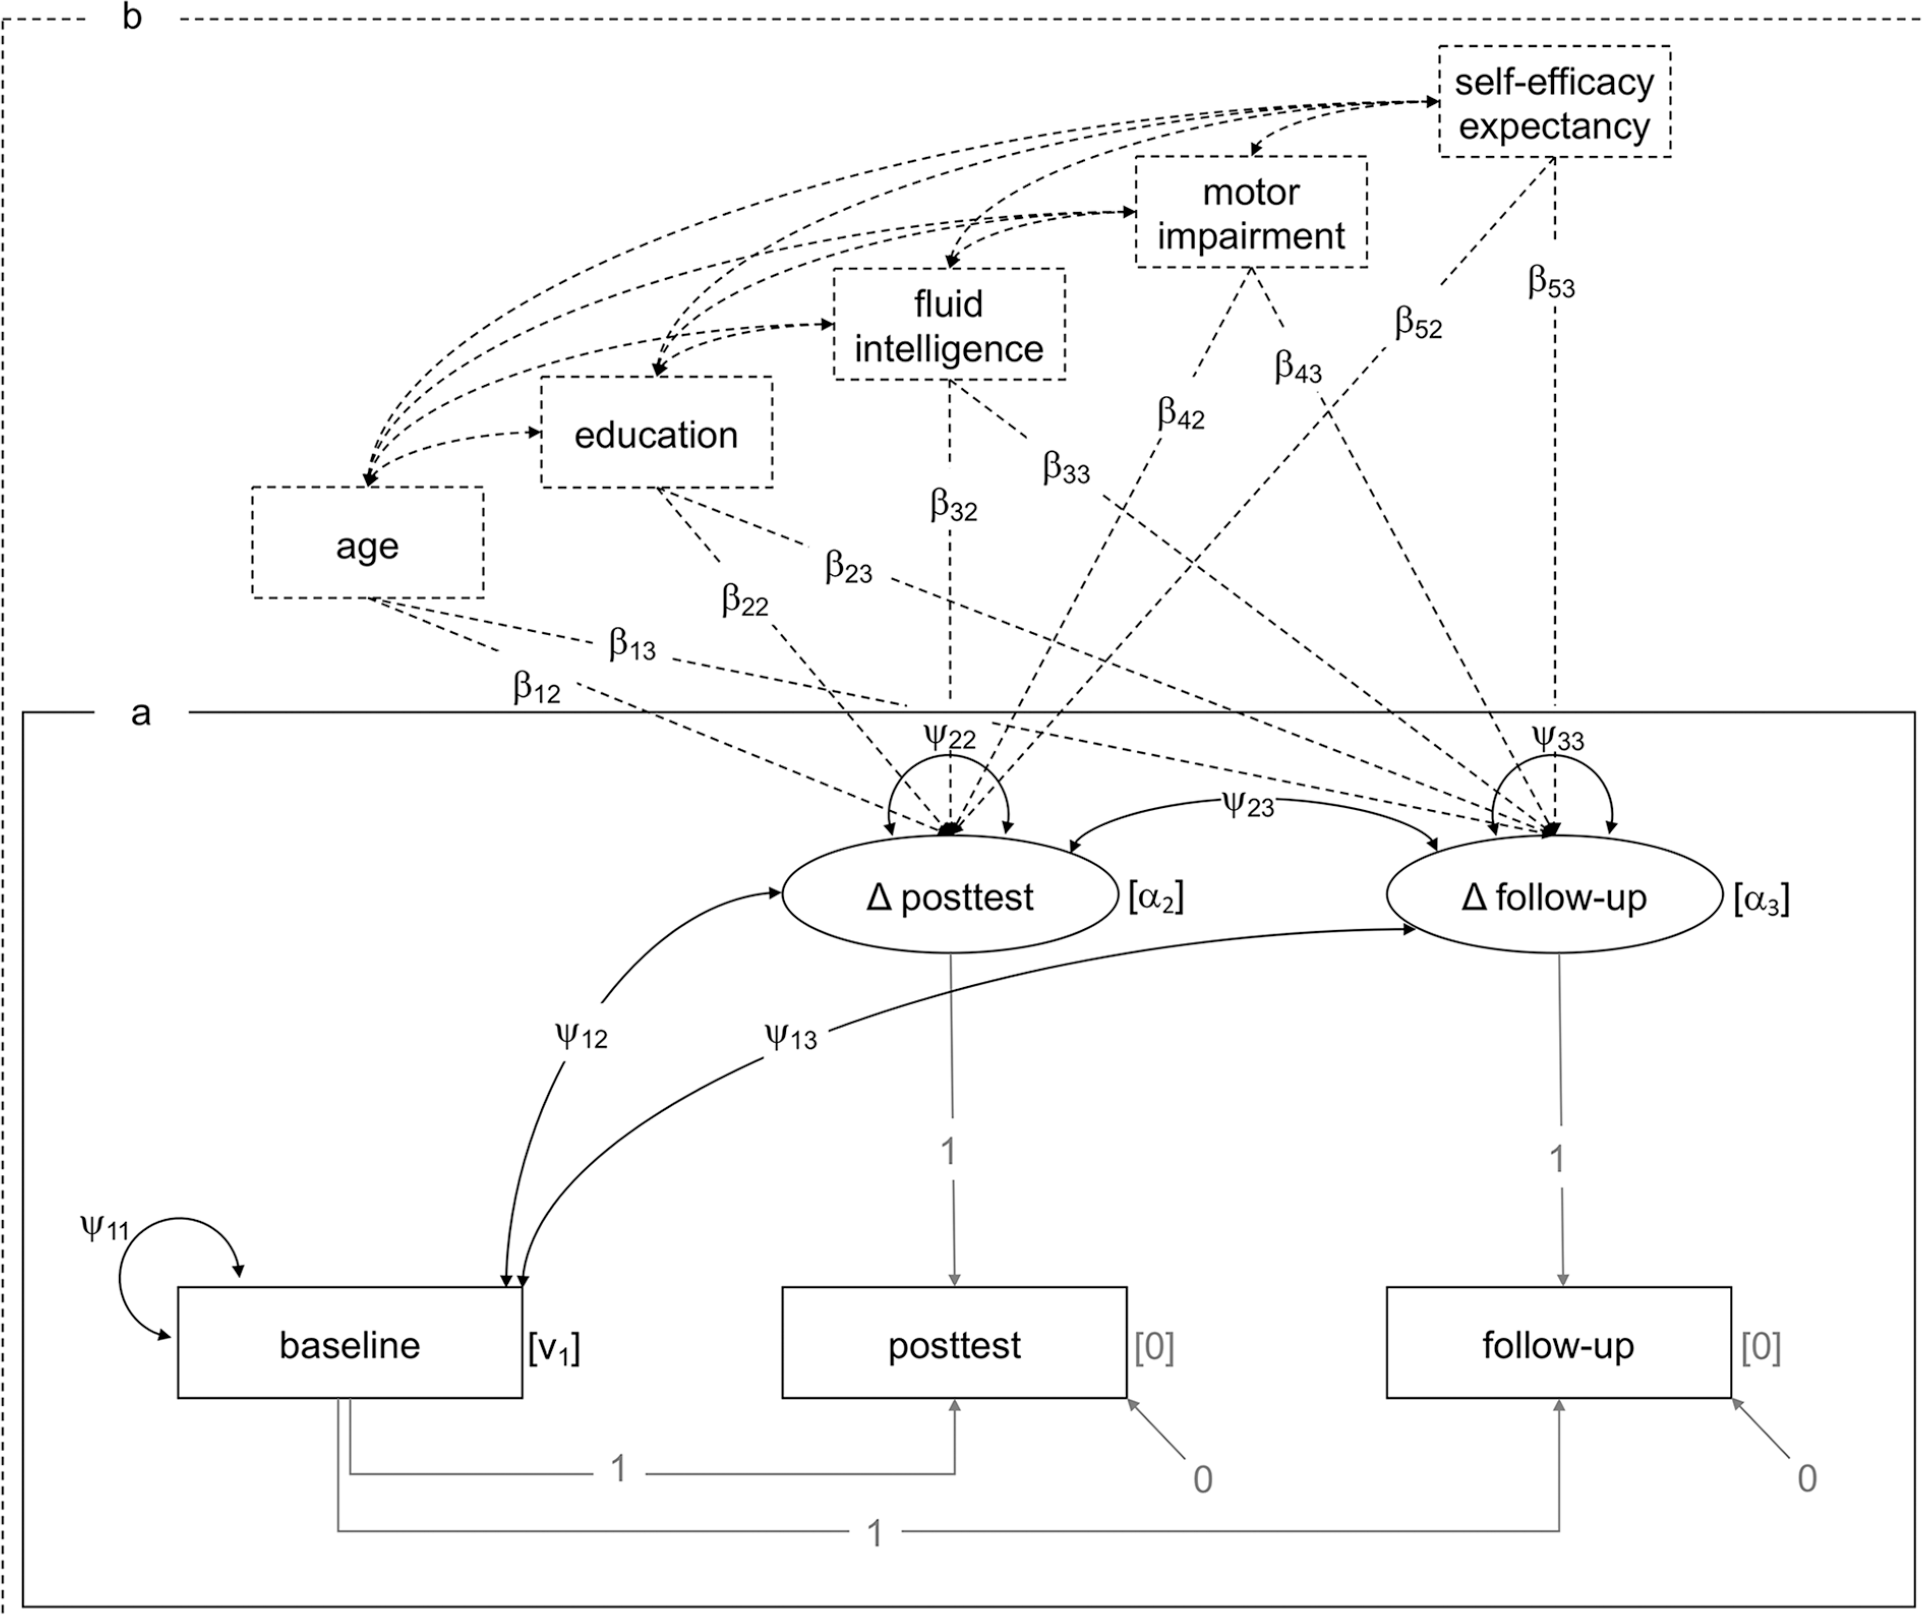
(a) Basic latent difference score model, (b) extended latent difference score model including covariates. Rectangles represent observed variables, and ellipses represent latent variables. Fixed parameters and path coefficients appear in gray. Free (i.e., to be estimated) parameters and path coefficients appear in black. Covariates and corresponding paths introduced for the extended latent difference score model appear with dashed lines. Covariances between covariates introduced for the extended models are estimated for control reasons, however, are not of main interest for our research question. αi = intercept of latent variable, βj,i = path coefficient for covariates, Δ = difference, νi = intercept of observed variable, ψi,i = variance, ψi-1,i = covariance.
To identify characteristics associated with individual variation in difference scores beyond individual baseline performance, we extended the basic LDSM by covariates predicting the variance of latent change scores (ψ i,i by β i,i ), Figure 2b. Note that several global terms for individual differences predicting training responsiveness are used interchangeably in literature,20,34 for example, “predictors”, “prognostic factors”, “covariates”, and “moderators”. Here, we call them “predictors” on a content-related level, and “covariates” on a methodological level, referring to their properties in the applied LDSM. For further details on outcome measures and covariates, see the corresponding sections below.
Overall model fit was evaluated using the χ2-test. Further approximative fit indices as the standardized root mean square residual (SRMR), and comparative fit index (CFI) are reported. Values of SRMR ≤ .08 and CFI ≥ .95 were considered to reflect adequate model fit.35,36 No model fit indices are reported for the basic LDSM, as the model is just identified (degrees of freedom, df = 0) and no fit indices can be assessed.
Full information maximum likelihood estimation (FIML) was used to deal with missing data patterns. As suggested for SEM with small samples, 37 Bollen-Stine bootstrapping with n = 1000 bootstrap replicates was performed for both model parameter estimates and fit indices using the R package semTools. Significance level for model parameters was set to α = .05. Following the explorative nature of our analyses on individual characteristics predicting WMT responsiveness, we interpreted α ≤ .10 as a trend toward statistical significance for path coefficients of covariates to Δposttest and Δfollow-up (β j,i ). Ninety-five percent CI are reported for model parameters and fit indices.
For the extended LDSM, we compared model fit between a model where the variances (ψ i,i ), covariances (ψi-1,i), and path coefficients between covariates and the variance of Δposttest and Δfollow-up (β i,i ) were assumed to be equal across the WMT group and CG versus a model where those parameters were left free to vary using a χ2-difference test (Δχ2). These group comparisons enable us to draw inferences on predictors specific for training responsiveness compared to retest effects. Regarding the influence of baseline performance on Δposttest/Δfollow-up, we additionally compared the standardized covariances (i.e., correlations, ψαα) between baseline performance and Δposttest/Δfollow-up between the WMT group and CG using a z-test for independent sample correlations. The fitted models are separately reported for the WMT group and the CG.
Outcomes
We analyzed data of two cognitive domains: WM as near-transfer effect measure and executive functions as a far-transfer effect measure, assessed by several single test measures each, including both paper-pencil assessments and computer tests and parallel test forms, if available. T-standardized (M = 50, SD = 10) test scores were calculated using published normative data of age-, sex-, and education-matched healthy controls. Domain composite scores were computed as the average of the corresponding equally weighted single test T-scores, which strengthened the interpretability of scores on the cognitive domain level and reduced overall type-I-error.
WM was assessed by the digit span forward and backward task (Wechsler Memory Scale revised) 38 the n-back verbal and n-back nonverbal tasks and the CORSI block tapping tasks forward and backward (Wiener Testsystem). 39 Tests for executive functions included semantic and phonemic verbal fluency (CERAD-Plus), 40 Trail Making Test B/A (TMTB divided by TMTA, CERAD-Plus), 40 and the interference measure of the Stroop Color-Word-Interference test. 41 For details on further cognitive and clinical outcomes in the study, see Ophey and colleagues. 16
Covariates
Age in years, education in years, fluid intelligence as measured with the LPS-4 (Leistungsprüfsystem subtest 4: reasoning, standardized T-score), 42 PD motor impairment as measured with the UPDRS-III, 43 and self-efficacy expectancy as measured with the SWE (Skala zur Allgemeinen Selbstwirksamkeitserwartung, standardized T-score) 44 were included in the extended LDSM. † Covariates were assessed at baseline assessment with both patients and outcome assessors blinded for group allocation and knowledge of candidate predictors. Covariates were grand-mean-centered to ensure interpretability of the difference score intercepts (α i ). Covariances between all combinations of covariates were allowed in the model.
Results
Near-Transfer: Working Memory
Details on fitted models for WM without equality constraints between the WMT group and CG can be obtained from Table 2. The basic LDSM was just identified (df = 0), therefore neither model fit nor a test for measurement invariance between the WMT and CG was assessed. The estimated mean of Δposttest was significant in both the WMT group and the CG. However, the estimated mean of Δfollow-up was only significant for the WMT group, but not for the CG. Variance estimates indicate significant individual variation in both Δposttest and Δfollow-up for both the WMT group and CG.
Latent Difference Score Models of Near-Transfer Working Memory. a
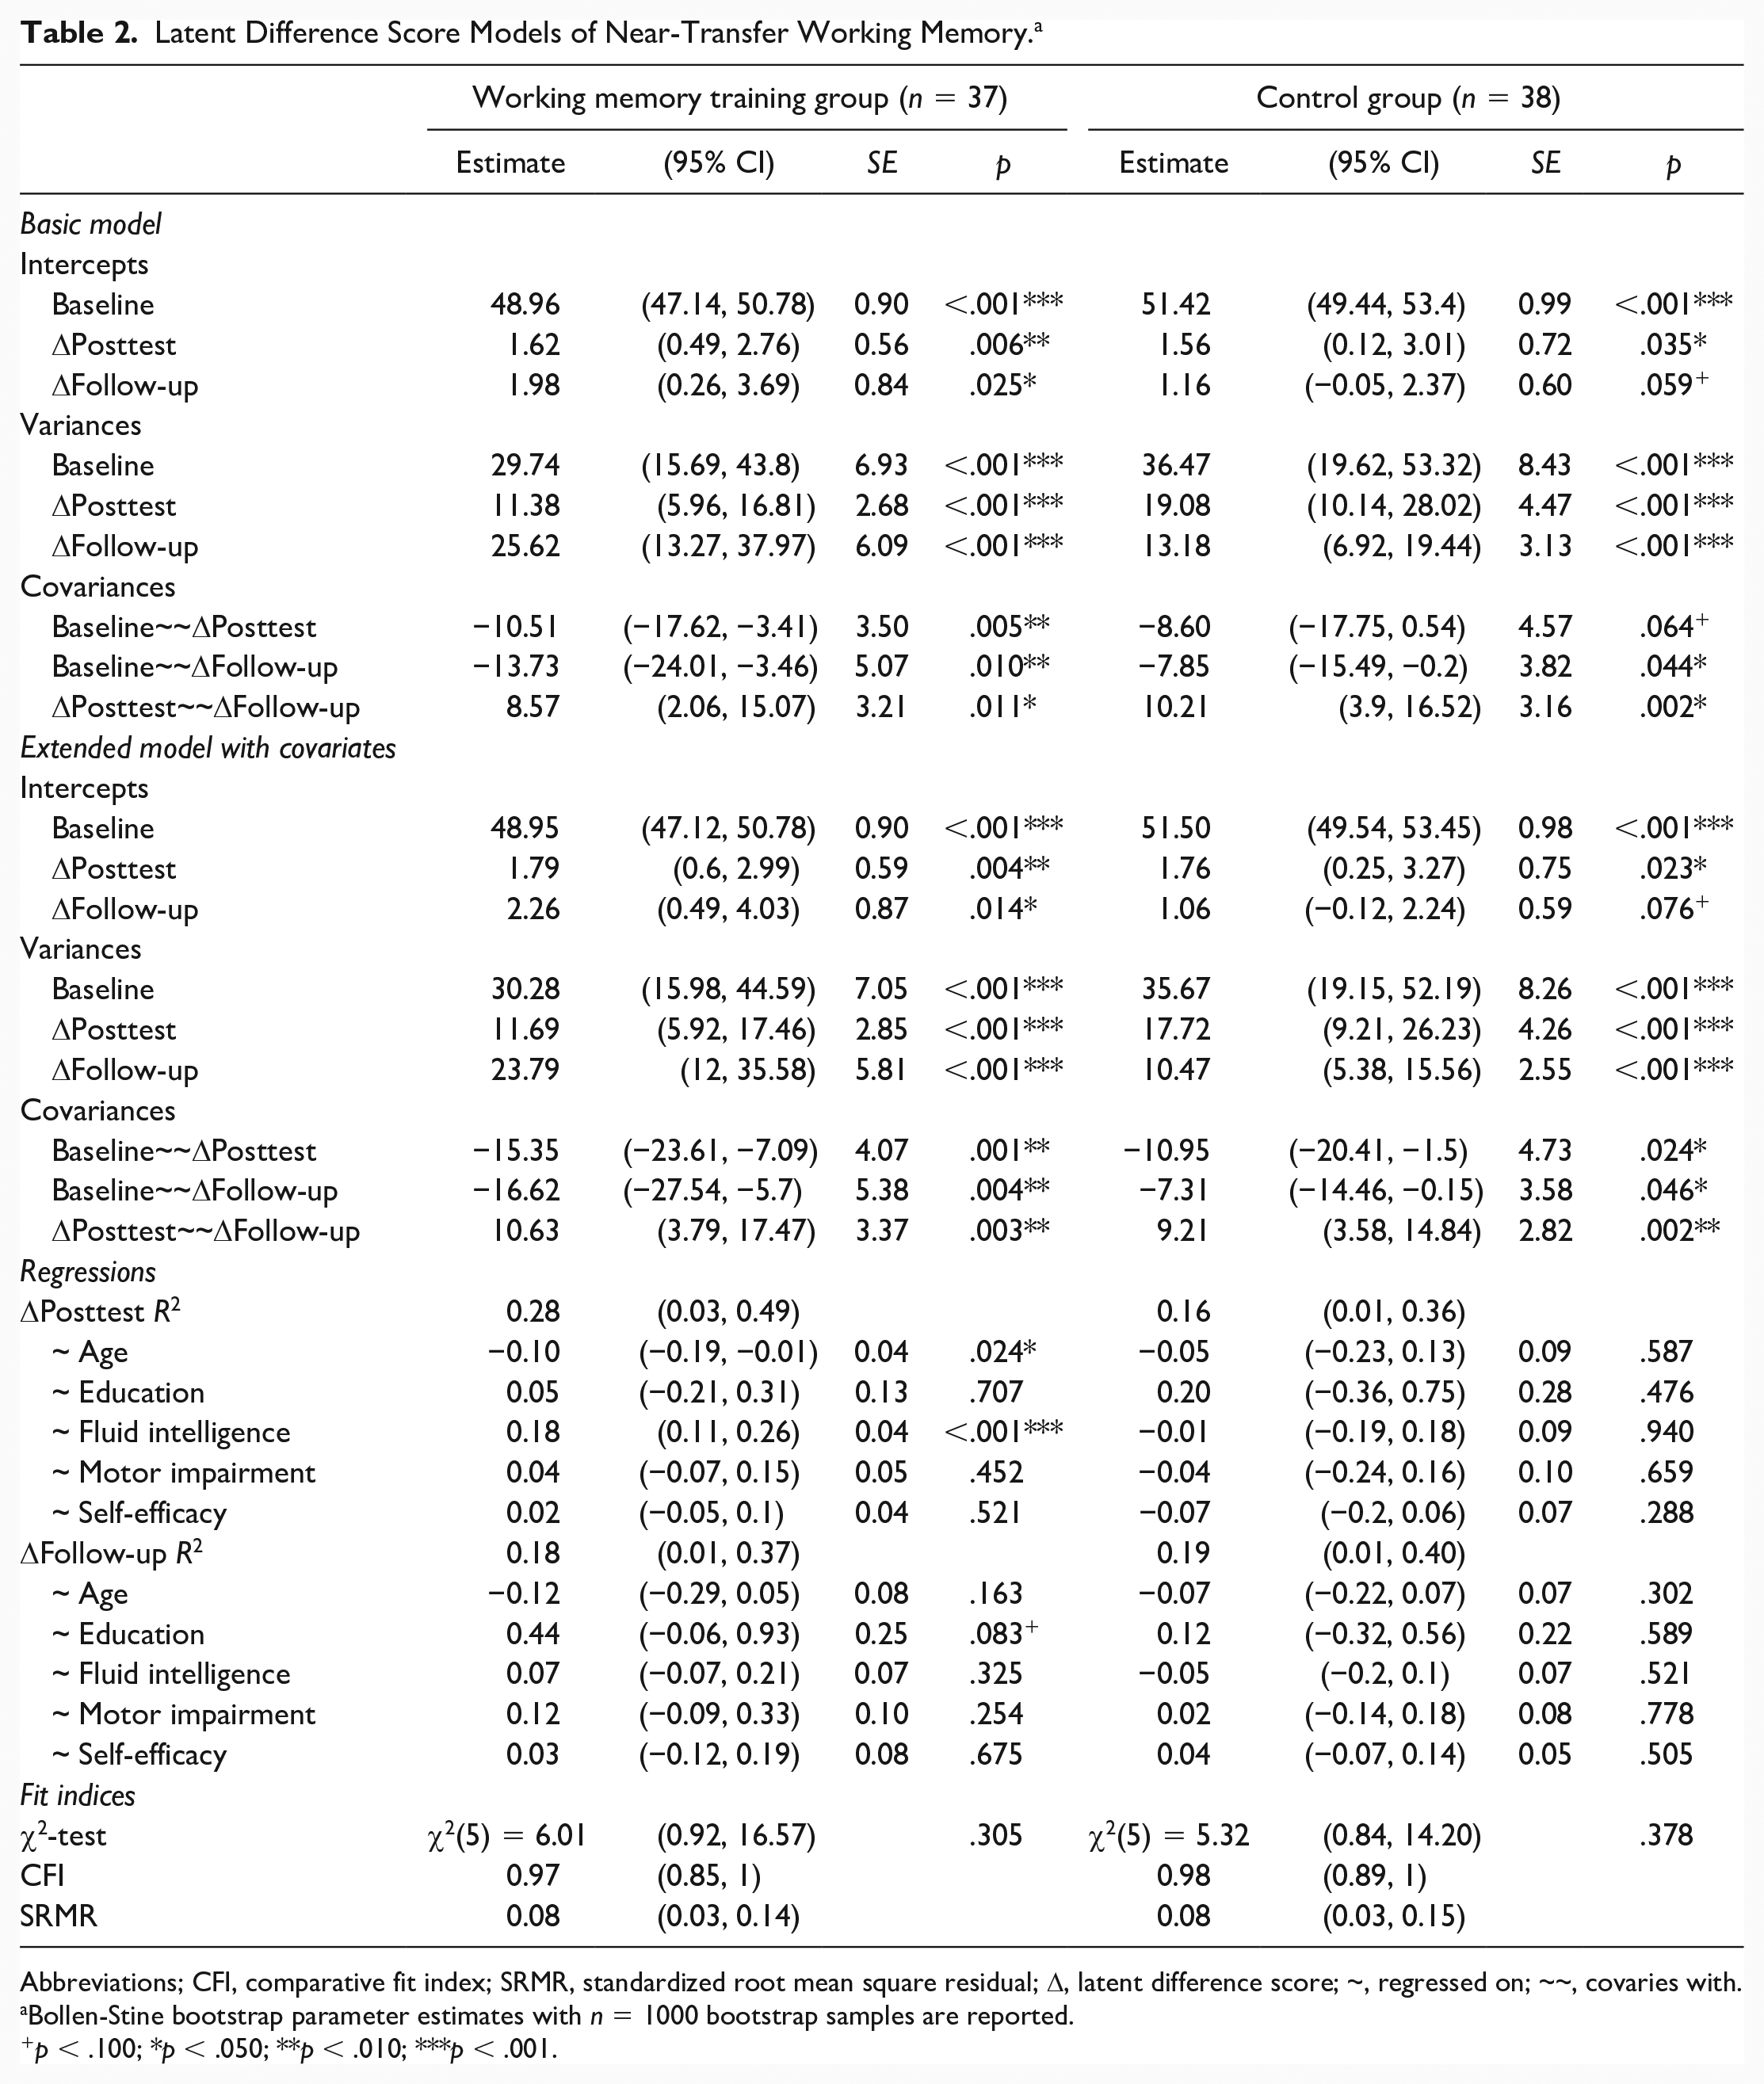
Abbreviations; CFI, comparative fit index; SRMR, standardized root mean square residual; Δ, latent difference score; ~, regressed on; ~~, covaries with.
Bollen-Stine bootstrap parameter estimates with n = 1000 bootstrap samples are reported.
p < .100; *p < .050; **p < .010; ***p < .001.
In the WMT group, the covariances of baseline performance and both Δposttest (ψ12.WMT = −10.51, p = .005) and Δfollow-up (ψ13.WMT = −13.73, p = .010) were significantly negative, suggesting that individuals with lower baseline performance showed both larger immediate and follow-up gains through training than individuals with higher baseline performance. In the CG, only baseline performance and Δfollow-up (ψ13.CG = −7.85, p = .044) were significantly negatively correlated. A comparison of standardized covariances (i. e., correlations) of the basic LDSM between WMT group and CG indicated descriptively stronger negative relationships between baseline performance and Δposttest, as well as Δfollow-up, in the WMT group compared with the CG; however, these differences did not reach statistical significance (ψ12, z = −1.25, p = .106; ψ13, z = −0.76, p = .225). The covariance of Δposttest and Δfollow-up was significantly positive for both the WMT group and CG, indicating that Δposttest and Δfollow-up were positively correlated.
The extended LDSM further included the covariates age, education, fluid intelligence, PD motor impairment and self-efficacy. The model fit difference between the extended LDSM with, χ2(25) = 57.30, p ≤ .001, SRMR = 0.12 [95% CI 0.07, 0.18], CFI = 0.80 [95% CI 0.61, 0.95], and without, χ2(10) = 11.31, p = .305, SRMR = 0.08 [95% CI 0.04, 0.12], CFI = 0.98 [95% CI 0.92, 1.00], equality constraints between the WMT group and CG was significant, Δχ2(15) = 45.99, p ≤ .001, revealing a benefit for model fit by allowing model parameters to differ between the WMT group and CG. The extended LDSM of the WMT group revealed comparable parameter estimates for intercepts, variances, and covariances as the basic LDSM. Even when controlling for the above-mentioned covariates, estimates for Δposttest, Δfollow-up, variances, and covariances remain significant. Age was found to be a significant negative predictor of Δposttest (β12 = −0.10, p = .024) and fluid intelligence was found to be a significant positive predictor of Δposttest (β32 = 0.18, p ≤ .001), indicating that younger individuals with higher levels of fluid intelligence show largest immediate training gains. For Δfollow-up, only for education a trend toward significance as a positive predictor was reported (β23 = 0.44, p = .083), that is, the more educational years, the higher the training gains. No other covariate was found to significantly predict variance in Δposttest and Δfollow-up within the WMT group.
The extended LDSM of the CG revealed comparable parameter estimates for intercepts, variances, and covariances as the basic LDSM as well. However, when controlling for the aforementioned covariates, the covariance between baseline and Δposttest reached statistical significance (ψ12.CG = −10.95, p = .024). A comparison of standardized covariances of the extended LDSM between WMT group and CG indicated a significantly stronger negative relationship between baseline performance and Δposttest in the WMT group compared with the CG (ψ12, z = −2.631, p = .004), as well as a trend in the same direction between baseline performance and Δfollow-up (ψ13, z = −1.251, p = .105). None of the covariates was found to be a significant predictor of variance in Δposttest and Δfollow-up within the CG.
Far-Transfer: Executive Functions
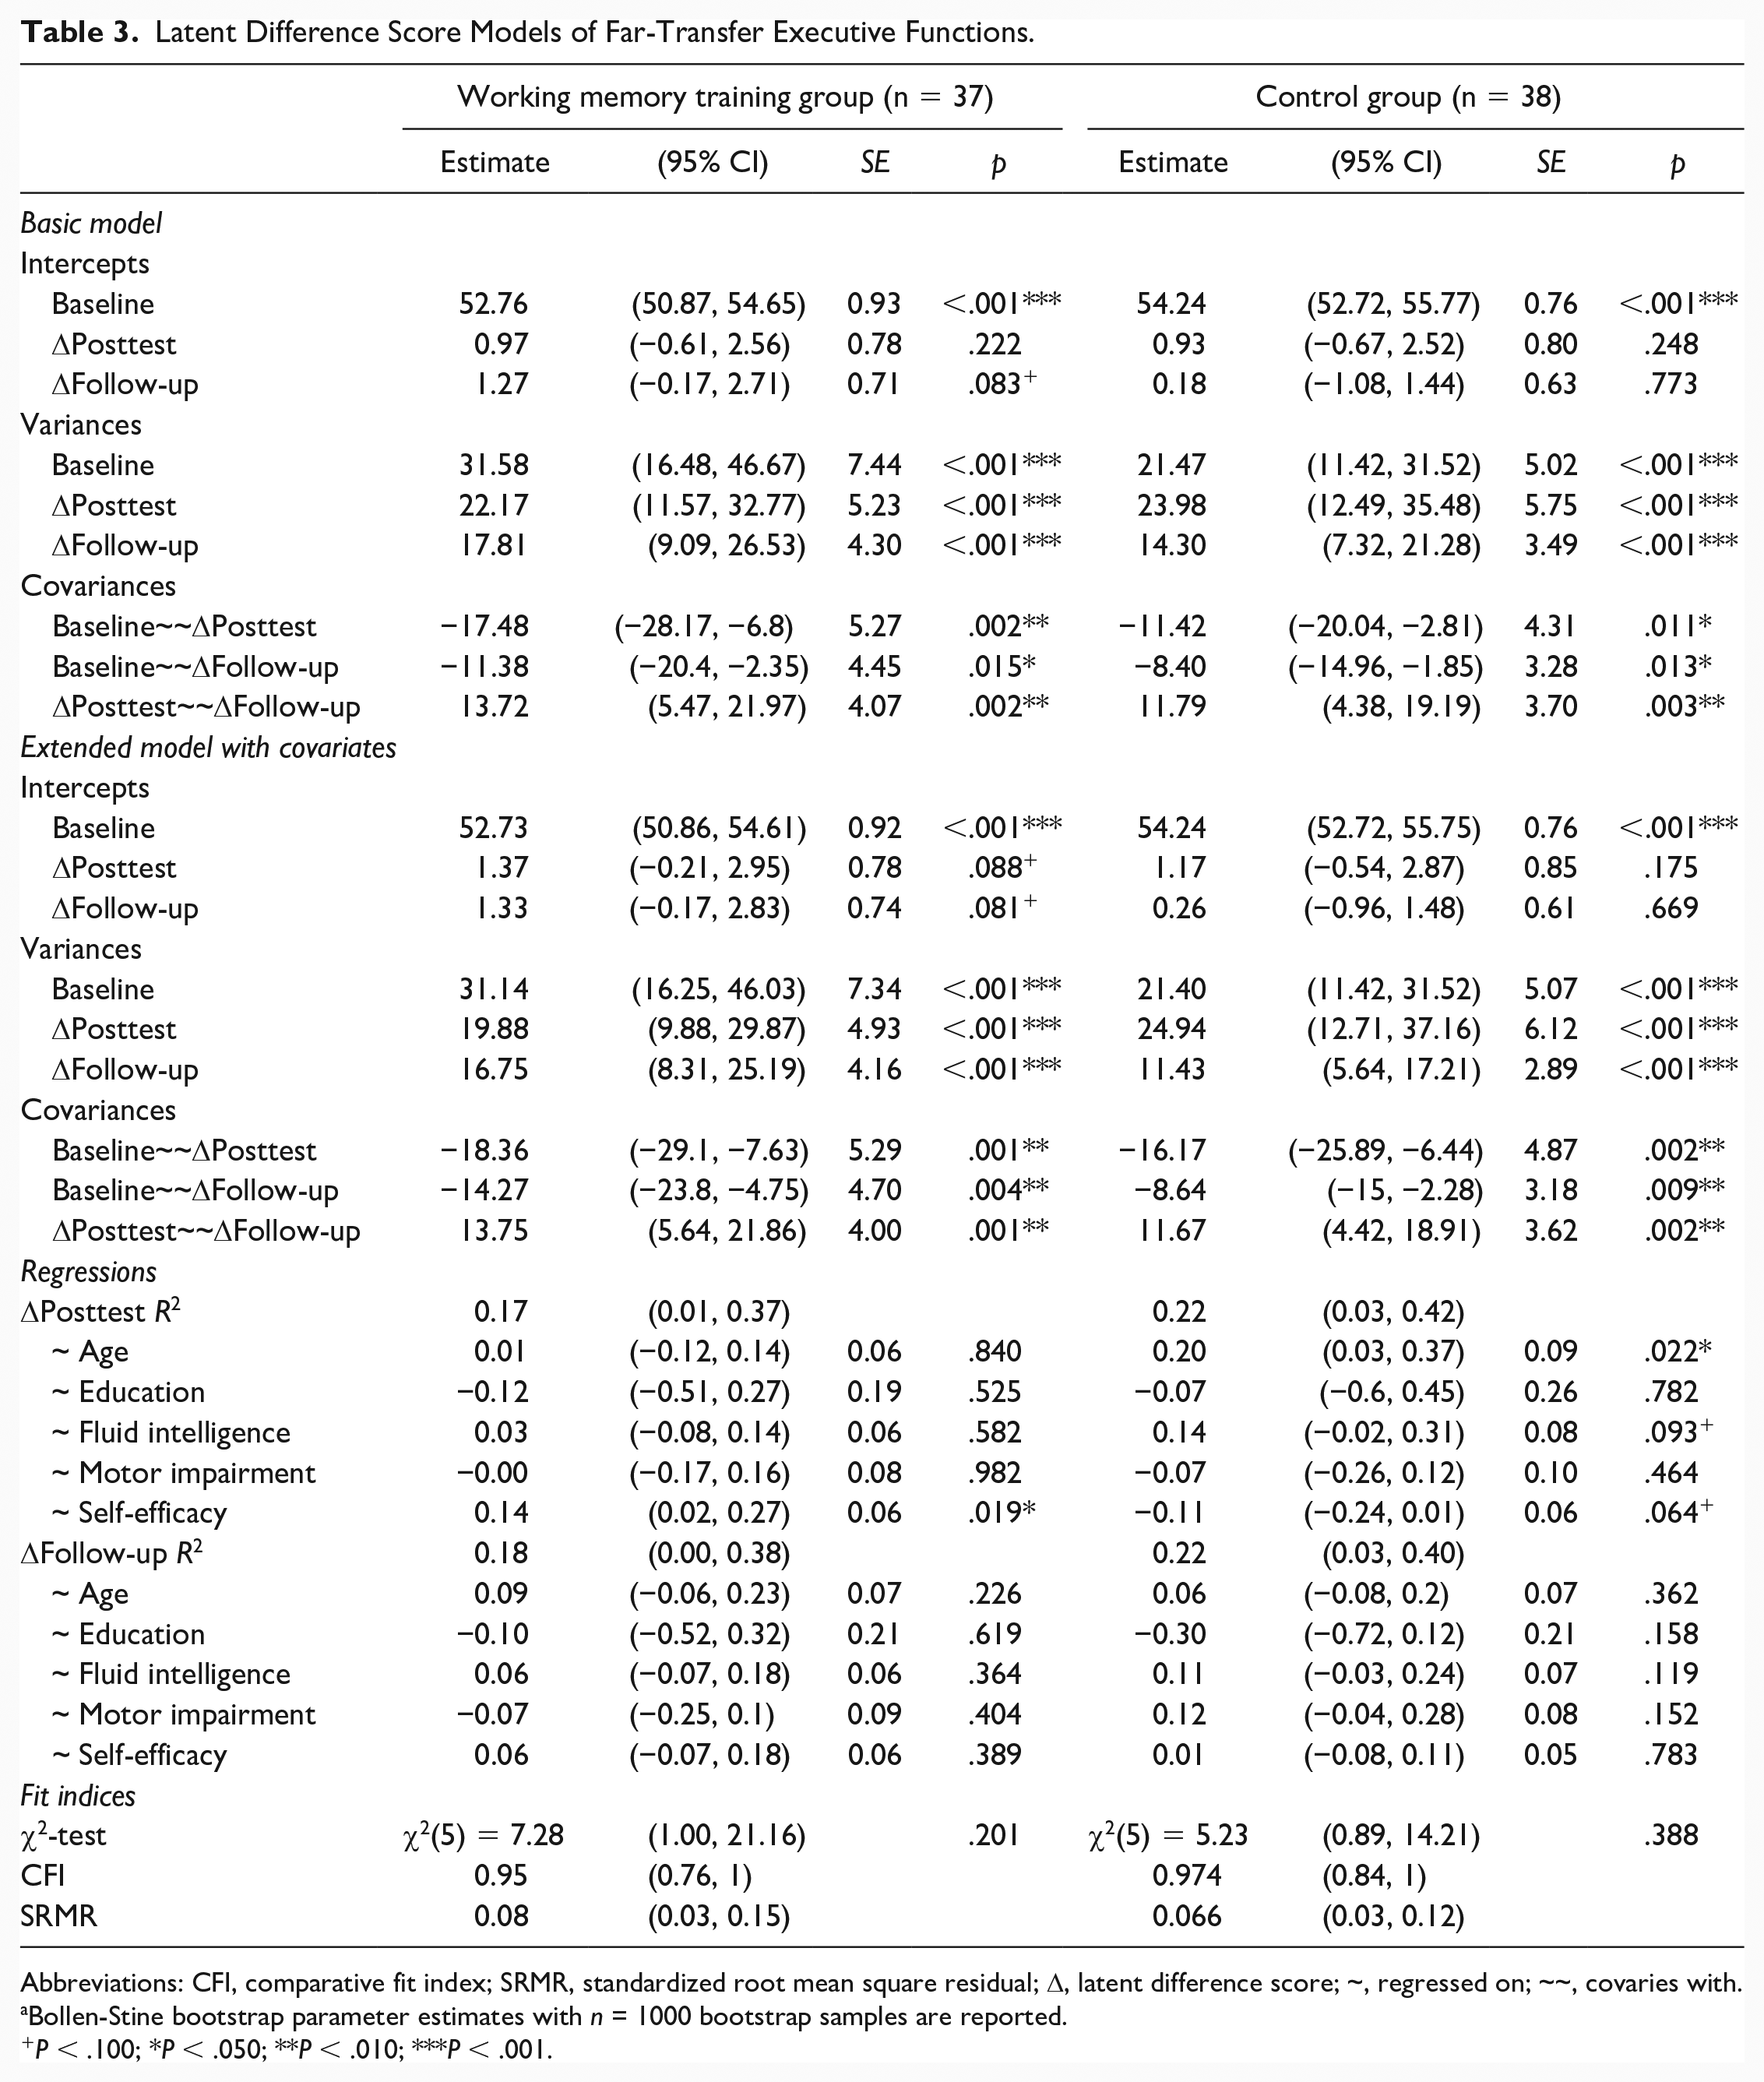
Details on fitted models for executive functions without equality constraints between the WMT group and CG can be obtained from Table 3. The basic LDSM was just identified (df = 0). The estimated means of Δposttest and Δfollow-up were not statistically significant, neither in the WMT group nor in the CG. However, for both points of time, they were descriptively larger in the WMT group than in the CG. Variance estimates indicate significant individual variation in both Δposttest and Δfollow-up for both the WMT group and CG. The covariance of baseline performance and both Δposttest, as well as Δfollow-up, for both the WMT group (ψ12.WMT = −18.36, p = .001; ψ13.WMT = −14.27, p = .004) and the CG (ψ12.CG = −16.17, p = .002; ψ13.CG = −8.64, p = .009) were significantly negative; however, it did not significantly differ between the WMT group and CG (ψ12, z = −0.98, p = .164; ψ13, z = −0.021, p = .492). The covariance of Δposttest and Δfollow-up was significantly positive for both the WMT group and CG.
Latent Difference Score Models of Far-Transfer Executive Functions.
Abbreviations: CFI, comparative fit index; SRMR, standardized root mean square residual; Δ, latent difference score; ~, regressed on; ~~, covaries with.
Bollen-Stine bootstrap parameter estimates with n = 1000 bootstrap samples are reported.
P < .100; *P < .050; **P < .010; ***P < .001.
The model fit difference between the extended LDSM with, χ2(25) = 56.00, p ≤ .001, SRMR = 0.11 [95% CI 0.08, 0.16], CFI = 0.74 [95% CI 0.52, 0.94], and without, χ2(10) = 12.63, p = .245, SRMR = 0.07 [95% CI 0.04, 0.12], CFI = 0.97 [95% CI 0.85, 1.00], equality constraints between the WMT group and CG was significant, Δχ2(15) = 43.37, p ≤ .001, revealing a benefit for model fit by allowing model parameters to differ between the WMT group and CG. The extended LDSM of the WMT group revealed comparable parameter estimates for intercepts, variances, and covariances as the basic LDSM. Regarding the influence of covariates on variance at Δposttest and Δfollow-up, self-efficacy expectancy only turned out to be a significant positive predictor of Δposttest (β52 = 0.14, p = .019) in the WMT group, indicating that individuals with higher levels of self-efficacy expectancy show larger immediate training gains. No other covariate was found to be a significant predictor of variance in Δposttest and Δfollow-up within the WMT group. The extended LDSM of the CG revealed comparable parameter estimates for intercepts, variances, and covariances as the basic LDSM as well. Age was found to be a significantly positive predictor of the variance in Δposttest (β13 = 0.20, p = .022) for the CG. Furthermore, a trend of fluid intelligence being a positive predictor (β33 = 0.14, P = .093) and self-efficacy expectancy being a negative predictor (β53 = −0.11, p = .064) of the variance in Δposttest was found for the CG.
Discussion
The aim of this study was to investigate predictors of WMT responsiveness in patients with PD by analyzing data of an RCT on the effectiveness of a computerized 5-week targeted WMT in PD, including both posttest and 3-months follow-up assessments 16 with an advanced SEM approach. Summarizing, the extended LDSM including covariates to predict individual variance in latent change scores revealed lower baseline performance, younger age, and higher fluid intelligence to significantly predict higher change scores in near-transfer WM outcomes directly after WMT (posttest), as well as lower baseline performance and higher education to predict larger change scores at 3-month follow-up. For far-transfer executive function outcomes, higher self-efficacy expectancy showed a trend to significantly predict larger positive WMT responsiveness at posttest.
The predictive power of individual differences regarding training responsiveness is often discussed within the compensation versus magnification framework.45,46 Following the magnification account, individuals with more cognitive resources “to acquire, implement, and sharpen effortful cognitive strategies” 45 would show largest training benefits. On the contrary, the compensation hypothesis argues that individuals with lower performance prior to training have more room for improvement than individuals already performing at or near optimal levels, and therefore would show largest training benefits 45 .
Baseline Performance, the Compensation Hypothesis, and Methodological Considerations
Some studies found positive associations between baseline performance and change through training,15,47 whereas others found evidence for negative associations.25,26 As broadly discussed in Smolén and colleagues, 48 one fallacy linking those negative associations between baseline performance and change through training directly to the compensation account is that other sources for this association are neglected and not accounted for in analyses. One such important artefact is regression to the mean, a statistical artefact that causes negative correlations between baseline performance and gain by noisy repeated measurements, where extreme values at the first point of time tend to be closer to the mean at the second point of time without reflecting real change. 48 Furthermore, analyses to identify predictors of training responsiveness are frequently conducted with data of the experimental group only. 48 Therefore, they do not control for effects in the control group, 20 which impedes disentangling predictors of training responsiveness from predictors of retest and practice effects. 49
The analytical approach of fitting LDSM that allowed to explore the (statistical) properties of change without actually calculating change scores, and the comparison of models fitted in the WMT group versus models fitted in the CG, enabled us to draw inferences on predictors specific for training responsiveness compared with regression to the mean and practice effects. 48 In our LDSM, the negative covariances between baseline performance and latent difference scores indicated that individuals with lower baseline performance in the respective outcome measure tend to show larger change scores than individuals with higher baseline performance. For near-transfer WM, not only descriptive but also statistically significant differences between standardized covariances in the WMT group and CG were present, revealing significantly stronger negative relationships between baseline performance and change in the WMT group compared with the CG. We hypothesize this difference to be attributable to an increased compensation effect through training in the WMT group. Therefore, our data indicate that for both posttest and long-term near-transfer responsiveness of WMT in PD, “room for improvement” regarding participants’ WM abilities at baseline seems necessary.
In the CG, the negative association is in line with the compensation account as well, however, this compensation does not reflect change through training, but rather compensation through practice effects and regression to the mean. Similarly, the negative relationship between baseline performance and change in the LDSM for executive functions might rather represent compensation through practice effects and regression to the mean, as the covariances were significant for both groups and differences between the two groups were present on a descriptive level only.
Other Predictors and the Magnification Hypothesis
Notably, our data regarding associations of other predictors than baseline performance rather point to evidence for the magnification account: latent change score estimates were higher for individuals of the WMT group with higher intelligence, younger age, more educational years, and higher self-efficacy expectancy. Higher intelligence might constitute the required “hardware” to utilize the possibilities given by WMT to extend the cognitive repertoire and to engage in true plasticity. Corroborating this hypothesis, higher intelligence was found to be a positive predictor for change through training in the first study investigating predictors of WMT responsiveness for patients with PD, 15 as well as studies with healthy older adults.50,51
Age might constitute a proxy for the general potential to engage in neural and cognitive plasticity.52,53 Due to age-related reductions in processing resources, 6 the ability to engage in plastic changes after WMT might be reduced with increasing age. Our results are in line with several findings from WMT in healthy older adults, which also identified younger age as a positive predictor for training responsiveness.50,51,54 In contrast to our results, Fellman and colleagues 15 did not find an association between age and training responsiveness. However, they identified shorter PD disease duration as a positive predictor for change through training. As the prevalence of PD increases with age 55 and neuropathological changes progress with disease duration, 56 disease duration might be another (and possibly even the more conclusive) measure as a proxy for the potential of neural and cognitive plasticity in PD. However, conflicting results identifying longer PD duration to be predictive of higher training gains exist.27,28 This discrepancy regarding the direction of predictive effects and corresponding mechanisms might be dependent on the type of CT and the applied analytical approach. 23
As in Fellman and colleagues, 15 more educational years were predictive for more WMT related positive change in our cohort of patients with PD. Education might be a proxy for cognitive reserve, 57 which in terms of the magnification hypothesis enables individuals to engage in processes of plasticity.45,46 However, contradicting findings in the CT literature exist in healthy older adults, which discuss that CT might be able to diminish the cognitive reserve disadvantage of less-educated older adults.23,58 Furthermore, the discussion can be taken to the next level, considering a higher cognitive reserve to be commonly associated with less cognitive deficits given the same brain pathology. 59 We did not find a significant predictive value of PD motor impairment, which can be considered a proxy to the amount of PD-related brain pathology. 60 Therefore, our analyses controlled for a proxy of PD brain pathology, which is why education might have emerged as a proxy of cognitive reserve rather than brain reserve.
A trend of a higher self-efficacy expectancy being a positive predictor for training responsiveness was found for far-transfer executive functions. Self-efficacy refers to an individual’s belief in his/her ability to influence and affect certain situations by his/her actions, 61 and is, therefore, strongly linked to motivational processes and general training success. Especially the role of self-efficacy expectancy for transfer effects was discussed 62 : Higher self-efficacy expectancy would lead to higher motivation to learn and to transfer. Self-efficacy expectancy has been identified as a predictor for CT responsiveness before, 24 strengthening the hypothesis that it might be beneficial for CT outcomes to ensure self-efficacy expectancy and motivation at the beginning of the training period.
Timeline of Predictors of Training Responsiveness
For near-transfer WM, evidence for both the compensation and magnification account was found at posttest and 3-month follow-up. For far-transfer executive functions, evidence for the magnification account was present at posttest only. Therefore, the underlying mechanisms of training responsiveness might at least partly be dependent on timing aspects. 63 With more time to elaborate and consolidate the WMT content beyond the training period, individual differences might become less important in predicting WMT responsiveness. 64
Strengths and Limitations
As a major strength, by applying SEM as a highly flexible statistical approach, we were able to circumvent several statistical fallacies clinical trial data often include such as violations of multivariate normality assumptions, nonlinear change trajectories, and missing data patterns, therefore applying high methodological standards to answer the question “who benefits most” from WMT.20,34 Furthermore, by fitting LDSM for both the WMT group and CG, we were able to detangle WMT effects from retest effects such as practice effects and regression to the mean. The discussed associations were present in the WMT group only, which further promotes the specificity of predictors for training responsiveness versus retest effects.
By applying a bootstrapping technique to estimate model parameters and fit indices of our LDSM, we made this modeling technique suitable even for small sample sizes. 37 However, our sample size still was fairly small to apply SEM, which constitutes a limitation concerning the reliability and validity of our results. We acknowledge that the limited statistical power increases the risk of missing important effects and of reporting false alarms. Therefore, results should be treated cautiously and will have to survive sound methodological replication. So far, only few studies applied SEM techniques in the CT framework.18,45 More methodological high-quality research applying advanced statistical methods beyond simple correlational approaches is urgently needed, especially with larger samples. Hence, also individual participant data meta-analytic approaches might be one suitable format in this context.
Analyses on internal consistency (Supplementary Material 2) of the used cognitive domain composite scores revealed acceptable internal consistency for the working memory composite. For the executive function composite score, however, internal consistency was low. This might limit the interpretability of our findings, as the use of composite scores might obscure fine-grained and differential effects of the WMT on single-task performance. However, the use of composite scores reduces type I error and ensures interpretability on the cognitive domain level, which might be of more clinical importance than the single-test level. Alternatively, possible extensions of the present LDSM framework would be the simultaneous modeling of 2 or more domains of interest, allowing the investigation of cross-domain couplings, and the use of multiple indicators for latent factors instead of using equally weighted (observed) composite scores. 65 Especially the latter would reduce the influence of measurement errors and, therefore, improve validity and reliability of the analyses and should be implemented where possible. In the context of the present manuscript, post hoc attempts of implementing a multiple indicator LDSM approach failed to converge.
Another limitation is that a substantial proportion of variance in latent difference scores at posttest and 3-month follow-up remained unexplained (0.17 ≤ R2 ≥ 0.28). Future SEM approaches might, next to demographic, neuropsychological, and clinical individual characteristics, consider individual training trajectories to predict transfer to near- and far-transfer effect measures. Moreover, the clinical significance of our results remains a matter of debate, which is not only important in the context of prognostic research for WMT responsiveness, but also regarding general effectiveness of WMT and other CT approaches. 66 Future research on effects and mechanisms of WMT and other CT approaches should more consistently include patient-centered outcomes such as daily life functioning or health-related quality of life assessments.
Further strengths of this study include the adherence to high methodological standards in general study design following the CONSORT recommendations. Additionally, the reporting of the prognostic analyses includes the relevant items of the CHARMS (Critical Appraisal and Data Extraction for Systematic Reviews of Prediction Modelling Studies) Checklist, 22 allowing future research to more reliably synthesize findings from single prognostic trials. Another strength is that patients and outcome assessors were blinded for candidate predictors, which might reduce a possible incorporation bias. However, only outcome assessors were blinded for group allocation across the whole trial. Finally, by including posttest and 3-months follow-up data, a more comprehensive and encompassing view on predictors of WMT responsiveness was derived.
Conclusion
Considering the high vulnerability of patients with PD to develop cognitive dysfunctions 1 and the large heterogeneity in CT outcomes, there is an increasing urge for personalized interventions. 21 This study contributes to the examination of individual characteristics of patients with PD associated with responsiveness to WMT, a promising nonpharmacological intervention option against cognitive dysfunction in PD. WMT might be especially beneficial for patients with PD of younger age, higher education, higher intelligence, and greater self-efficacy expectancy. However, there has to be room for improvement, as lower baseline performance is associated with a greater positive WMT responsiveness as well. Individual characteristics predicting immediate versus long-term WMT responsiveness need further research to achieve a better understanding of mechanisms leading to enduring WMT effects. In general, the present findings should be interpreted cautiously, as they need sound methodological replication with larger sample sizes or individual participant data meta-analytic approaches.
Supplemental Material
sj-pdf-1-nnr-10.1177_1545968320981956 – Supplemental material for Predicting Working Memory Training Responsiveness in Parkinson’s Disease: Both “System Hardware” and Room for Improvement Are Needed
Supplemental material, sj-pdf-1-nnr-10.1177_1545968320981956 for Predicting Working Memory Training Responsiveness in Parkinson’s Disease: Both “System Hardware” and Room for Improvement Are Needed by Anja Ophey, Sarah Rehberg, Kathrin Giehl, Carsten Eggers, Paul Reker, Thilo van Eimeren and Elke Kalbe in Neurorehabilitation and Neural Repair
Supplemental Material
sj-txt-2-nnr-10.1177_1545968320981956 – Supplemental material for Predicting Working Memory Training Responsiveness in Parkinson’s Disease: Both “System Hardware” and Room for Improvement Are Needed
Supplemental material, sj-txt-2-nnr-10.1177_1545968320981956 for Predicting Working Memory Training Responsiveness in Parkinson’s Disease: Both “System Hardware” and Room for Improvement Are Needed by Anja Ophey, Sarah Rehberg, Kathrin Giehl, Carsten Eggers, Paul Reker, Thilo van Eimeren and Elke Kalbe in Neurorehabilitation and Neural Repair
Footnotes
Acknowledgements
We thank all patients for participation in the study and all staff members who contributed to data collection, entry, and monitoring. Furthermore, we thank the German Parkinson Association (Deutsche Parkinson Vereinigung Bundesverband e.V.) for establishing contact to several regional Parkinson support groups and support in recruitment. We would also like to thank Schuhfried GmbH for providing free access to the computerized subtests of the Wiener Testsystem used in this study and NeuroNation (Synaptikon GmbH) for providing the working memory training tasks, administrative support, and cognitive training licenses for our participants after study completion.
Declaration of Conflicting Interests
The author(s) declared the following potential conflicts of interest with respect to the research, authorship, and/or publication of this article: AO, KG, and SR declare that there is no conflict of interest. CE has received grants from the German Research Foundation (KFO219, TP 10), the Medical Faculty of the Philipps University Marburg, Germany, the German Ministry of Education and Research; honoraria from AbbVie, Wiesbaden, Germany; UCB, Monheim, Germany; Daiichi Sankyo, Munich; Medtronic, Meerbusch, Germany; Bayer Vital, Leverkusen, Germany; Bial, Mörfelden-Walldorf, Germany. PR received a travel grant from AbbVie. TvE reports having received consulting and speaker honoraria as well as research support from Siemens Healthcare, AVID Radiopharmaceuticals, Lilly, Shire Germany, Piramal (now Life Molecular Imaging) and GE Healthcare. EK has received grants from the German Ministry of Education and Research, Parkinson Fonds Deutschland gGmbH, the German Parkinson Society; honoraria from: Oticon GmbH, Hamburg, Germany; Lilly Pharma GmbH, Bad Homburg, Germany; Bernafon AG, Bern, Switzerland; Desitin GmbH, Hamburg, Germany.
Funding
The author(s) disclosed receipt of the following financial support for the research, authorship, and/or publication of this article: This research was funded by department budget only and did not receive any specific grant from funding agencies in the public, commercial, or not-for-profit sectors.
Supplementary material for this article is available on the Neurorehabilitation & Neural Repair website along with the online version of this article.
Notes
References
Supplementary Material
Please find the following supplemental material available below.
For Open Access articles published under a Creative Commons License, all supplemental material carries the same license as the article it is associated with.
For non-Open Access articles published, all supplemental material carries a non-exclusive license, and permission requests for re-use of supplemental material or any part of supplemental material shall be sent directly to the copyright owner as specified in the copyright notice associated with the article.