
Abstract
Background. Accurate prediction of clinical impairment in upper-extremity motor function following therapy in chronic stroke patients is a difficult task for clinicians but is key in prescribing appropriate therapeutic strategies. Machine learning is a highly promising avenue with which to improve prediction accuracy in clinical practice. Objectives. The objective was to evaluate the performance of 5 machine learning methods in predicting postintervention upper-extremity motor impairment in chronic stroke patients using demographic, clinical, neurophysiological, and imaging input variables. Methods. A total of 102 patients (female: 31%, age 61 ± 11 years) were included. The upper-extremity Fugl-Meyer Assessment (UE-FMA) was used to assess motor impairment of the upper limb before and after intervention. Elastic net (EN), support vector machines, artificial neural networks, classification and regression trees, and random forest were used to predict postintervention UE-FMA. The performances of methods were compared using cross-validated R2. Results. EN performed significantly better than other methods in predicting postintervention UE-FMA using demographic and baseline clinical data (median
Keywords
Introduction
Stroke is one of the most common diseases causing functional impairment worldwide and the most common cause of the morbidity in many developed countries.1,2 Stroke survivors frequently have residual motor impairments that have a negative impact on their quality of life. 3 One of the difficult challenges facing clinicians is to determine whether or not a patient will benefit from a certain type of treatment, particularly in the case of chronic stroke where gains may be more incremental than in the acute to the subacute stage. Initial clinical scores, demographic information, and imaging data have been shown to be important predictors of outcome in both acute and chronic stroke patients, yet at the individual level, these remain unsatisfactory.1,4-7 When assessed in the acute to subacute poststroke period, the severity of motor impairment and neurophysiological inputs, including the presence of motor evoked potentials (MEPs) in response to transcranial magnetic stimulation (TMS) in the affected hemisphere8-10 and the motor threshold (MT), 11 were found to be important predictors of clinical improvement.
Many recent studies have shown the importance of magnetic resonance imaging (MRI)-based metrics, including lesion size/location and connectome disruption (ie, the brain’s functional and structural connections), in poststroke clinical impairment and recovery.12-18 Here, we investigate the additive value of MRI-based measurements of structural connectome disruption that have been shown to be predictive of baseline impairment and recovery in our previous work.17,18 In particular, those studies used the Network Modification (NeMo) tool, 19 which quantifies each gray matter region’s white matter disconnectivity to the rest of the brain as well as the amount of disconnectivity between pairs of regions. The regional measurements, called change in connectivity (ChaCo) scores, represent the percentage of disrupted white matter fibers connecting to a given region. The pairwise disconnectivity measures represent the change in the number of fibers connecting any given pair of regions after removing those fibers that pass through the area of the lesion.
Machine learning methods are highly promising for quantitative predictions of poststroke recovery as well as assessment of demographic or imaging variables that are important in these predictions.20,21 Support vector machines (SVMs) and artificial neural networks (ANNs) have previously shown accurate results in predicting clinical scores in chronic stroke patients.22,23 SVM and tree-based methods (classification and regression trees [CARTs] and bagging forest) have also been used to classify patients into groups that did and did not have improvement in motor function and to identify significant predictors of these classes.10,24 A recent study reported that a classic regression method using elastic net (EN) regularization performed just as well as SVMs, ANNs, and random forest (RF) in predicting the clinical and radiological outcomes after endovascular therapy in acute ischemic stroke patients. 25
The primary aim of the present study was to assess the performance of common machine learning methods (SVM, ANN, CART, RF, EN) in predicting chronic stroke patients’ upper-extremity motor function after 6 weeks of intervention, based on demographic, clinical, neurophysiological, and imaging metrics. An advantage of EN compared with other methods is that variable selection and model fitting are performed simultaneously, which can be useful in high-dimensional data sets. 26 The upper-extremity Fugl-Meyer Assessment (UE-FMA), a comprehensive and consistent clinical scale, was used to assess upper-limb motor impairment before and after intervention.27,28 The secondary aim was to assess the importance of variables in predicting postintervention UE-FMA. We hypothesized that preintervention UE-FMA and neurophysiological variables are the most important predictors in predicting postintervention UE-FMA. The third aim of our study was to use the previously discussed machine learning methods to classify patients into 2 classes—that is, responders versus nonresponders—as opposed to the regression methods predicting continuous outcomes (postintervention UE-FMA) in the first aim. The classification of the patients into binary classes based on significant change in upper-extremity motor function, although a harder task overall because of the distribution of the change in UE-FMA, may be more easily utilized by clinicians in the clinical setting.
Materials and Methods
Participants
The data for this article were extracted and further analyzed from a subset of a broader multisite intervention trial, with the principal results reported elsewhere. 29 Institutional review board approval and individual consent were obtained at each site. The authors were able to obtain access to data collected from 2 out of the 12 institutions that participated in the original study, resulting in a subset of 102 patients (45 from the Burke Neurological Institute and 57 from Rancho Los Amigos rehabilitation center) out of the original study’s total of 199 patients. We had 2 patients with missing data; 1 had no identifiable lesion on MRI, and 1 patient was lost to follow-up. Adult (>18 years old) patients with residual hemiparesis from a first-time ischemic or hemorrhagic stroke within 3 to 12 months prior were enrolled in the study. Some patients sometimes had impairments in multiple domains. Patients scoring >1 for limb ataxia, >2 for best language, or a score of 2 for extinction and inattention on the National Institutes of Health Stroke Scale were excluded (see the original study for details on exclusion and inclusion criteria). 29 Handedness refers to prestroke.
Intervention and TMS Protocols
The detailed information of the repetitive TMS (rTMS) and physical therapy can be found in Harvey et al, 29 the article that originally presented these data. In brief, participants completed 18 therapeutic sessions over a 6-week period (typically 3× per week). Each session consisted of (1) 20 minutes of warm-up (stretching/strengthening) focusing on shoulder and elbow mobilization, (2) 10-minute rest, (3) repetitive TMS (active or sham, depending on the individual’s group assignment), (4) 5- to 10-minute rest, and (5) a 60-minute task-oriented rehabilitation therapy session that focused on arm and hand practice graded according to participants’ current Chedoke arm stage. We delivered TMS using a navigated brain therapy device (NBT, Nexstim Corporation, Finland). Active TMS was delivered using 1 Hz frequency to the noninjured motor cortex for > 15 minutes, per assigned protocol. Sham TMS aimed to provide no stimulation at the target site but, instead, delivered weak stimulation over a wide doughnut-shaped region around the target area, thus minimizing stimulation to the hand-arm primary motor cortex. One-third of patients received sham stimulation (2:1 randomization, n = 34) and two-thirds received real stimulation (n = 68); a previous study of the superset of 199 patients found that there were no differences in the change in UE-FMA between the sham and real stimulation groups. 29 We verified the same finding by performing a t-test of the change in UE-FMA between our data’s sham and real stimulation groups and found that there was no significant difference (P = .46). Because determining the impact of sham versus real stimulation was not a goal of our work and there were no differences in improvement in UE-FMA between the groups, we did not use this variable as a predictor. TMS-based neurophysiological information (difference in MT in the unaffected vs affected hemispheres and absence or presence of a MEP in the affected hemisphere) was collected for each patient. MT was determined for the extensor digitorum communis using the Nexstim software algorithm. 30 Muscles were at rest during MT determination. The TMS operator monitored the ongoing electromyograph (EMG) and excluded any MEPs in which EMG activation was ≥25 µV within 100 ms of stimulus onset. MT was determined by a minimum of 16 trials, using 50 µV minimum amplitude criteria. 31 If MT could not be established (ie, no MEP at the upper limit of stimulator output) in the affected hemisphere, patients were assigned a value of 100 (percentage maximum stimulator output). 32
Image Acquisition and Processing
Structural MRIs were acquired on Siemens 3T scanners prior to commencement of the intervention (T1 MPRAGE, 1-mm iso-voxel at both sites). Lesion masks were hand traced on patients’ native T1 scans. T1 images and the associated lesion masks were transformed to MNI space using both linear (FLIRT) and nonlinear transformation techniques (FNIRT) available in FSL (http://www.fmrib.ox.ac.uk/fsl/index.html). Lesion borders were confirmed by a neurologist (AB) who was blinded to the behavioral data, both in native space and again after transformation to MNI space. Left-hemisphere lesions were flipped on the x-axis, so that all lesions across both cohorts appeared in the right hemisphere in order to increase the signal to noise ratio of the imaging measures. The lesion masks were then processed through the NeMo Tool software, which estimates the amount of regional disconnectivity and disconnectivity between pairs of regions based on a database of 73 healthy control brains’ white matter connectivity maps (40 men, 33 women, 30.2 ± 6.7 years old). Regional disconnectivity measurements (ChaCo scores) were quantified as the percentage of white matter streamlines passing through a lesion divided by the total number connecting to that region, whereas pairwise disconnectivity measurements are given as z-scores quantifying the number of white matter fibers between pairs of regions that pass through a lesion.
Statistical Analysis
For the regression analyses, 5 machine learning methods (EN, 26 ANN, 33 SVM, 34 CART, 35 and RF 36 —see supplementary material for details) were implemented to predict postintervention UE-FMA. The input data set included 3 demographic variables (age, sex, and handedness before stroke), 3 clinical variables (time since stroke, left vs right hemisphere stroke, and preintervention UE-FMA), 2 TMS-based neurophysiological measures (difference in MT in the unaffected vs affected hemispheres and absence or presence of a MEP in the affected hemisphere), and structural disconnectivity measurements for 86 regions. Whereas the data set that includes the demographic, clinical, and TMS-based information only has a relatively lower number of input features (7 in total), the other 2 data sets incorporating imaging biomarkers have a higher number of features (86 + 7 = 93 in total). Therefore, we chose to implement ML methods on all the data sets to be able to compare directly the results of both low- and high-dimensional input data sets.
For the classification analyses, the 5 machine learning methods that were used for the regression analysis and a basic and popular classification method, the logistic regression (LR), were used to classify the patients into those who improved by a clinically meaningful amount versus those who did not, using the clinical, neurophysiological, and imaging metrics. The same variables were used for both regression and classification analyses. The motivation for performing classification in addition to regression is that it may be more useful clinically to provide a dichotomous outcome (responder vs nonresponder) to aid in treatment decisions. The minimal clinically important difference (MCID) in the FMA has been reported previously to be 5.5 37 ; thus, we used this number to separate our patients into the 2 groups with postintervention FMA minus pre-FMA <5.5 (nonresponder) or ≥5.5 (responder). Preintervention UE-FMA, time since stroke, age, and the difference in MT were standardized to facilitate the interpretation of the EN method’s coefficients.
Three data sets for each regression/classification analysis were constructed using different sets of input variables. First, a “clinical” data set was used that included only demographic, clinical, and TMS-based neurophysiological information. Next, 2 combined data sets were used that contained the variables in the clinical data set plus (1) ChaCo (regional disconnectivity) scores or (2) pairwise disconnection scores from the NeMo tool. Machine learning methods’ performance for the regression task was assessed using the root of mean squared error (RMSE) and R2, defined as
Each method was trained with 2 loops (outer and inner) of k-fold cross-validation (k = 10) to optimize the hyperparameters (see supplementary material for details and the values of the best hyperparameters selected in the inner loop) and test the performance of the methods. The outer loop provided a training set (9/10 folds) for the hyperparameters optimization of the machine learning methods and a test set (1/10 folds) for the method’s performance assessment using the best hyperparameters. Thus, the training data set included approximately 90 patients, whereas the testing data set included about 10 patients. The folds that were created in the inner and outer loops were stratified; thus, each fold contained the same proportion of patients who had a MCID in the FMA and those who did not with the original data set. The inner loop (repeated over 10 different partitions of the training data set only) performed grid search to find the set of method hyperparameters that minimized the average hold-out RMSE for regression or maximized AUC for classification (see supplementary material for the intervals of the hyperparameters). A method was fitted using those optimal hyperparameters on the entire training data set and assessed on the hold-out test set from the outer loop. The outer loop was repeated for 100 different random partitions of the data (see Supplementary Figure 1 for a visualization of the cross-validation scheme). The mean test R2 and RMSE in the regression analysis and the mean test AUC in the classification analysis (overall 10 folds × 100 iterations = 1000 test sets) were calculated to assess the performance of the methods for each data set. The performance metrics were compared across methods and input data sets with the Kruskal-Wallis and Wilcoxon rank-sum test and considered significantly different when P was <.05. False discovery rate correction was used to address the issue of multiple comparisons.
When the data are imbalanced in a classification task—that is, one class has more participants than the other—machine learning methods may tend to favor the class with the majority observation. Therefore, the methods may fail to make an accurate prediction for the minority class that has less information. Because of the class imbalance in our data (42% who had clinically significant improvement vs 58% who did not), the oversampling approach, synthetic majority oversampling technique (SMOTE), 38 was used to obtain a balanced training data set during the cross-validation and improve the prediction accuracy for the minority class. SMOTE compensates for imbalanced classes by creating synthetic examples using nearest neighbor information instead of creating copies from the minority class and has been shown to be among the most robust and accurate methods with which to control for imbalanced data. 39
We considered the importance of the variables in EN to be the magnitude of the regression coefficient of the method averaged over all 1000 results (100 iterations of the outer loop × 10 test data sets for each iteration). The importance of the variables for CART was considered to be the sum of squared error for all the splits in which a variable is used. 35 In RF, each variable is randomly permuted and the difference in the new MSE and the original MSE is considered that variable’s importance. 40 The importance of the variables in ANN is calculated by taking the absolute value of the input-hidden layer connection weight and dividing that by the sum of the absolute value of the input-hidden layer connection weight of all input neurons. 41 The difference in output for the maximum and minimum values of a given variable across the patients, while other variables are held constant at the mean across the patients, gives the importance of the variables for SVM. 42 All statistical analyses and graphs were performed using R (https://www.r-project.org), version 3.4.4.
Results
Patient Characteristics
Table 1 shows patient demographics, clinical information, lesion volume, and neurophysiological data. Supplementary Figure 2 shows the lesion heatmap over the individuals. Preintervention UE-FMA was significantly lower than postintervention UE-FMA (P < .01). The majority of the patients were right-handed (90 of 102 patients). The number of patients with left hemisphere stroke was similar to the number of patients with right hemisphere stroke (53 vs 49). A total of 43 patients had clinically significant increases in UE-FMA (responders), whereas 59 did not (nonresponders).
Patient Demographics and Clinical and Neurophysiological Characteristics (n = 102). a
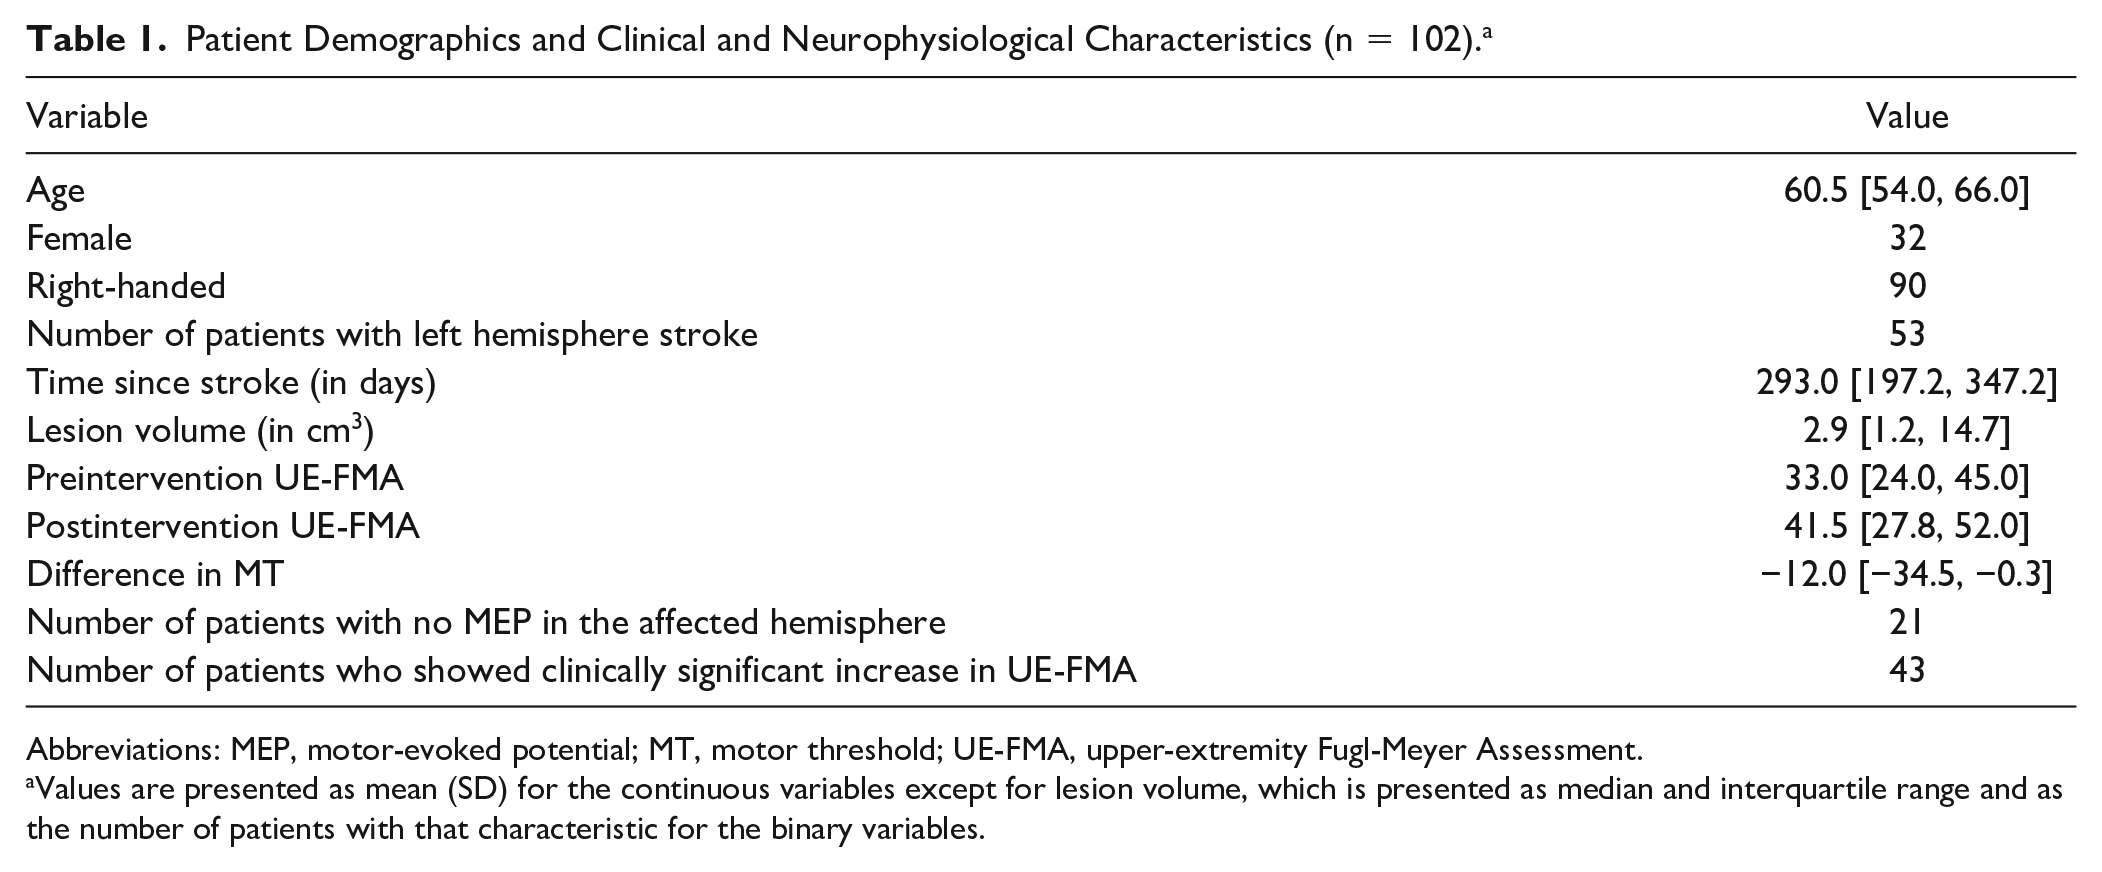
Abbreviations: MEP, motor-evoked potential; MT, motor threshold; UE-FMA, upper-extremity Fugl-Meyer Assessment.
Values are presented as mean (SD) for the continuous variables except for lesion volume, which is presented as median and interquartile range and as the number of patients with that characteristic for the binary variables.
Prediction of Postintervention UE-FMA
Figure 1 shows a violin plot (probability density function where white point = median, thick black bar = interquartile range [IQR]) of each method/data set’s RMSE over the 1000 results (from 100 iterations of the outer loop × 10 test data sets for each iteration), whereas Table 2 lists the median and IQR for each method/data set’s R2 and RMSE. Table 2 and Figure 1 illustrate that the EN method had the highest explained variance and lowest RMSE for all 3 input data sets. The addition of regional disconnectivity to the clinical variables resulted in less explained variance for SVM and RF and more explained variance for ANN and CART. SVM and CART showed significantly higher R2 values with the clinical and pairwise disconnection data set compared with the clinical data set only while RF and ANN had greater explained variance. The addition of both disconnectivity measurements to the clinical data set resulted in the same amount of explained variance for EN. The RMSE results largely agree with the R2 results because the EN method trained on the clinical data had the lowest RMSE. Most of RMSE results were significantly different across the different sets of input variables. Only the results of SVM and CART were not significantly different for the clinical + regional disconnectivity data set (P = .932). The RMSEs of clinical + regional disconnectivity and clinical + pairwise disconnectivity data sets were significantly greater than that of the clinical data set for all methods.
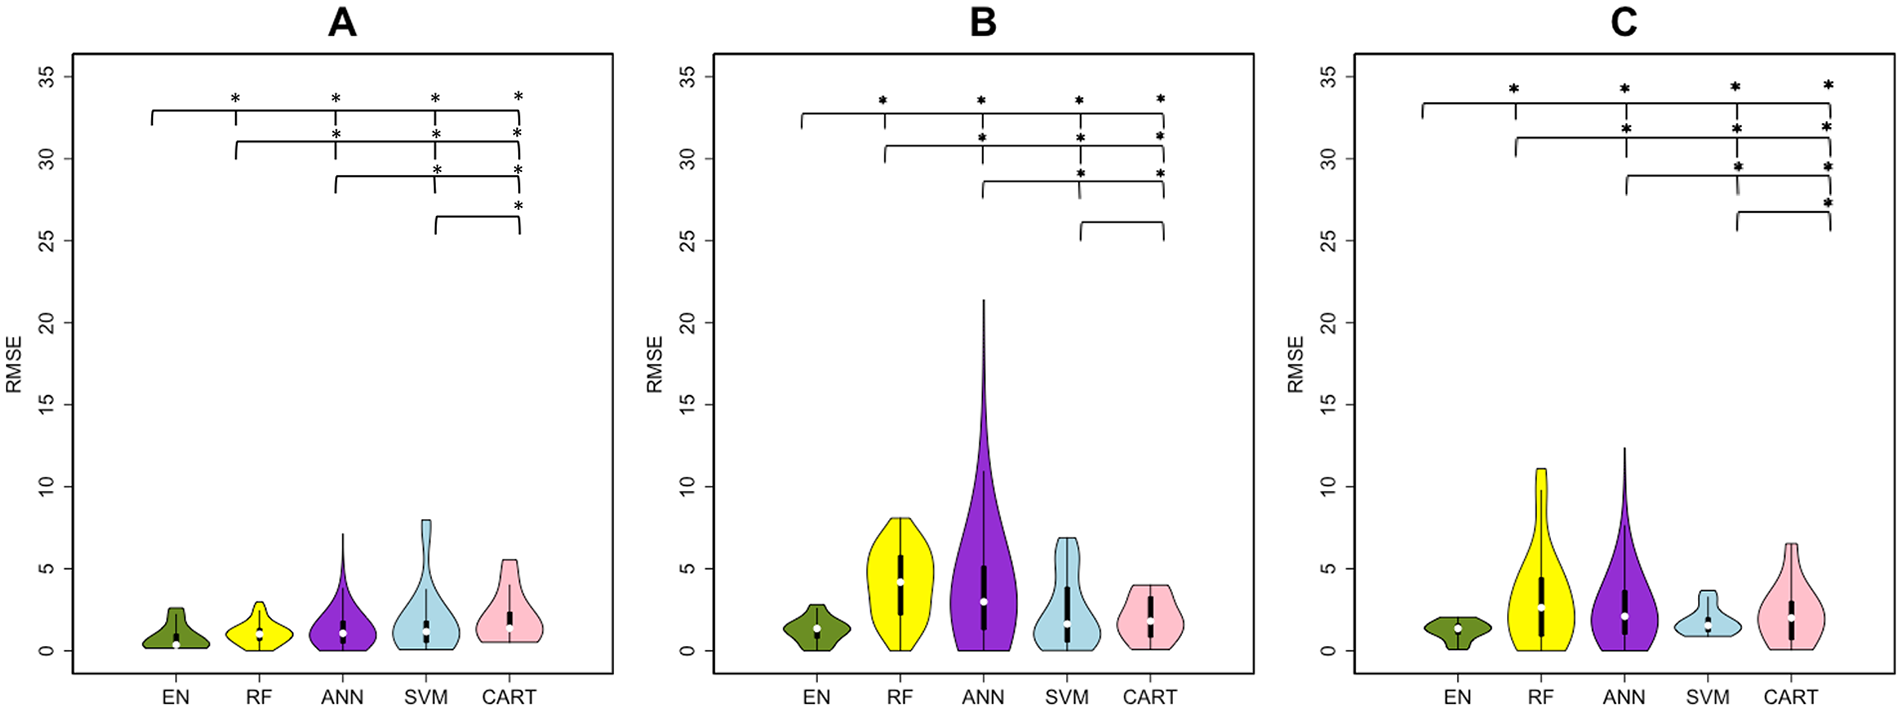
Root of mean squared error (RMSE) results of regression analysis in predicting postintervention upper-extremity Fugl-Meyer Assessment. Violin plots show the median, first and third quartiles, and minimum and maximum values of the RMSE distribution calculated by 5 machine learning methods: elastic net (EN), green; random forest (RF), yellow; artificial neural network (ANN), purple; support vector machines (SVM), blue; and classification and regression trees (CART), pink. The panels represent the RMSE over 3 sets of input variables (A) clinical, (B) clinical + regional dysconnectivity, and (C) clinical + pairwise disconnectivity.
The R2 and RMSE Results of the Methods in Predicting Postintervention UE-FMA. a
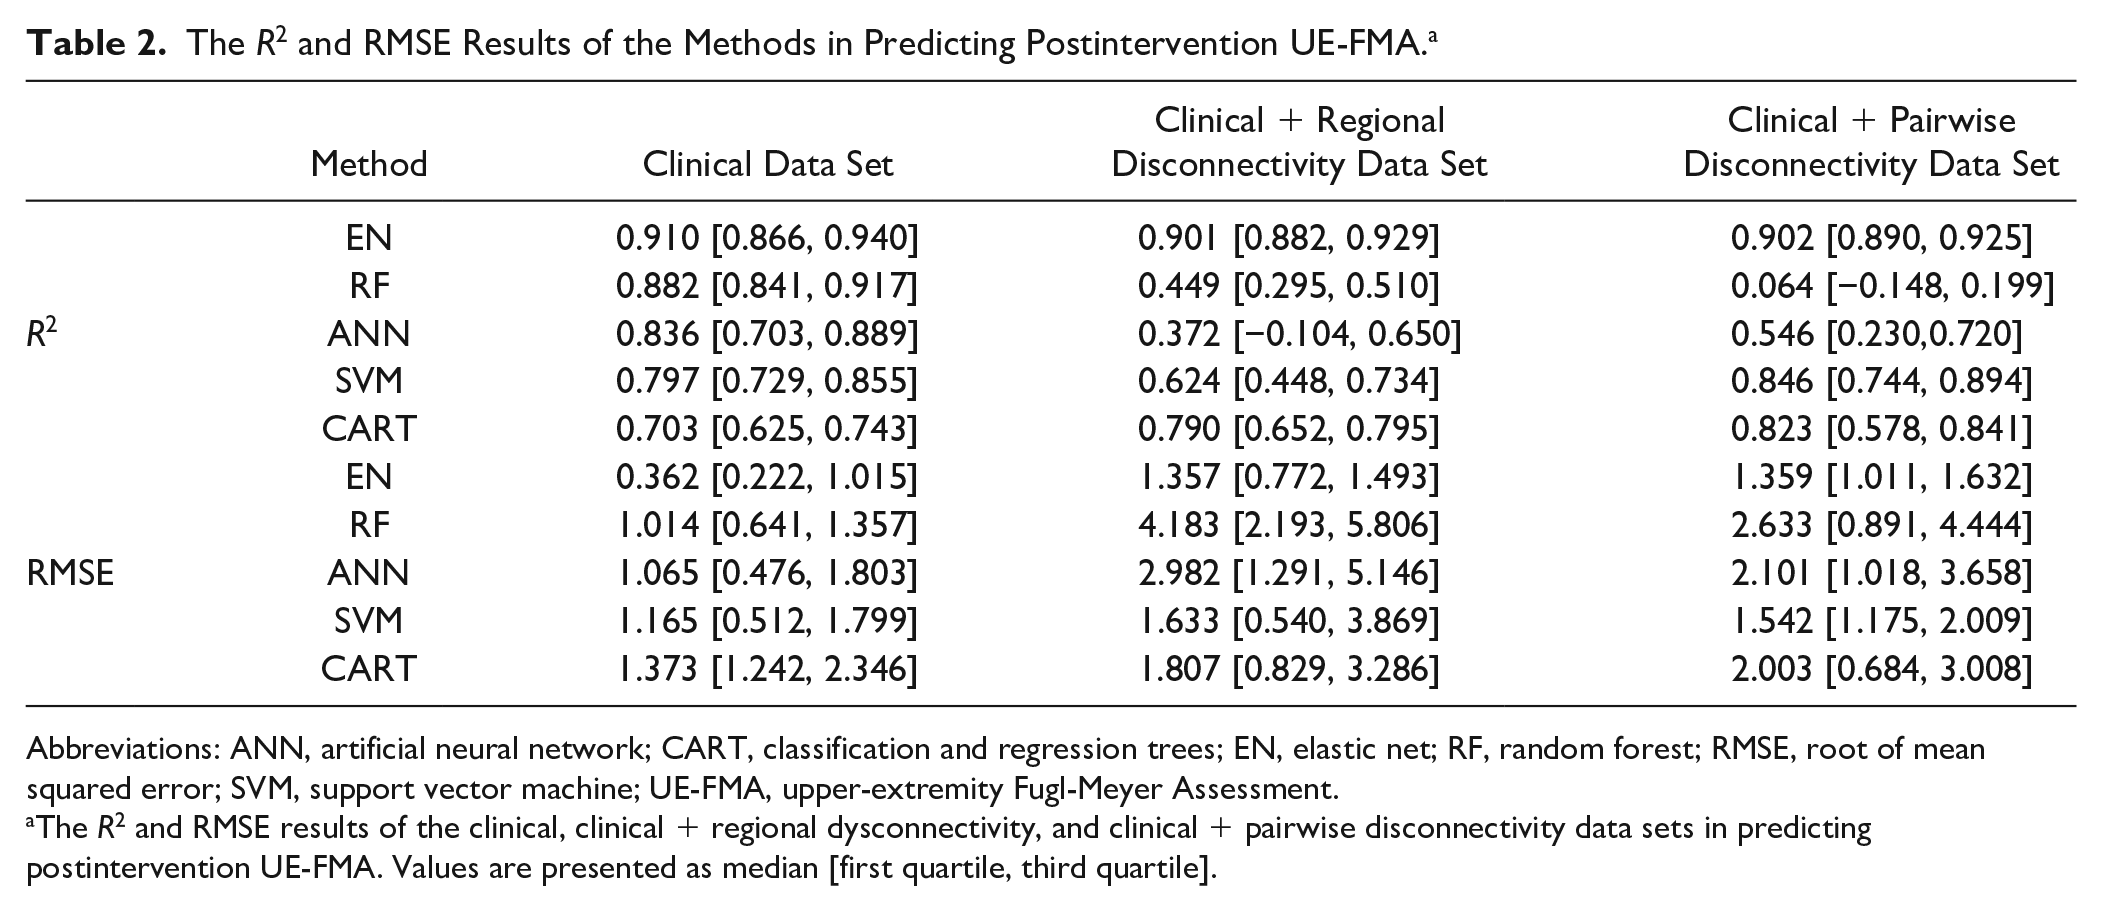
Abbreviations: ANN, artificial neural network; CART, classification and regression trees; EN, elastic net; RF, random forest; RMSE, root of mean squared error; SVM, support vector machine; UE-FMA, upper-extremity Fugl-Meyer Assessment.
The R2 and RMSE results of the clinical, clinical + regional dysconnectivity, and clinical + pairwise disconnectivity data sets in predicting postintervention UE-FMA. Values are presented as median [first quartile, third quartile].
CART showed the lowest R2 results and EN the highest R2 results for the data set based on clinical input variables. Figure 2 shows the observed postintervention UE-FMA versus the average (±SD) of each patient’s predictions over all 1000 models created during the cross-validation procedure. We see that, compared with the CART predictions, EN predictions are closer to the line of identity and the SDs are smaller, meaning that there was less uncertainty in the prediction. The uncertainty for the CART method predictions for individuals with observed UE-FMA <30 is particularly large.
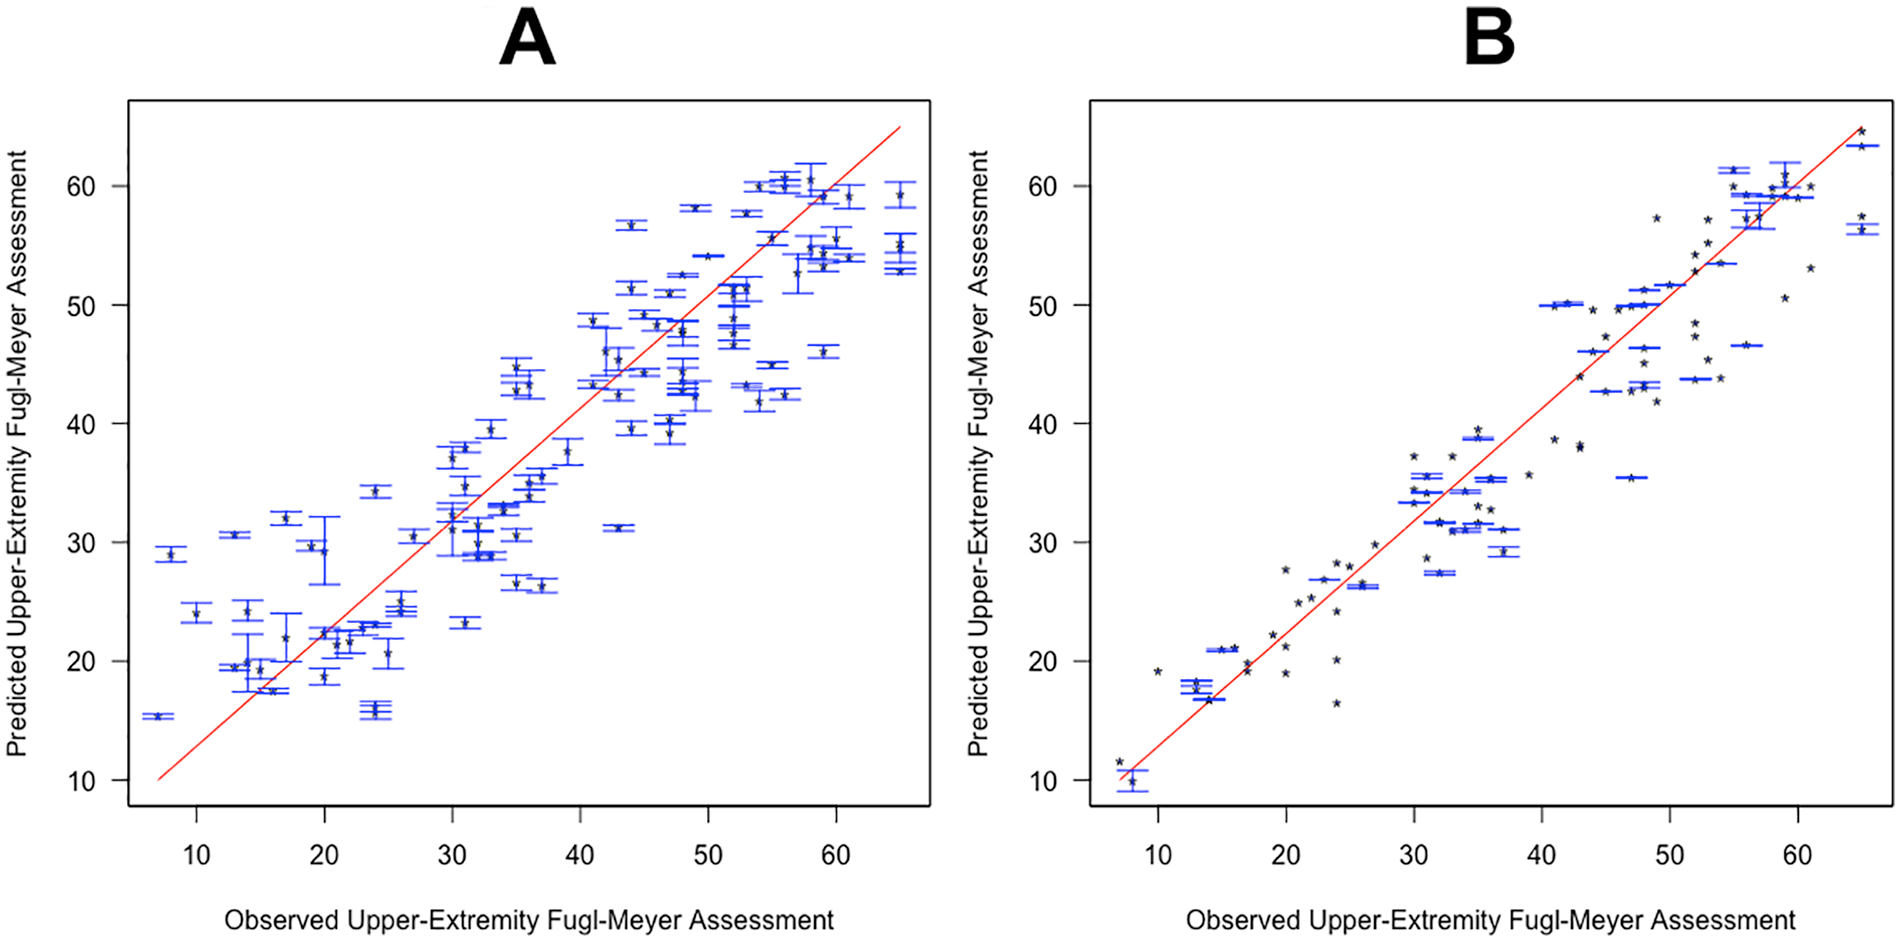
The observed versus predicted postintervention upper-extremity Fugl-Meyer Assessment (UE-FMA). Classification and regression tree (A) and elastic net (B) methods were trained on clinical input variables, and the observed and predicted postintervention UE-FMA are presented. Points represent the average prediction, whereas the bars represent the SD over 100 iterations in the outer loop.
Figure 3 shows bar plots indicating variable importance for each of the 5 methods that were trained on the clinical data set. Unsurprisingly, preintervention UE-FMA had the highest importance for all the methods, followed by the difference in MT as the next most important predictor. The absence or presence of MEP in the affected hemisphere and time since stroke were also found to be important predictors. Preintervention UE-FMA and difference in MT were chosen 1000 times over 1000 results (100 iterations of the outer loop × 10 test data sets for each iteration) performed with EN. The absence or presence of MEP in the affected hemisphere, sex, and right handedness were selected more than 400 times over 1000 results by the EN method (see Supplementary Table I).
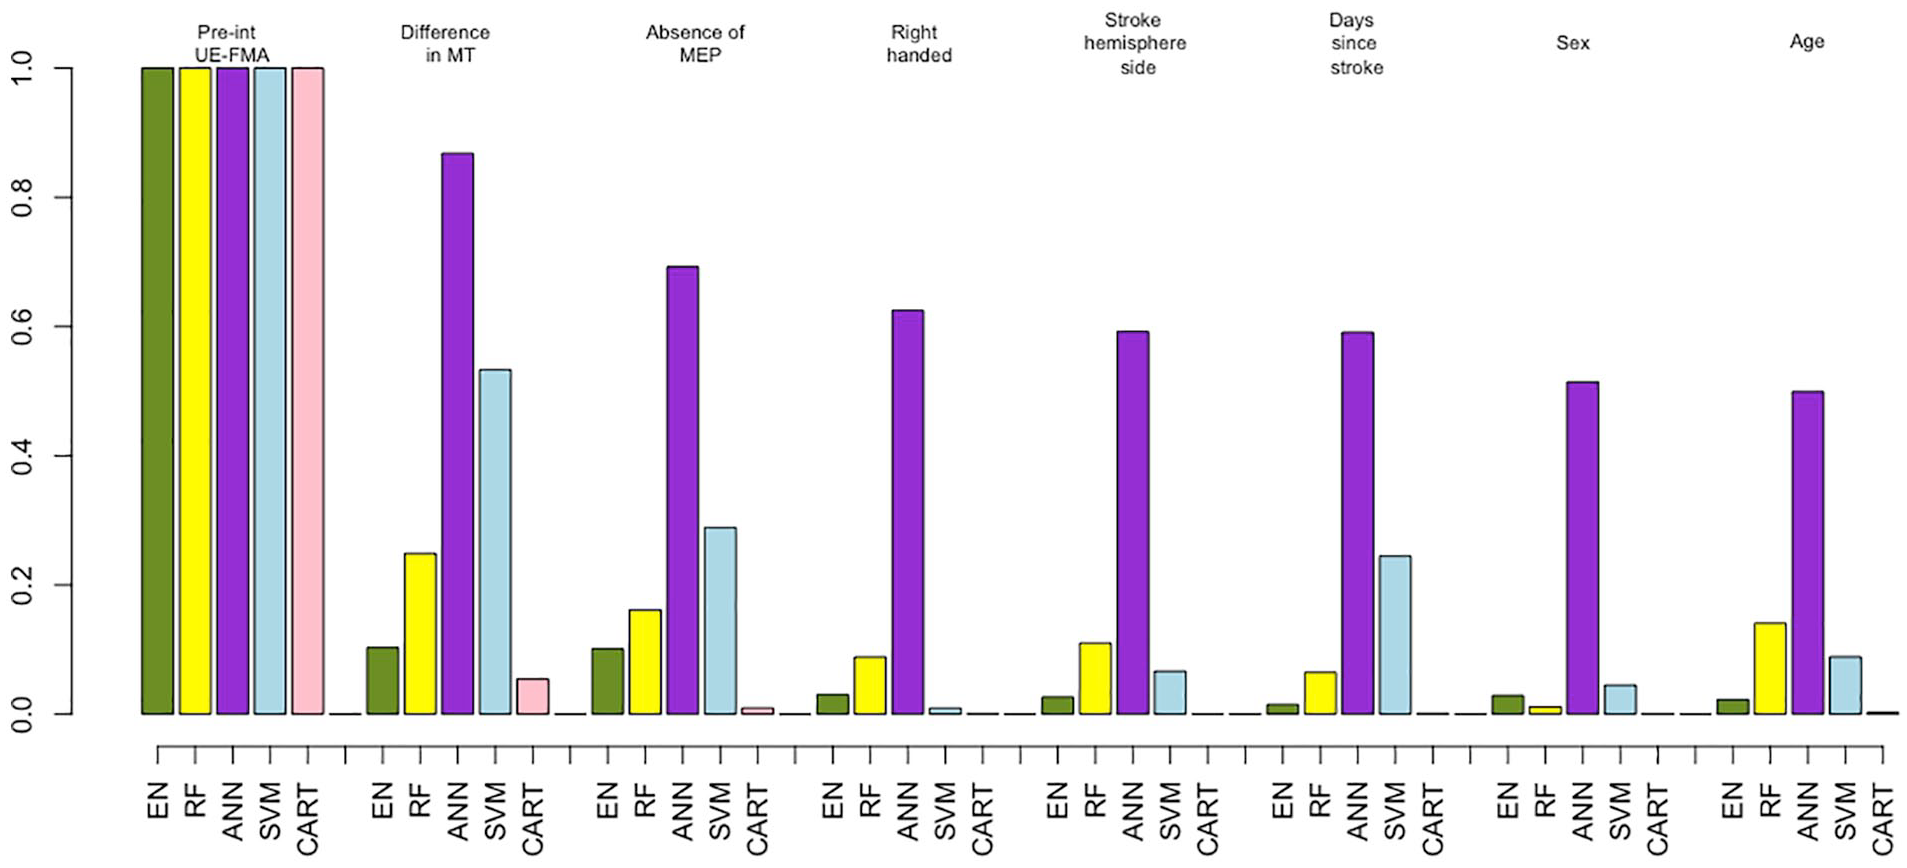
The importance of variables extracted from the methods using the clinical data set. Importance of the clinical variables only (demographics, and clinical and neurophysiological measures) for all 5 machine learning methods: elastic net (EN), green; random forest (RF), yellow; artificial neural network (ANN), purple; support vector machines (SVM), blue; and classification and regression trees (CART), pink. For visualization purposes, the weights of the variables’ importance are rescaled to be relative to preintervention UE-FMA.
Because of the importance of the preintervention UE-FMA and the difference in MT measures in the analyses predicting postintervention UE-FMA, we wanted to fully quantify the value of adding the TMS measures to a data set that included only preintervention UE-FMA. Therefore, in a post hoc analysis, we specifically investigated the role of the neurophysiological data in improving the postintervention UE-FMA predictions. We compared linear regression methods based on (1) preintervention UE-FMA only, (2) preintervention UE-FMA and difference in MT, and (3) preintervention UE-FMA and the absence or presence of the MEP at the affected hemisphere. The performance of the linear regression method for these 3 data sets was compared using the weighted Akaike Information Criterion (wAIC). 43 wAIC gives the probability that each of the possible models is the best model for the given data. The model based on preintervention UE-FMA and difference in MT was the best model, with a probability higher than for the model based only on preintervention UE-FMA (wAIC = 0.95 vs 0.05). The wAIC values show that the model that contains difference in MT is 19 (=0.95/0.05) times more likely to be a better model than the model based only on preintervention UE-FMA. However, the wAICs were close when the absence or presence of MEP was added to the model based only on preintervention UE-FMA (wAIC = 0.57 vs 0.43).
Figure 4 and Table 3 show that RF and ANN gave satisfactory results, having at least 1 AUC greater than 0.6 over the different sets of input variables. EN, RF, and LR trained on the clinical data performed similarly, with AUC values of 0.55 and 0.56, whereas SVM and ANN performed better than the other methods (AUC > 0.58). However, RF and ANN performed better than other methods (AUC = 0.63 vs AUC < 0.57) when trained on the data set that included the clinical + pairwise dysconnectivity data set. EN showed greater AUC compared with LR when trained on higher-dimensionality clinical + pairwise disconnectivity data (AUCEN = 0.57 vs AUCLR = 0.50; P < .05), whereas they performed similarly on the other input data sets (AUCEN = 0.56 vs AUCLR = 0.55 for the clinical data set and AUCEN = 0.50 vs AUCLR = 0.50 for the clinical data set; P > .05 for both). RF and ANN performed significantly better with the clinical + pairwise disconnectivity data compared with the clinical data set (Wilcoxon rank-sum test, P value <.05 for RF and P value =.014 for ANN), whereas SVM and LR performed the best on the clinical data set. EN, RF, and ANN performed well in classifying the patients who did not have a significant increase in UE-FMA, with a sensitivity greater than 60%, with the data sets including pairwise disconnectivity information, whereas SVM showed the best specificity (>80%, with the input data sets including disconnectivity measurements) in classifying patients with a clinically significant increase in UE-FMA (see Supplementary Table III). The importance of the variables was also analyzed for the classification task. RF, ANN, and CART showed preintervention UE-FMA as the best predictor in classifying the patients who did have a significant increase in UE-FMA and those who had not (see Supplementary Table II). The neurophysiological inputs were also found as important variables by some of the methods. The difference in MT was shown as the best predictor by SVM and LR and as the second strongest predictor by CART, whereas the absence or presence of MEP was given as the second most important predictor by ANN in classifying the patients who did have a significant increase in UE-FMA and those who had not. We want to emphasize that the classification task is not merely predicting a binarized version of the regression task’s outcome variable. The regression task was to predict postintervention UE-FMA (eg, patient number 1 was predicted to have UE-FMA 40 after the intervention), whereas the classification task was to predict the classes defined using the change between the preintervention and postintervention UE-FMA (eg, patient number 2 was predicted to be in the class that indicated a significant change in UE-FMA between preintervention and postintervention). The latter is a much more difficult task, as evidenced by the moderate AUC in the classification task when compared with the relatively high explained variance in the regression task.
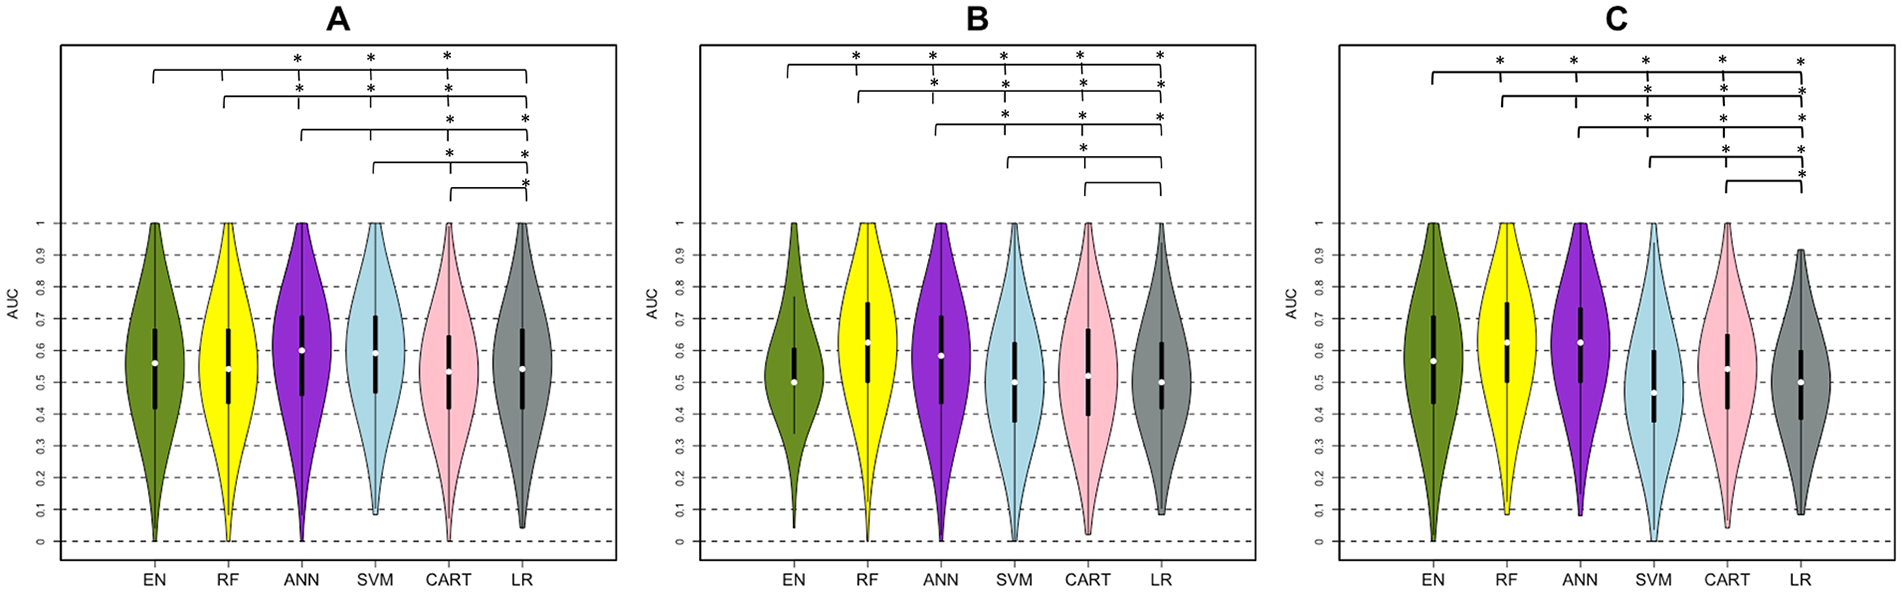
AUC results of classification analysis (MCID < 5.5 vs ≥ 5.5). Violin plots show the median, first and third quartiles, and minimum and maximum value of the AUC distribution calculated by 5 machine learning methods: elastic net (EN), green; random forest (RF), yellow; artificial neural network (ANN), purple; support vector machines (SVM), blue; classification and regression trees (CART), pink; and logistic regression (LR), gray. This was done using (A) clinical, (B) clinical + regional disconnectivity, and (C) clinical + pairwise disconnectivity data sets.
The Classification Results (AUC) for the 5 Machine Learning Methods and Logistic Regression Using 3 Different Input Data Sets. a
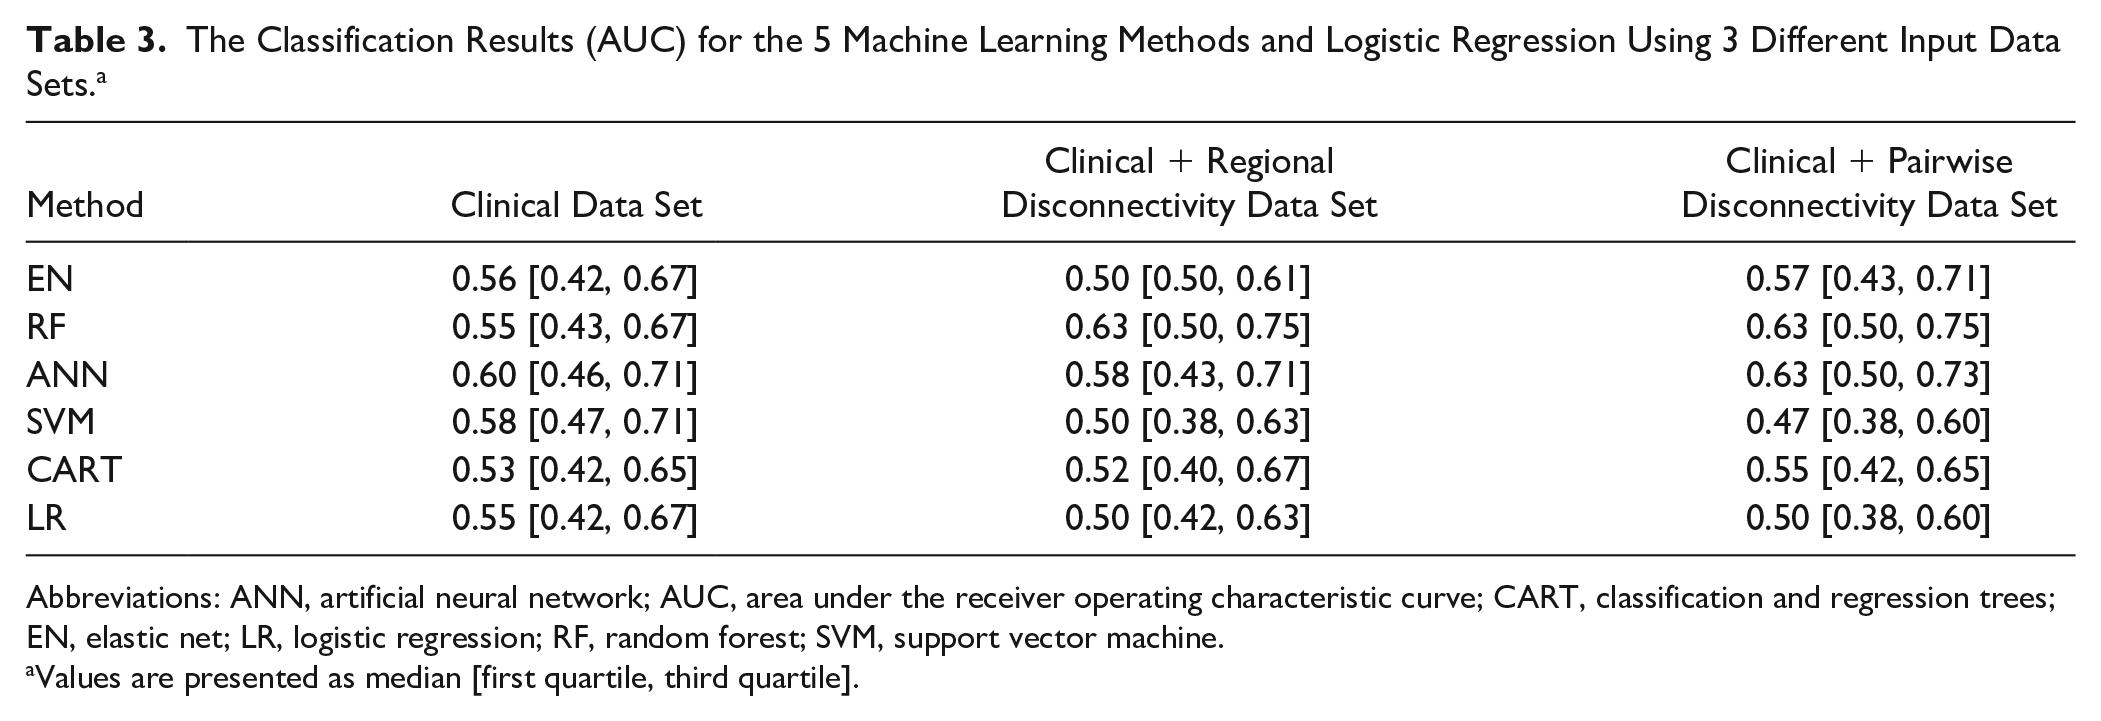
Abbreviations: ANN, artificial neural network; AUC, area under the receiver operating characteristic curve; CART, classification and regression trees; EN, elastic net; LR, logistic regression; RF, random forest; SVM, support vector machine.
Values are presented as median [first quartile, third quartile].
Discussion
Here, we applied 5 machine learning methods to predict the response to intervention in a large cohort of chronic stroke patients. We predicted both a continuous measure of postintervention UE-FMA as well as whether or not a patient would achieve a clinically meaningful improvement in UE-FMA. This study is one of the largest to date that uses various machine learning methods on demographic, clinical, neurophysiological, and imaging data to predict postintervention UE-FMA in chronic stroke. Our main findings were that (1) EN performed best when predicting the continuous-valued postintervention UE-FMA, (2) ANN and RF performed best when predicting the binary value of clinically meaningful change (or not) in UE-FMA, and (3) the difference in MT between affected and unaffected hemispheres had more importance than other metrics, including age, time since stroke, and imaging-based measures of structural disconnection in the predictive models. We conjecture that the EN was generally better in the regression task than others because it optimizes for sparsity; there were only a few variables in our data set that were strong predictors of postintervention UE-FMA. Important predictors in our data set, including preintervention UE-FMA and difference in MT, largely agree with previous findings.32,44-47 Preintervention UE-FMA highly correlated with postintervention UE-FMA. However, using other (clinical, demographic, neurophysiological, and imaging) variables together with preintervention UE-FMA in the same data set provided the relative importance of the variables. In particular, the post hoc analysis showed that adding difference in MT to a data set based only on preintervention UE-FMA significantly improves the method’s performance. Therefore, our results suggest that the difference in MT could be included in prospective studies for chronic stroke postintervention UE-FMA prediction. This may also have relevance in acute studies that typically use absence or presence of MEP in the affected hemisphere for outcome prediction, although this remains to be systemically tested. All methods showed higher RMSE results when the regional or pairwise structural disconnectivity measurements were added into the clinical data set, whereas RF and ANN showed better classification performance when pairwise structural disconnectivity measurements were used compared with the clinical data set.
There has been increasing interest in using machine learning methods for predicting impairment and recovery from stroke.10,17,18,48-51 One such study developed a model that had promising accuracy of acute poststroke outcome prediction after intra-arterial therapy with ANN and SVM using demographic and comorbidity information. 6 Rehme et al 52 used SVM to classify patients with respect to acute poststroke motor impairment based on the resting-state functional MRI; they reported a classification rate of >80%. In addition to SVM and ANN methods, a decision tree–based classification algorithm was used to predict upper-extremity outcome at 3 months and 2 years poststroke using baseline demographic, neurophysiological, and MRI features.10,53-55 The important predictors identified in the CART analysis were used to create a decision tree–based Predicting Recovery Potential (PREP) and Predicting Recovery Potential 2 (PREP 2) algorithms that can classify patients into categories of upper-limb recovery.10,53-55 These studies largely found that imaging metrics did not significantly improve accuracy of the PREP 2 algorithm (75%), and the accuracy was the same when MRI biomarkers were available, which agrees with our current findings. The PREP and PREP2 algorithms gave better classification accuracy than our CART analysis. However, our EN method trained on clinical + regional dysconnectivity data had higher sensitivity than the PREP algorithm. The PPV of the PREP 2 algorithm for patients in the good recovery category was similar to the PPV of our CART analysis (58% vs 60%). The same publications reported that the absence or presence of a MEP, acute motor functionality, and age were most important in predicting recovery; these are slightly different from the most important variables found in our study. This could be a result of many differences between our studies, the most likely of which is that our predictions were for changes in chronic stroke resulting from the intervention and not in predicting acute recovery. The former is a much more difficult task because the changes in the chronic stage of stroke are most often not as large and, thus, have a lower signal-to-noise ratio. Attempts have been made to predict the response of chronic stroke patients to treatment or interventions, although most are in moderate sample sizes or are correlation based and do not utilize machine learning techniques.56,57 One study, in particular, found that measures of functional and structural connectivity were important in predicting motor gains from therapy in chronic stroke; however, their overall variance explained by the predictors was moderate (R2 = 0.44), and their sample size was relatively small (n = 29). 58
The present study on chronic, intervention-related response prediction, supports findings in studies of postintervention UE-FMA prediction from the early phase that baseline impairment and ipsilesional corticospinal excitability are key predictive factors. An important addition to the body of knowledge for the present study, as well as examining a distinctly different phase of recovery poststroke than is most often reported (chronic), is one of method—namely, that the present best practice of ipsilesional MEP presence, although an important predictor here, was inferior to a bilateral recoding of resting MT. This subtle but important distinction would indicate that at least in the chronic phase, bilateral assessment of MEPs could be conducted for response prediction. A consideration for use of the MEP as an outcome predictor is the influence of amplitude and probability criteria for MEP presence determination, which requires further exploration. 59
The postintervention UE-FMA of the patients was tracked at 1, 3, and 6 months of the therapy. The UE-FMA at 1, 3, and 6 months of the intervention was significantly correlated with the postintervention UE-FMA just after the intervention (Pearson correlation coefficient > 0.90 for all). Also, we have observed that 80% of the patients who showed MCID in UE-FMA immediately after the 6 weeks of intervention showed persistent recovery with MCID ≥5.5 at 6 months after the intervention.
One limitation of this study is that we had only the patient’s structural T1 scans. It may be more informative to have access to the stroke individual’s diffusion or functional MRI, which have been shown to be important for extracting biomarkers that can predict impairment and recovery after stroke.7,15,60 One recent study showed increased baseline functional connectivity in certain regions in stroke patients who recovered better than those who did not. 60 Other studies have shown biomarkers of structural white matter integrity, particularly in the motor tracts, are predictive of recovery.7,61,62 Future studies will focus on collecting multimodal imaging data at baseline and postintervention to make better predictions of response to treatment as well as detect recovery-relevant changes that may shed light on neurological mechanisms of motor improvements. Besides the imaging variables, dexterity, attention, visuospatial neglect, and sensory deficits motivation/depression might be important predictors of motor impairment and will be added in future studies. Another limitation of this study was the sample size; although relatively large for studies of this nature, there are machine learning techniques (such as deep learning) that may improve accuracy of predictions but are best implemented on larger sets of data. Finally, while the NeMo tool has been applied in previous studies involving older patients,16-18 one of its limitations is that the healthy controls it is based on are quite younger than the stroke population. However, it should be noted that the ChaCo scores it produces are a percentage of disrupted connections, a measure that is likely preserved to a large extent in healthy aging patients.
In summary, the machine learning methods used here gave highly promising results in predicting postintervention UE-FMA using demographic, clinical, and neurophysiological data. The same methods could effectively classify patients into responders versus nonresponders based on change in UE-FMA but had lower accuracy. Thorough validation of these types of machine learning methods using larger, multimodal sets of data is needed. If successful, the final model will be easily accessible by clinicians and provide them a valuable tool (application or software) that can improve the accuracy of prognoses and response to treatment after rTMS and physical therapy as indicated in our study, which in turn can assist in developing personalized therapeutic plans at the chronic stage.
Supplemental Material
Supplementary_Material – Supplemental material for Machine Learning Methods Predict Individual Upper-Limb Motor Impairment Following Therapy in Chronic Stroke
Supplemental material, Supplementary_Material for Machine Learning Methods Predict Individual Upper-Limb Motor Impairment Following Therapy in Chronic Stroke by Ceren Tozlu, Dylan Edwards, Aaron Boes, Douglas Labar, K. Zoe Tsagaris, Joshua Silverstein, Heather Pepper Lane, Mert R. Sabuncu, Charles Liu and Amy Kuceyeski in Neurorehabilitation and Neural Repair
Footnotes
Supplementary material for this article is available on the Neurorehabilitation & Neural Repair website along with the online version of the article.
Authors’ Note
The deidentified data that support the findings of this study are confidential. The codes that were used in this study are available. Please see ![]() . CT carried out the statistical analyses, and drafted and wrote the article. DE performed study oversight, data interpretation, and manuscript development. AB checked the data, and commented on and reviewed the article. KZT, CL, and HPL organized, checked, and managed the data collection, and commented on and reviewed the article. JS performed neurophysiology data acquisition, processing, and interpretation. MRS supervised the analysis and reviewed the article. DL performed data collection, analysis, and interpretation. AK organized the study, and commented on and reviewed the article.
. CT carried out the statistical analyses, and drafted and wrote the article. DE performed study oversight, data interpretation, and manuscript development. AB checked the data, and commented on and reviewed the article. KZT, CL, and HPL organized, checked, and managed the data collection, and commented on and reviewed the article. JS performed neurophysiology data acquisition, processing, and interpretation. MRS supervised the analysis and reviewed the article. DL performed data collection, analysis, and interpretation. AK organized the study, and commented on and reviewed the article.
Declaration of Conflicting Interests
The author(s) declared no potential conflicts of interest with respect to the research, authorship, and/or publication of this article.
Funding
The author(s) disclosed receipt of the following financial support for the research, authorship, and/or publication of this article: This work was supported by the NIH R21 NS104634-01 (AK), NIH R01 NS102646-01A1 (AK), NIH R01 Grants (R01LM012719 and R01AG053949, MS), the NSF NeuroNex Grant 1707312 (MS), and NSF CAREER Grant (1748377; MS). DE serves on the advisory board for Nexstim Ltd.
References
Supplementary Material
Please find the following supplemental material available below.
For Open Access articles published under a Creative Commons License, all supplemental material carries the same license as the article it is associated with.
For non-Open Access articles published, all supplemental material carries a non-exclusive license, and permission requests for re-use of supplemental material or any part of supplemental material shall be sent directly to the copyright owner as specified in the copyright notice associated with the article.