
Abstract
Background. Evaluation of treatment effects on walking requires appropriate and responsive outcome measures. Objectives. To determine responsiveness of 5 walking measures and provide reference values for clinically meaningful improvements, according to disability level, in persons with multiple sclerosis (pwMS). Methods. Walking tests were measured pre- and postrehabilitation in 290 pwMS from 17 European centers. Combined anchor- and distribution-based methods determined responsiveness of objective short and long walking capacity tests (Timed 25-Foot Walk [T25FW] and 2- and 6-Minute Walk Tests [2MWT and 6MWT] and of the patient-reported Multiple Sclerosis Walking Scale–12 [MSWS-12]). A global rating of change scale, from patients’ and therapists’ perspective, was used as external criteria to determine the area under the receiver operating characteristic curve (AUC), minimally important change (MIC), and smallest real change (SRC). Patients were stratified into disability subgroups (Expanded Disability Status Scale score ≤4 [n = 98], >4 [n = 186]). Results. MSWS-12, 2MWT, and 6MWT were more responsive (AUC 0.64-0.73) than T25FW (0.50-0.63), especially in moderate to severely disabled pwMS. Clinically meaningful changes (MICs) from patient and therapist perspective were −10.4 and −11.4 for MSWS-12 (P < .01), 9.6 m and 6.8 m for 2MWT (P < .05), and 21.6 m (P < .05) and 9.1 m (P = .3) for 6MWT. In subgroups, MIC was significant from patient perspective for 2MWT (10.8 m) and from therapist perspective for MSWS-12 (−10.7) in mildly disabled pwMS. In moderate to severely disabled pwMS, MIC was significant for MSWS-12 (−14.1 and −11.9). Conclusions. Long walking tests and patient-reported MSWS-12 were more appropriate than short walking tests in detecting clinically meaningful improvement after physical rehabilitation, particularly the MSWS-12 for moderate to severely disabled pwMS.
Keywords
Introduction
Persons with multiple sclerosis (pwMS) consider walking as the most valuable bodily function, 1 with about 41% to 75% of people experiencing mobility problems.2,3 Considerable health care resources, such as rehabilitation and pharmacological interventions, are directed at reducing these mobility difficulties. Their evaluation requires appropriate and responsive outcome measures.
The review by Kieseier and Pozzilli 4 revealed that the patient-reported 12-item Multiple Sclerosis Walking Scale (MSWS-12) and objective clinician-rated short and long walking tests are reliable and valid measures. Short timed walking tests such as the Timed 25-Foot Walk (T25FW) measure walking speed and related disability, whereas longer distance walking tests such as the 2- and 6-Minute Walking Tests (2MWT and 6MWT) are thought to also encompass endurance and fatigability and therefore better assess functional capacity.
Responsiveness (an instrument’s ability to measure change over time 5 ) of walking measures, has not been sufficiently examined. Only a few MS studies6-11 have investigated this, focusing on disease progression (longitudinal measurement without targeted intervention) 6,9-11 or steroid treatment for MS relapses.7,8 So far, only restricted comparison of responsiveness between multiple walking measures has been undertaken and differentiation between disability levels has rarely been applied. 10 To the best of our knowledge, the responsiveness of walking measures in the evaluation of physical rehabilitation has not yet been studied.
Another important issue is the interpretation of change scores. For the T25FW at fast speed, a 20% change (exceeding between-day variability) has been advocated as being clinical meaningful for detecting changes that occur with disease progression12,13 or after treatment. 14 A recent study 15 revealed, however, a within-day variability of >20% for the timed 10-m walk test (10mWT) when baseline gait velocity was <1.2 m/s. Three studies have reported clinically meaningful change occurring with disease progression for 10mWT,6,9,10 6MWT.9,10 and MSWS-12. 10 Only one of these studies 10 stratified the sample based on disability level and use of walking aid. Reference values for clinically meaningful improvement after treatment interventions, for several disability levels, are lacking for all walking measures.
Consequently, the aims of this study were to (a) compare the responsiveness of objective short and long walking capacity tests and a patient-reported walking ability measure and (b) provide reference values for clinically meaningful improvement from both the patients’ and therapists’ perspective, according to disability level.
Methods
Participants
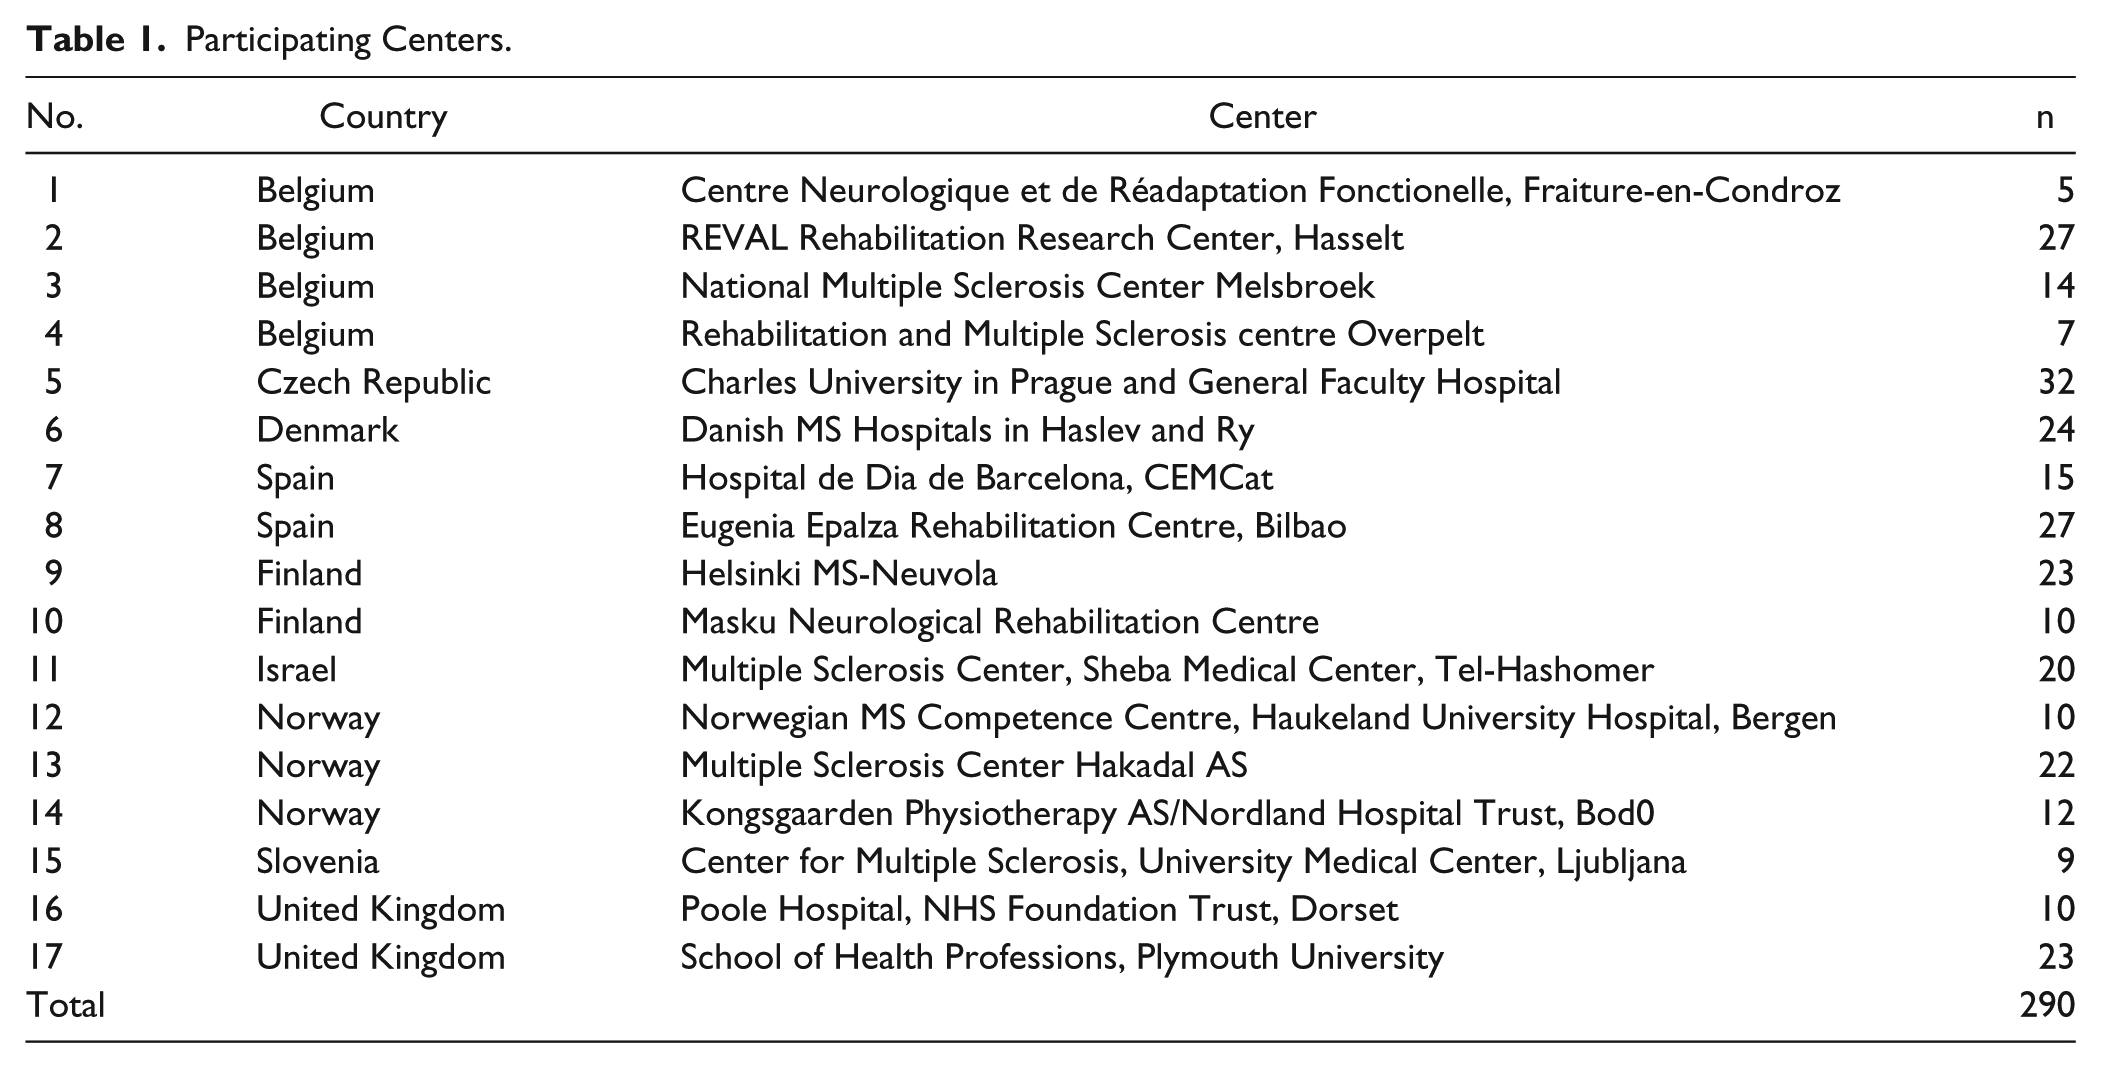
A convenience sample of 290 pwMS was recruited at 17 centers (Table 1) within the European RIMS (Rehabilitation in Multiple Sclerosis) network for best practice and research in MS rehabilitation (www.eurims.org). The study was approved by the Ethical Committee of Hasselt University, Belgium, as well as local ethical committees from each participating center.
Participating Centers.
Included subjects had a definite diagnosis of MS, 16 Expanded Disability Status Scale (EDSS) 17 score ≤6.5 as determined by neurologists, and received between 3 weeks and 3 months of inpatient or outpatient physical rehabilitation. Subjects were excluded if they had other medical conditions interfering with walking. All subjects provided written informed consent.
Experimental Design and Outcome Measures
A noncontrolled interventional multicenter study design was applied. Age, gender, EDSS, type of MS, and disease duration since diagnosis were recorded at baseline. Content of physical rehabilitation (setting, volume, goal, and treatment approaches) was recorded but will be published separately.
Walking measures were assessed before and after physical rehabilitation, according to a standardized test protocol, including details on test procedures, verbal instructions, and level of encouragement. Most participating centers had already demonstrated trustable data collection capacity, given participation in previous multicenter studies applying walking capacity tests.18,19 Subjects were first instructed to walk the T25FW at their own usual and comfortable speed. After a 1-minute rest they had to complete the same test at fastest speed. By flipping a coin, the order of the long walk tests (2MWT or 6MWT) was determined; the same order was kept at baseline testing and after the rehabilitation period. Between the 2 long walk tests, 15 minutes of rest was required, during which time the participant completed the MSWS-12 6 questionnaire.
The T25FW 20 is a short distance measure of walking speed. In accordance with the original protocol, a static start was applied and the stopwatch timing started when the lead foot crossed the start line and stopped when the lead foot crossed the finish line. The use of assistive device, such as a foot orthosis or a cane, was recorded and it was ensured that the same walking device was worn at each testing session. Walking improvement on the T25FW is indicated by negative change scores (in seconds).
The 2MWT and 6MWT21,22 are tests in which the participants are instructed to walk as far as possible in 2 and 6 minutes, respectively. Participants walked back and forth along a 30-m hallway, turning around cones at each end. They were allowed to use their habitual assistive device at each testing session. Walking improvement on the 2MWT and 6MWT is indicated by positive change scores (in meters).
The MSWS-12 8 is a patient-rated measure of walking ability. This questionnaire asks about limitations in walking due to MS during the past 2 weeks. Each of the 12 items is scored on a 1 to 5 scale. A total score can be generated and transformed to a 0 to 100 scale by subtracting the minimum score possible (12) from the patient’s score, dividing by the maximum score possible minus the minimum possible (60 − 12 = 48), and multiplying the result by 100. Walking improvement on the MSWS-12 is indicated by negative change scores.
A 7-point Likert-type global rating of change scale (GRS) 23 from both the patient and therapist perspective were applied as external criteria. The global impression of change question asked, “Compared to before rehabilitation, how would you rate your/the participant’s walking now?” The response categories were: very much worse, much worse, minimally worse, no change, minimally improved, much improved, very much improved.
Statistical Analyses
Descriptive statistics were used to describe the sample. Participant characteristics for those included in the final data set were compared with the dropouts using Mann–Whitney tests, median tests, or χ2, as appropriate. As the outcome measures did not show normal distribution, Wilcoxon’s matched-pairs signed-ranks test and sign test were used to examine the significance of changes in the walking measures after physical rehabilitation. In line with our previous research,18,19,24 the differential effect of disability level on the results of responsiveness was investigated, by categorizing participants according to walking disability as either “mild” (EDSS ≤ 4) or “moderate–severe” (EDSS > 4). In all analyses, P values ≤.05 were considered significant. Data were analyzed with SPSS 20 and SAS Enterprise 4.3.
Combined Anchor- and Distribution-Based Approach
In line with recommendations, 25 a combination of anchor- and distribution-based methods was used to assess responsiveness. Distribution-based methods, using standardized metrics, focus on the ability of an outcome measure to capture the amount of change needed to be observed in order to surpass measurement error, and aim to quantify the real change. Anchor-based methods focus on the correspondence of the change on the outcome measure of interest with the change on an external criterion, and aim to quantify the relevant change (the amount of change that is considered to be clinically important). Patient or therapist rated global rating scales are commonly used as external criterion.
Distribution-based approach
To quantify the real change, we calculated the smallest real change (SRC). The SRC takes 2 sources of variability into account: (a) the reliability of the outcome measure and (b) the naturally occurring variability in stable patients. Pfennings et al 26 reported the SRC at both the group and individual levels.


The stable group included patients with the response category “no change” on the GRS from the patient/therapist perspective. Outliers for change scores (≤ or ≥3 * standard deviation) in the stable group were omitted.
Anchor-based approach
To compare responsiveness of the 5 walking measures, we calculated the receiver operating characteristic curve (ROC) and the area under this curve (AUC) with its 95% confidence interval. 27 ROC compares the rate at which the threshold correctly identifies participants change (sensitivity) with the rate at which participants are identified as showing change in the measure but not in the external criterion (1 − specificity). An AUC value of ≤0.5 indicates that the outcome measure is not responsive 27 (Figure 1). The bigger the AUC (the more the ROC curve approaches the upper left corner), the more responsive is the measure. 27 AUC can be interpreted as the probability of accurately discriminating between patients who have improved or not. In our analyses, this discrimination was based on response categories of the GRS from patient/therapist; response category “no change” was defined as the stable group and categories “minimally/much/very much improved” as the improved group. The categories of “very much,” “much,” or “minimally worse” were not retained because of the small percentage of patients perceiving themselves/therapists indicating patients to deteriorate.
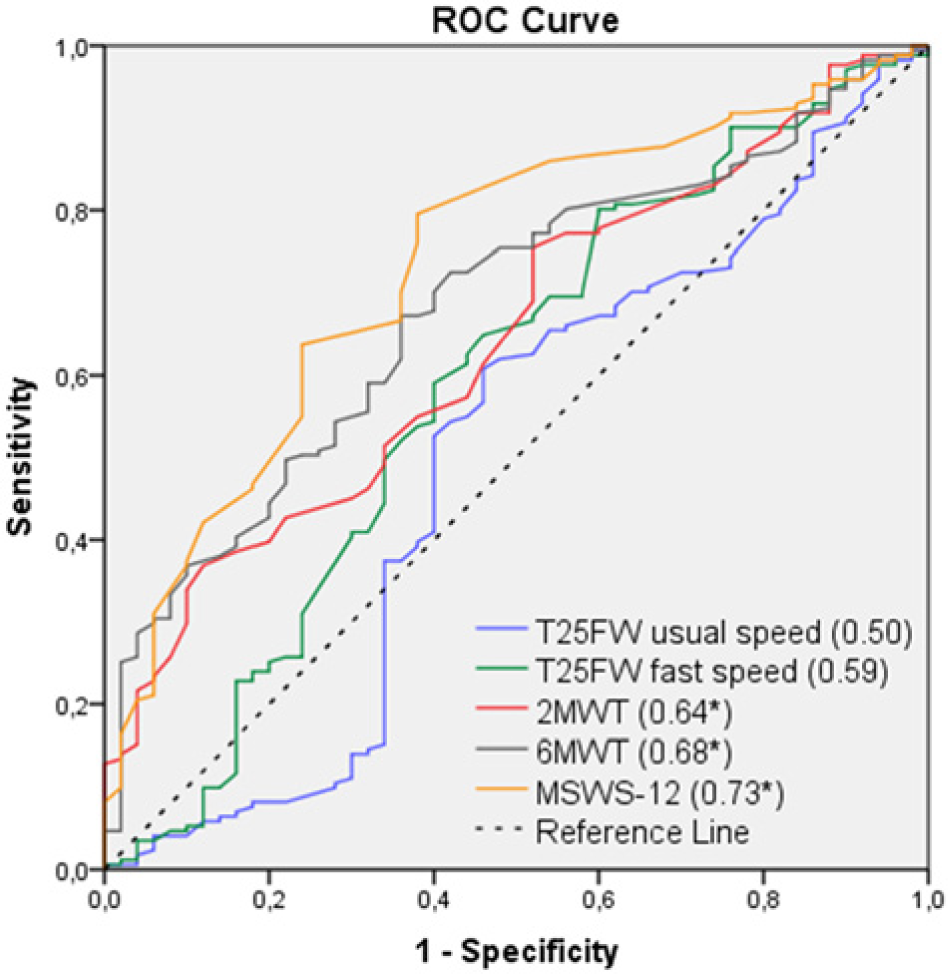
Receiver operating characteristic curves (ROCs) and the areas under the ROC (AUCs) of walking measures from the patients’ perspective for the “whole” group.
To provide reference values for clinically meaningful improvement, we calculated the minimally important change (MIC), defined as the mean change score in patients who showed a minimally important change according to the external criterion. This was calculated by applying linear regression analysis adapted from de Groot et al 6 :
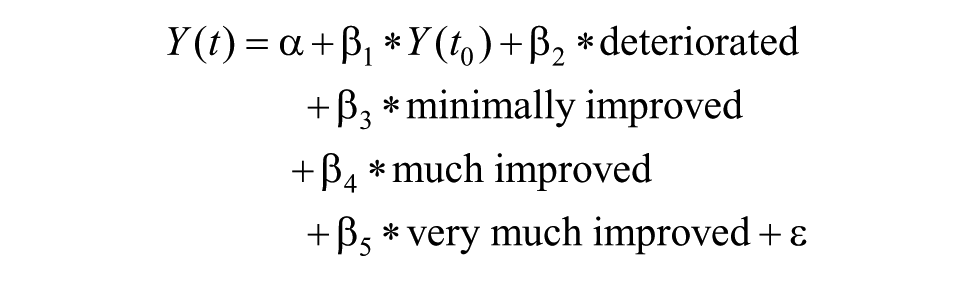
Scores on the walking measures postintervention were used as the dependent variables, Y(t). Four dummy variables based on the external criteria (deteriorated, minimally improved, much improved, very much improved) and the scores on the walking measures preintervention, Y(t0), were used as independent variables. The stable group (“no change” on the external criteria) was used as the reference group. In the formula, β3 is a differential intercept coefficient, which indicates how much the mean value of the minimally improved group differs from the mean value of the reference group, and provides an estimate for the MICimprovement. Because of low frequencies for “very much worse,” “much worse,” and “minimally worse,” these subjects were classified in one category “deteriorated.”
Weighted kappa (κw) and percentage agreement were calculated to investigate agreement between the patient and therapist GRS scores. To justify our choice and cutoff for the external criteria, we conducted Spearman correlations between change scores on the walking measures and the GRS, and a linear trend analysis (analysis of variance) of change scores according to the stratification of the patient/therapist GRS scores.
Combined anchor- and distribution-based approach
The interaction between SRC and MIC is illustrated and explained in Figure 2. The selection of the most appropriate evaluative outcome measure to detect change was based on the comparative responsiveness (highest AUC), whether |MIC| > |SRCind or group|, and whether the results were comparable from the patient and therapist perspective.
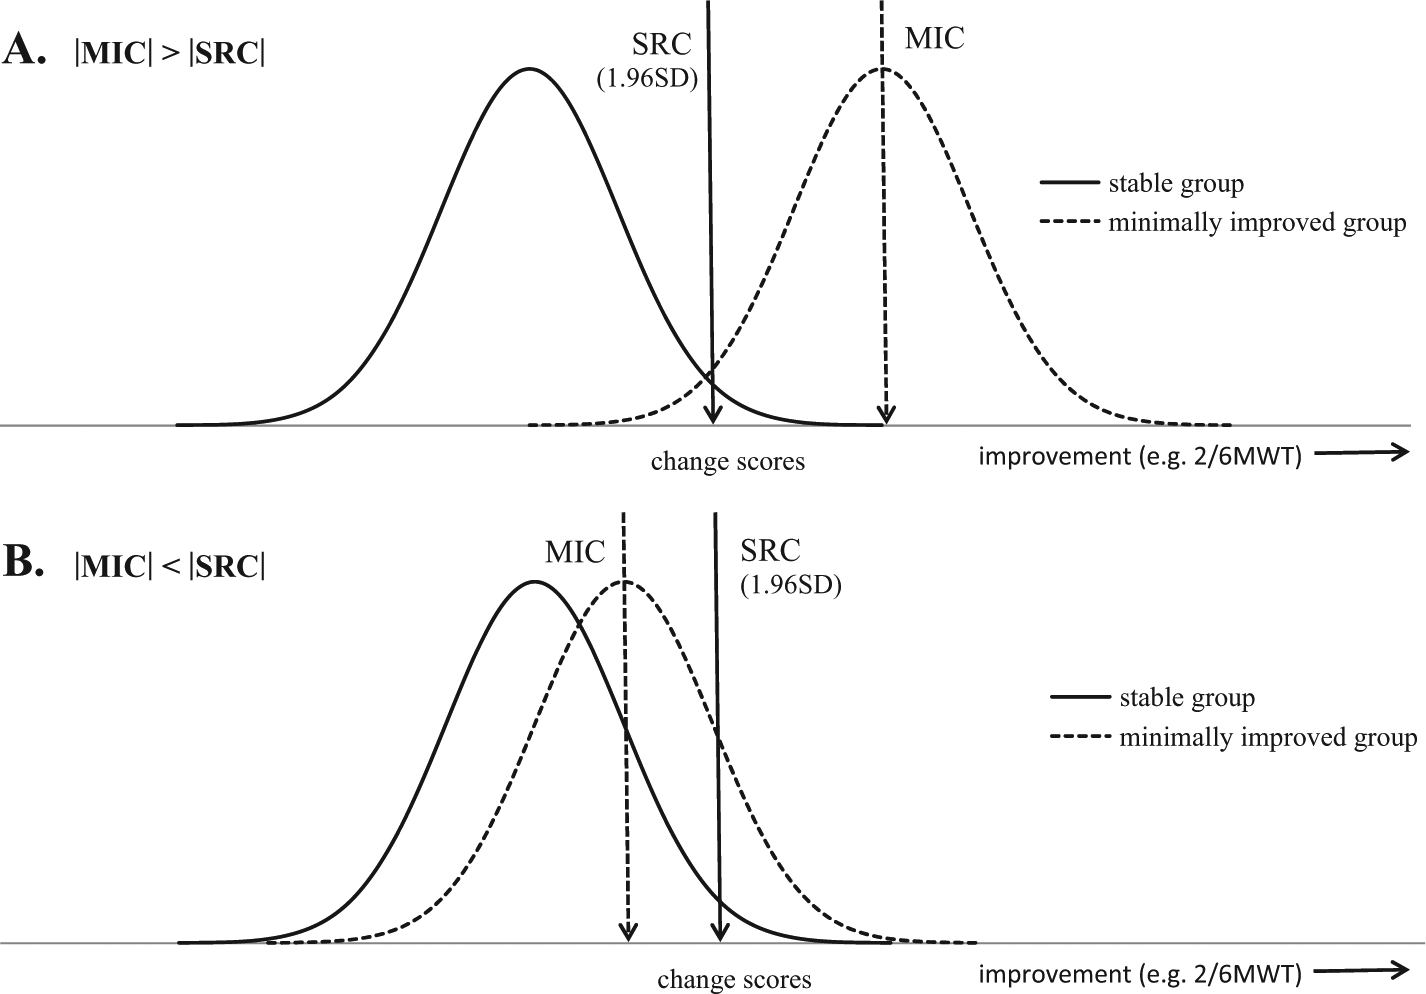
Real (smallest real change [SRC]) and clinically meaningful (minimally important change [MIC]) change on the spectrum of change scores. The overlap between the distribution of change score of the stable group and distribution of change scores of the minimally improved group indicate the usefulness of the outcome measures to detect change. (A) If minimal overlap occurred, the MIC exceeds SRC (measurement error) and the outcome measure is useful. (B) If large overlap occurred, the MIC does not exceed SRC and therefore the outcome measure is unsuitable to detect clinically meaningful change.
Results
Sample Characteristics
Six patients who were not assessed after the rehabilitation period because of unforeseen medical circumstances (eg flu, fracture, pancreatitis), did not significantly differ from the group included in the analysis (n = 284) for age, gender, EDSS, duration of disease, and type of MS. Table 2 shows the participant characteristics for the whole group and by disability levels.
Sample Characteristics.
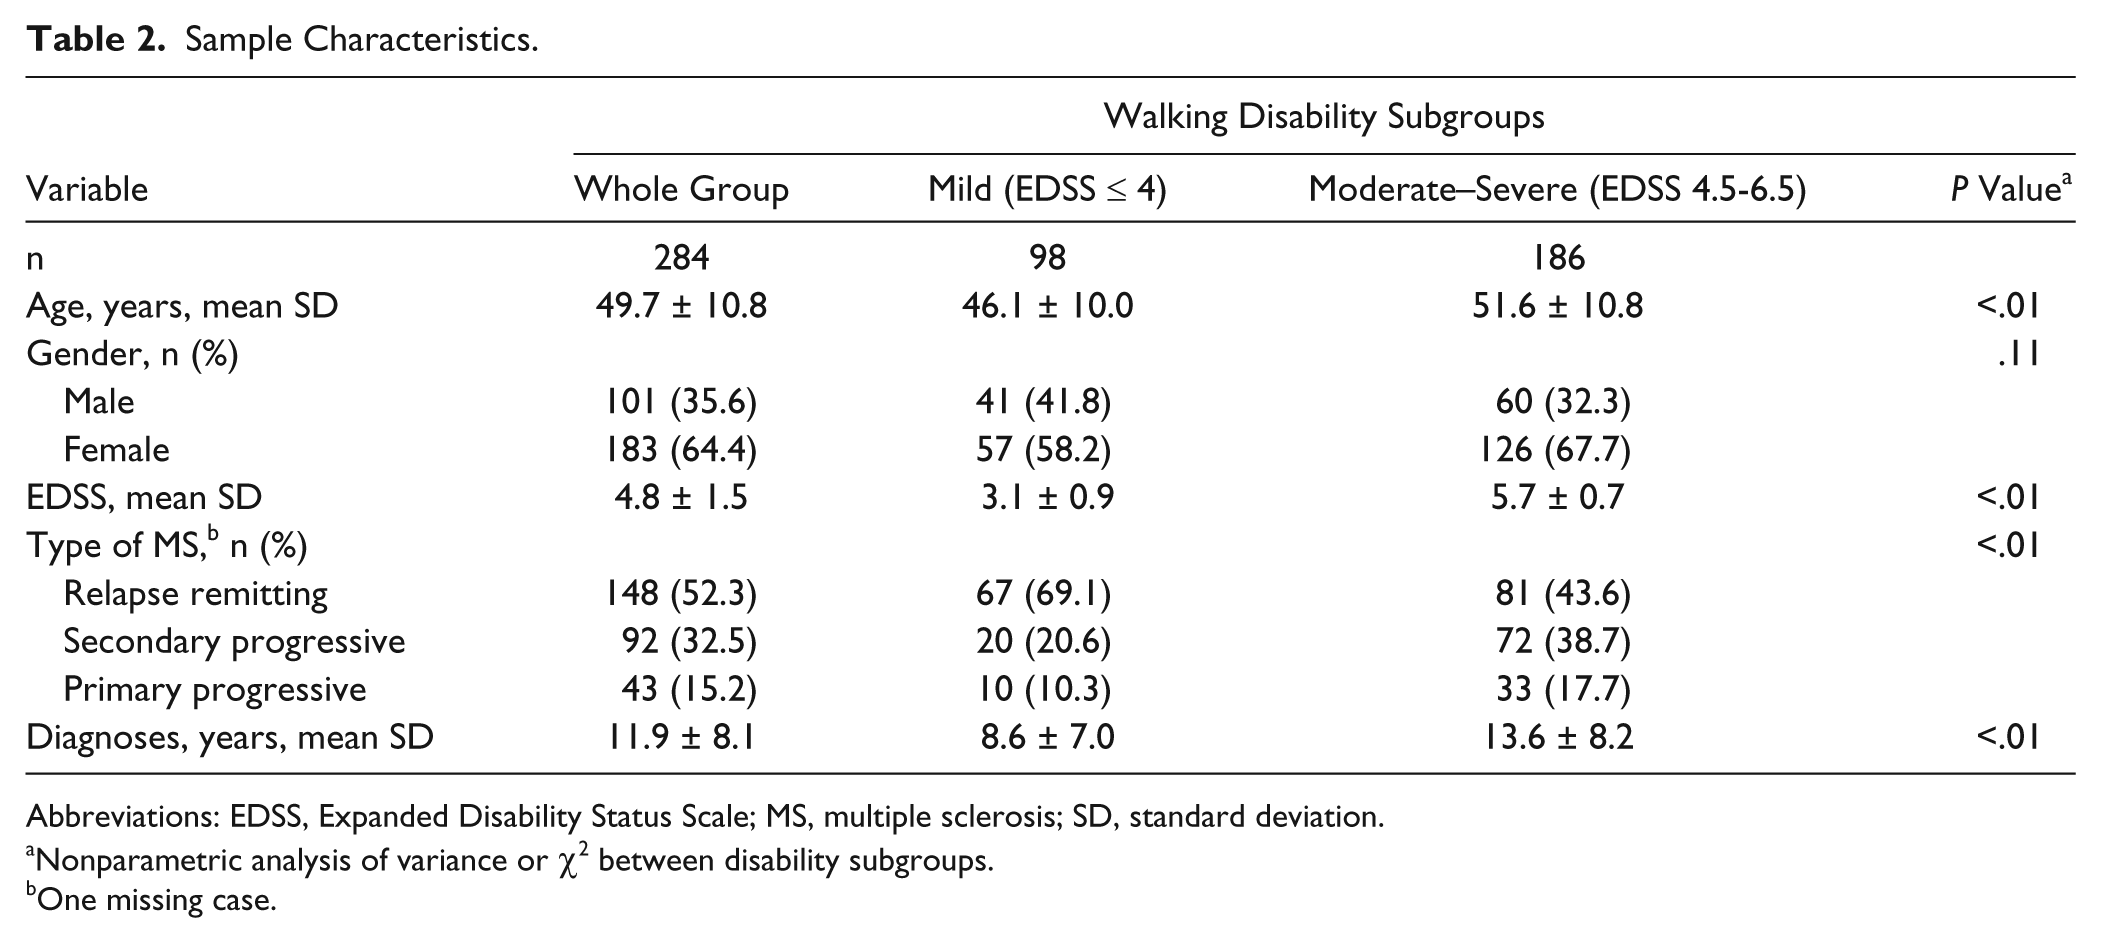
Abbreviations: EDSS, Expanded Disability Status Scale; MS, multiple sclerosis; SD, standard deviation.
Nonparametric analysis of variance or χ2 between disability subgroups.
One missing case.
Effect of Physical Rehabilitation
All walking measures showed statistically significant improvements (Table 3), indicating better performance after physical rehabilitation, regardless of disability level.
Changes in Walking Measures After Physical Rehabilitation (Mean SD).
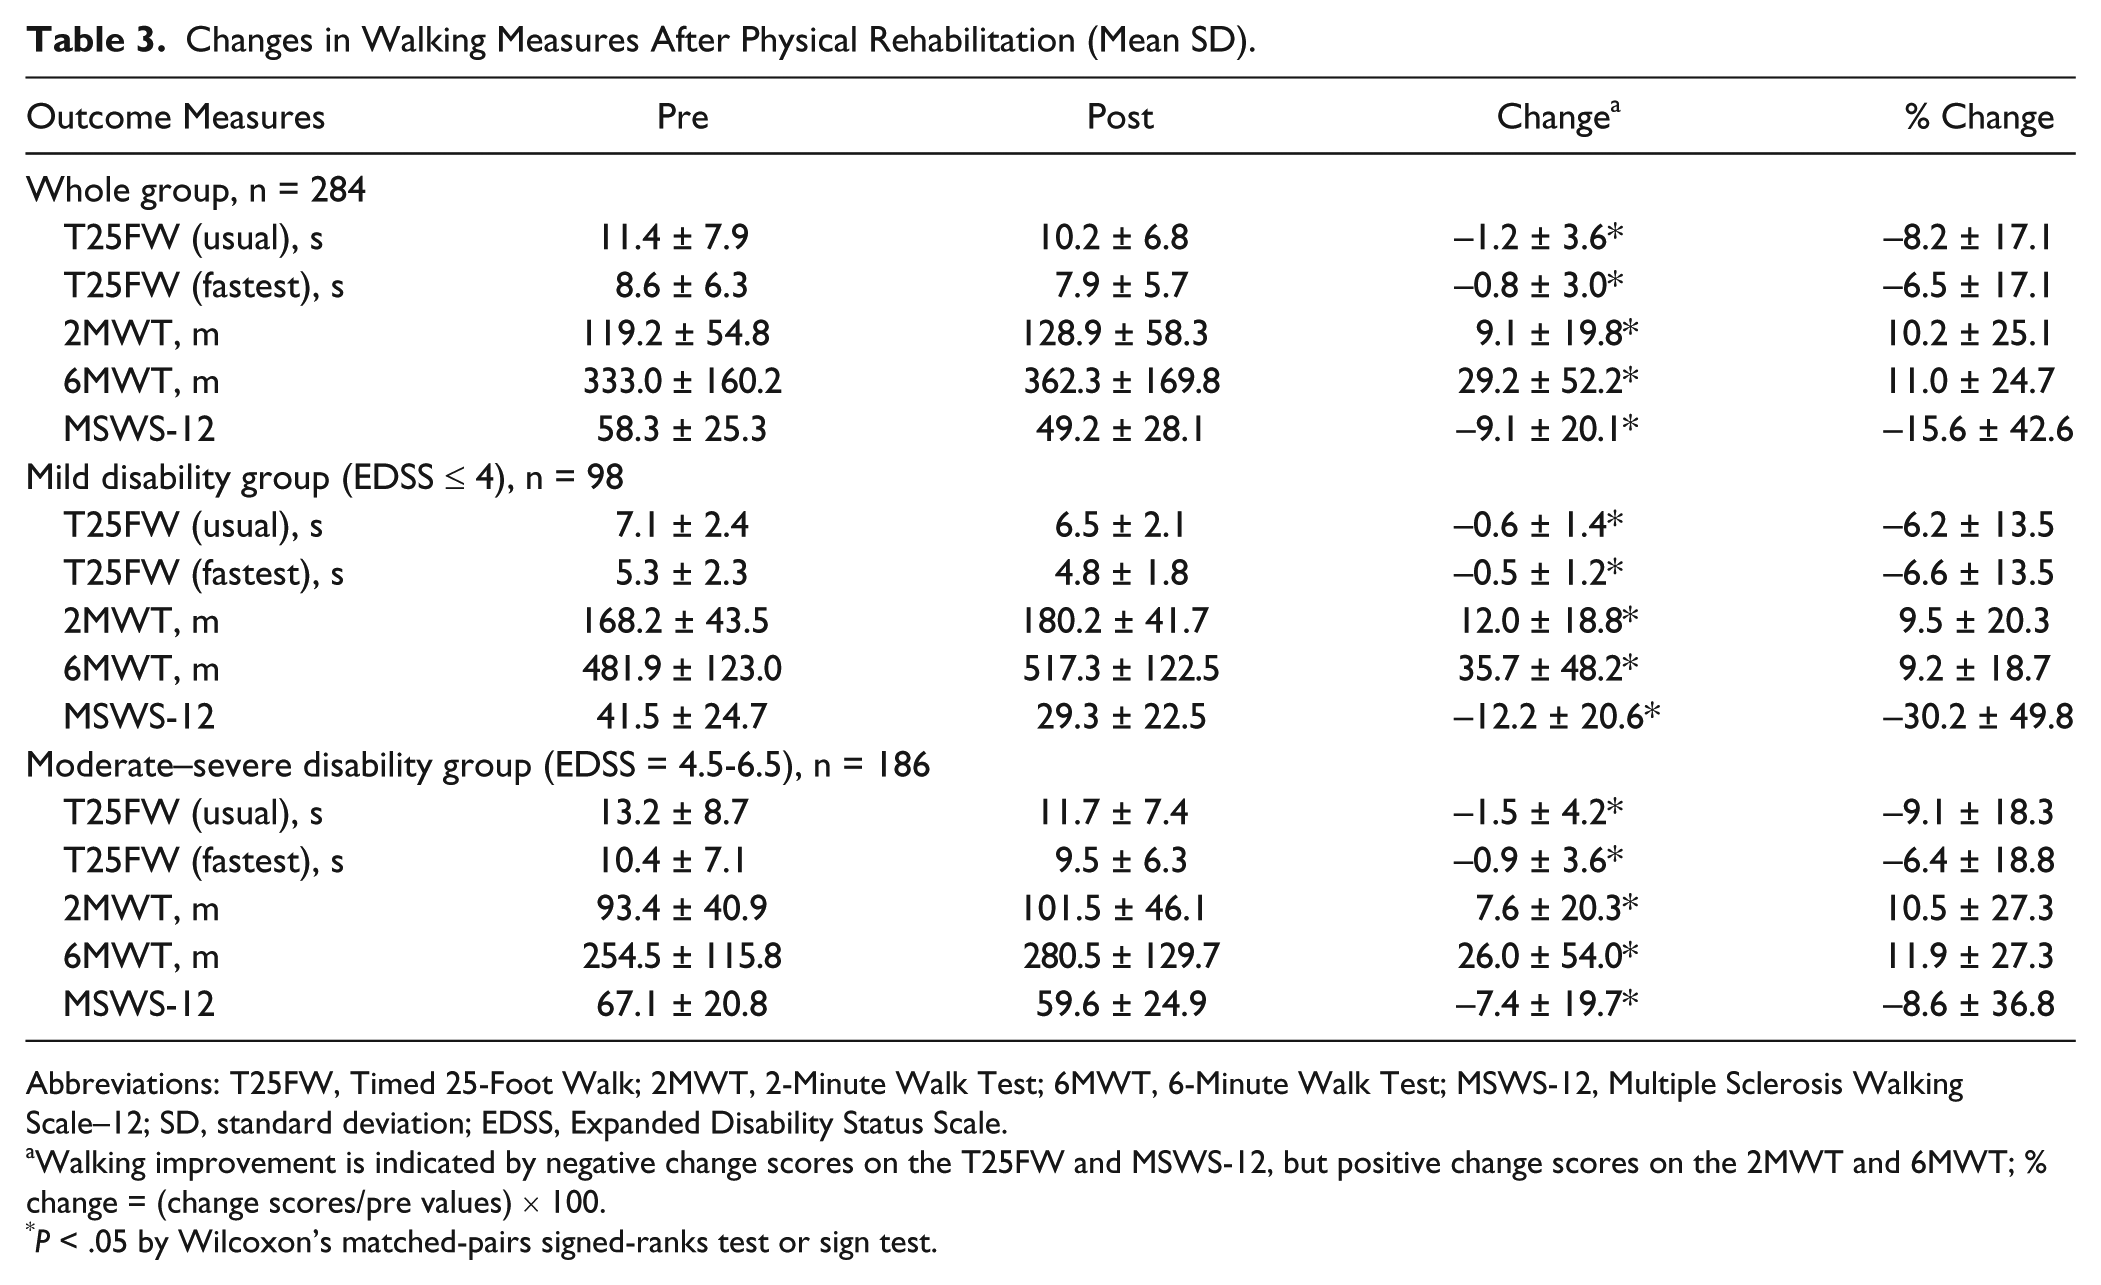
Abbreviations: T25FW, Timed 25-Foot Walk; 2MWT, 2-Minute Walk Test; 6MWT, 6-Minute Walk Test; MSWS-12, Multiple Sclerosis Walking Scale–12; SD, standard deviation; EDSS, Expanded Disability Status Scale.
Walking improvement is indicated by negative change scores on the T25FW and MSWS-12, but positive change scores on the 2MWT and 6MWT; % change = (change scores/pre values) × 100.
P < .05 by Wilcoxon’s matched-pairs signed-ranks test or sign test.
Table 4 details the frequencies and percentages of GRS scores, demonstrating that the majority of patients (60%) and therapists (65%) reported change as either “minimal” or “much improved.” Patients/therapists classified 10% and 7%, respectively, as “very much improved,” approximately 20% as “stable,” and only 11% and 6%, respectively, as “very much,” “much” or “minimally worsened.” Agreement between the patient and therapist perspective was highly significant (κw = 0.46, P < .01, 50% agreement).
Changes in Walking Measures (Mean ± SD) According to the Impression of Change on Walking (GRS) of Patient and Therapist.
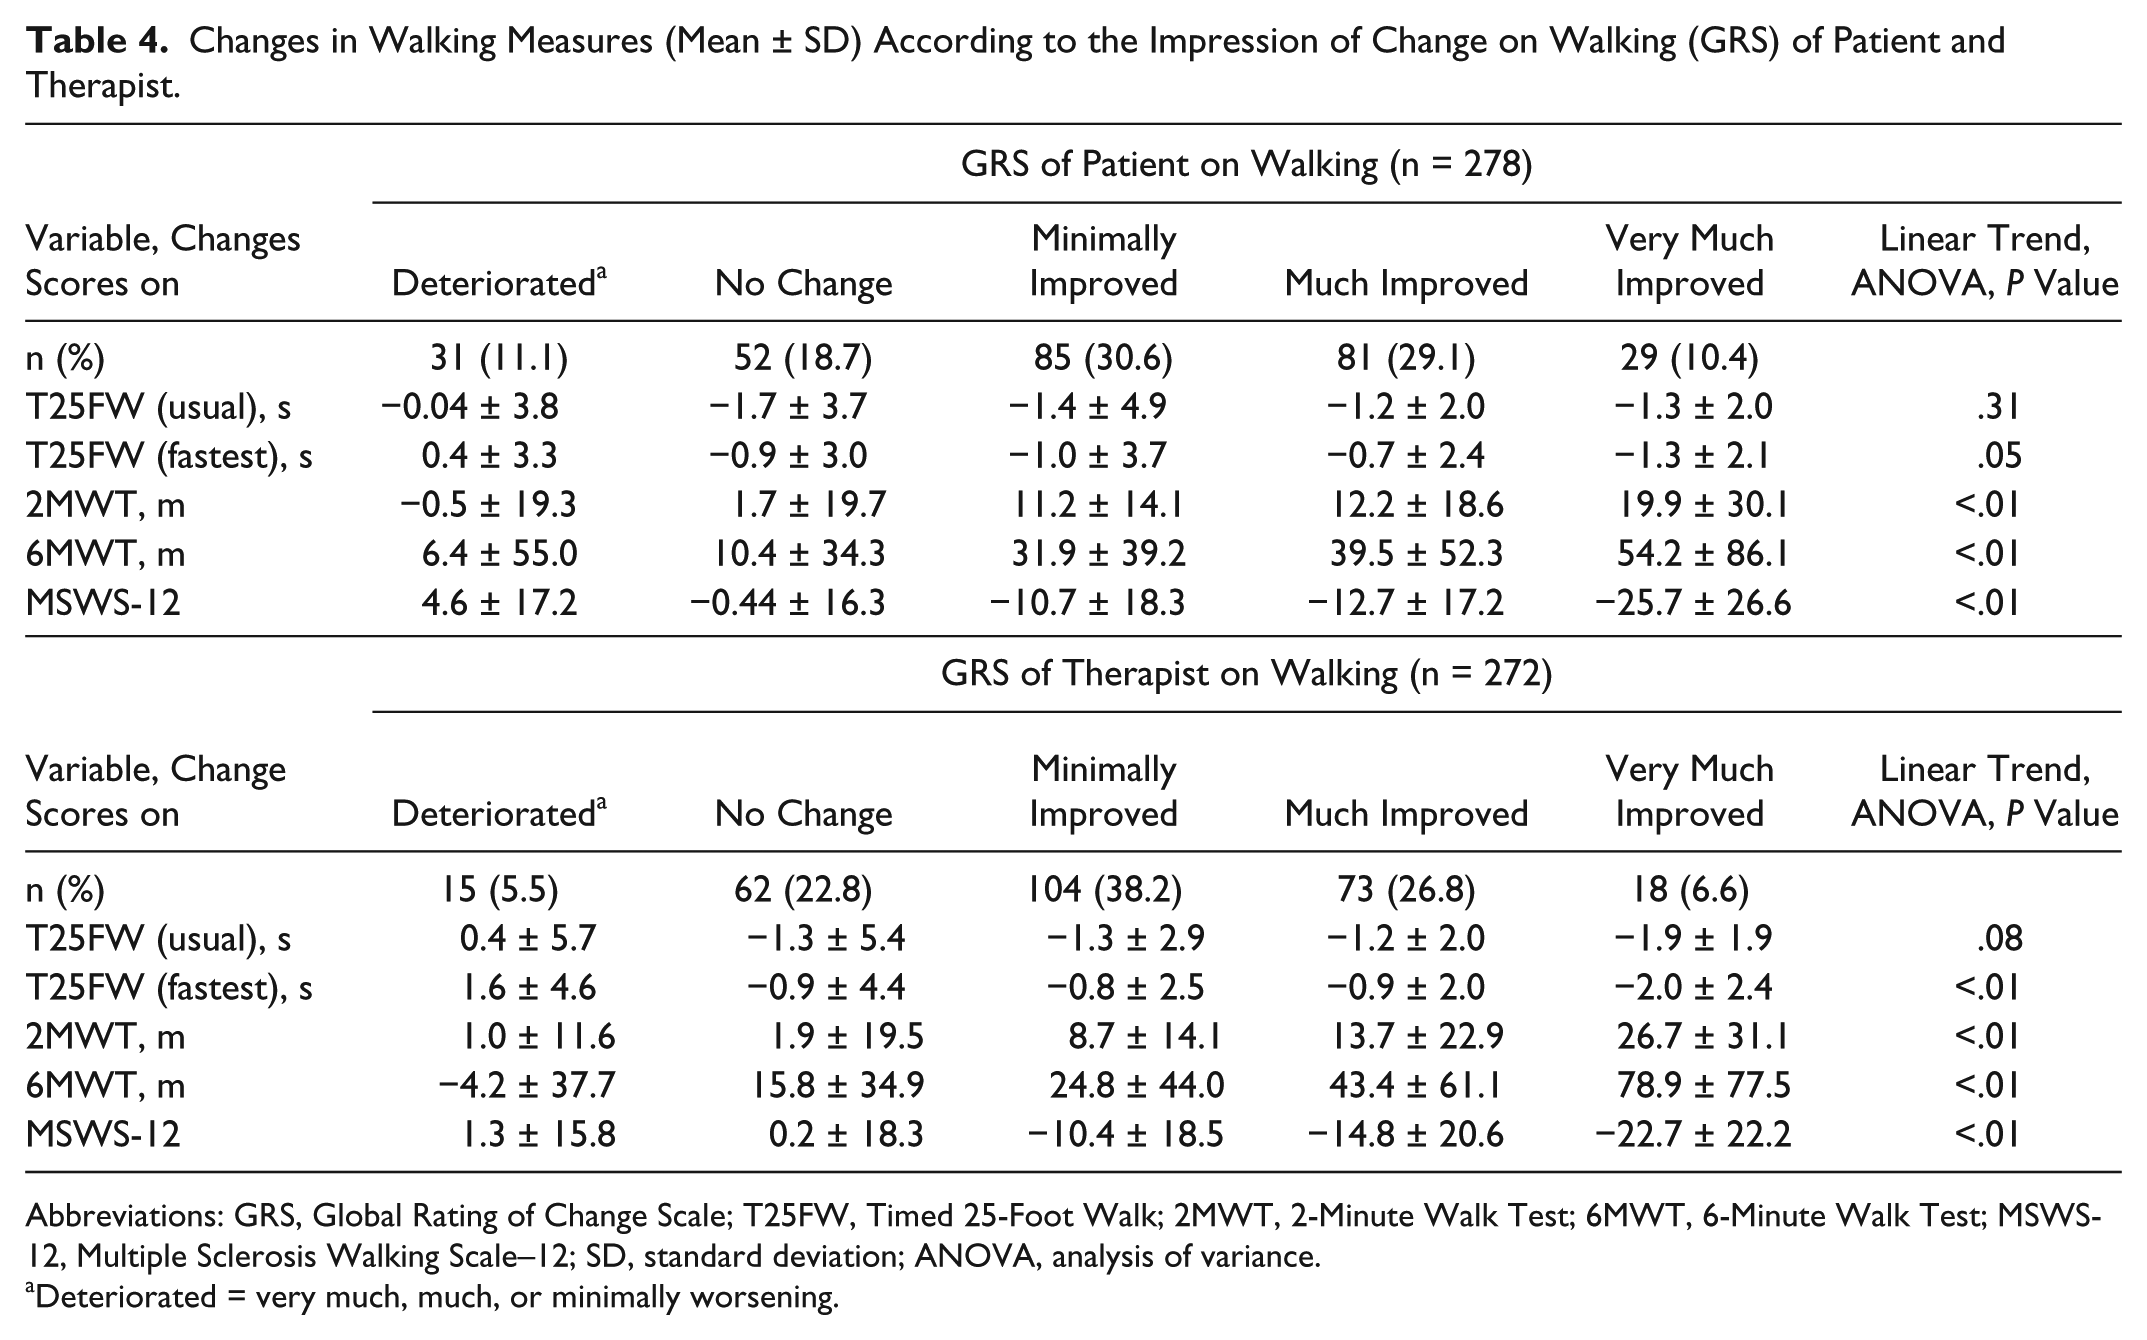
Abbreviations: GRS, Global Rating of Change Scale; T25FW, Timed 25-Foot Walk; 2MWT, 2-Minute Walk Test; 6MWT, 6-Minute Walk Test; MSWS-12, Multiple Sclerosis Walking Scale–12; SD, standard deviation; ANOVA, analysis of variance.
Deteriorated = very much, much, or minimally worsening.
Change scores of the 5 walking measures, according to GRS stratification, are presented in Table 4. The large standard deviations highlight the variability of change scores on walking measures for the same subjective impression of change from patients/therapists. Linear trend analyses revealed that change scores of T25FW at fast speed, 2MWT, 6MWT, and MSWS-12 show a significant linear decrease/increase, but neither the therapist (P = .08) nor patient (P = .31) perspective showed a linear decrease for the T25FW at usual speed.
Comparison of Responsiveness
Tables 5 and 6 show the AUCs, MICs, and SRCs for improvement in walking using the patient and therapist perspective, respectively, as the external criteria. For the whole group, AUCs ranged from 0.50 to 0.73 (patient perspective) and from 0.59 to 0.70 (therapist perspective). Highest AUC values were found for the MSWS-12, 2MWT, and 6MWT, followed by T25FW at fast speed and T25FW at usual speed, this from both perspectives.
Combined Anchor- and Distribution-Based Responsiveness (AUC, MIC, SRC) for Improvement on Walking Using the Patient Perspective as External Criterion. a
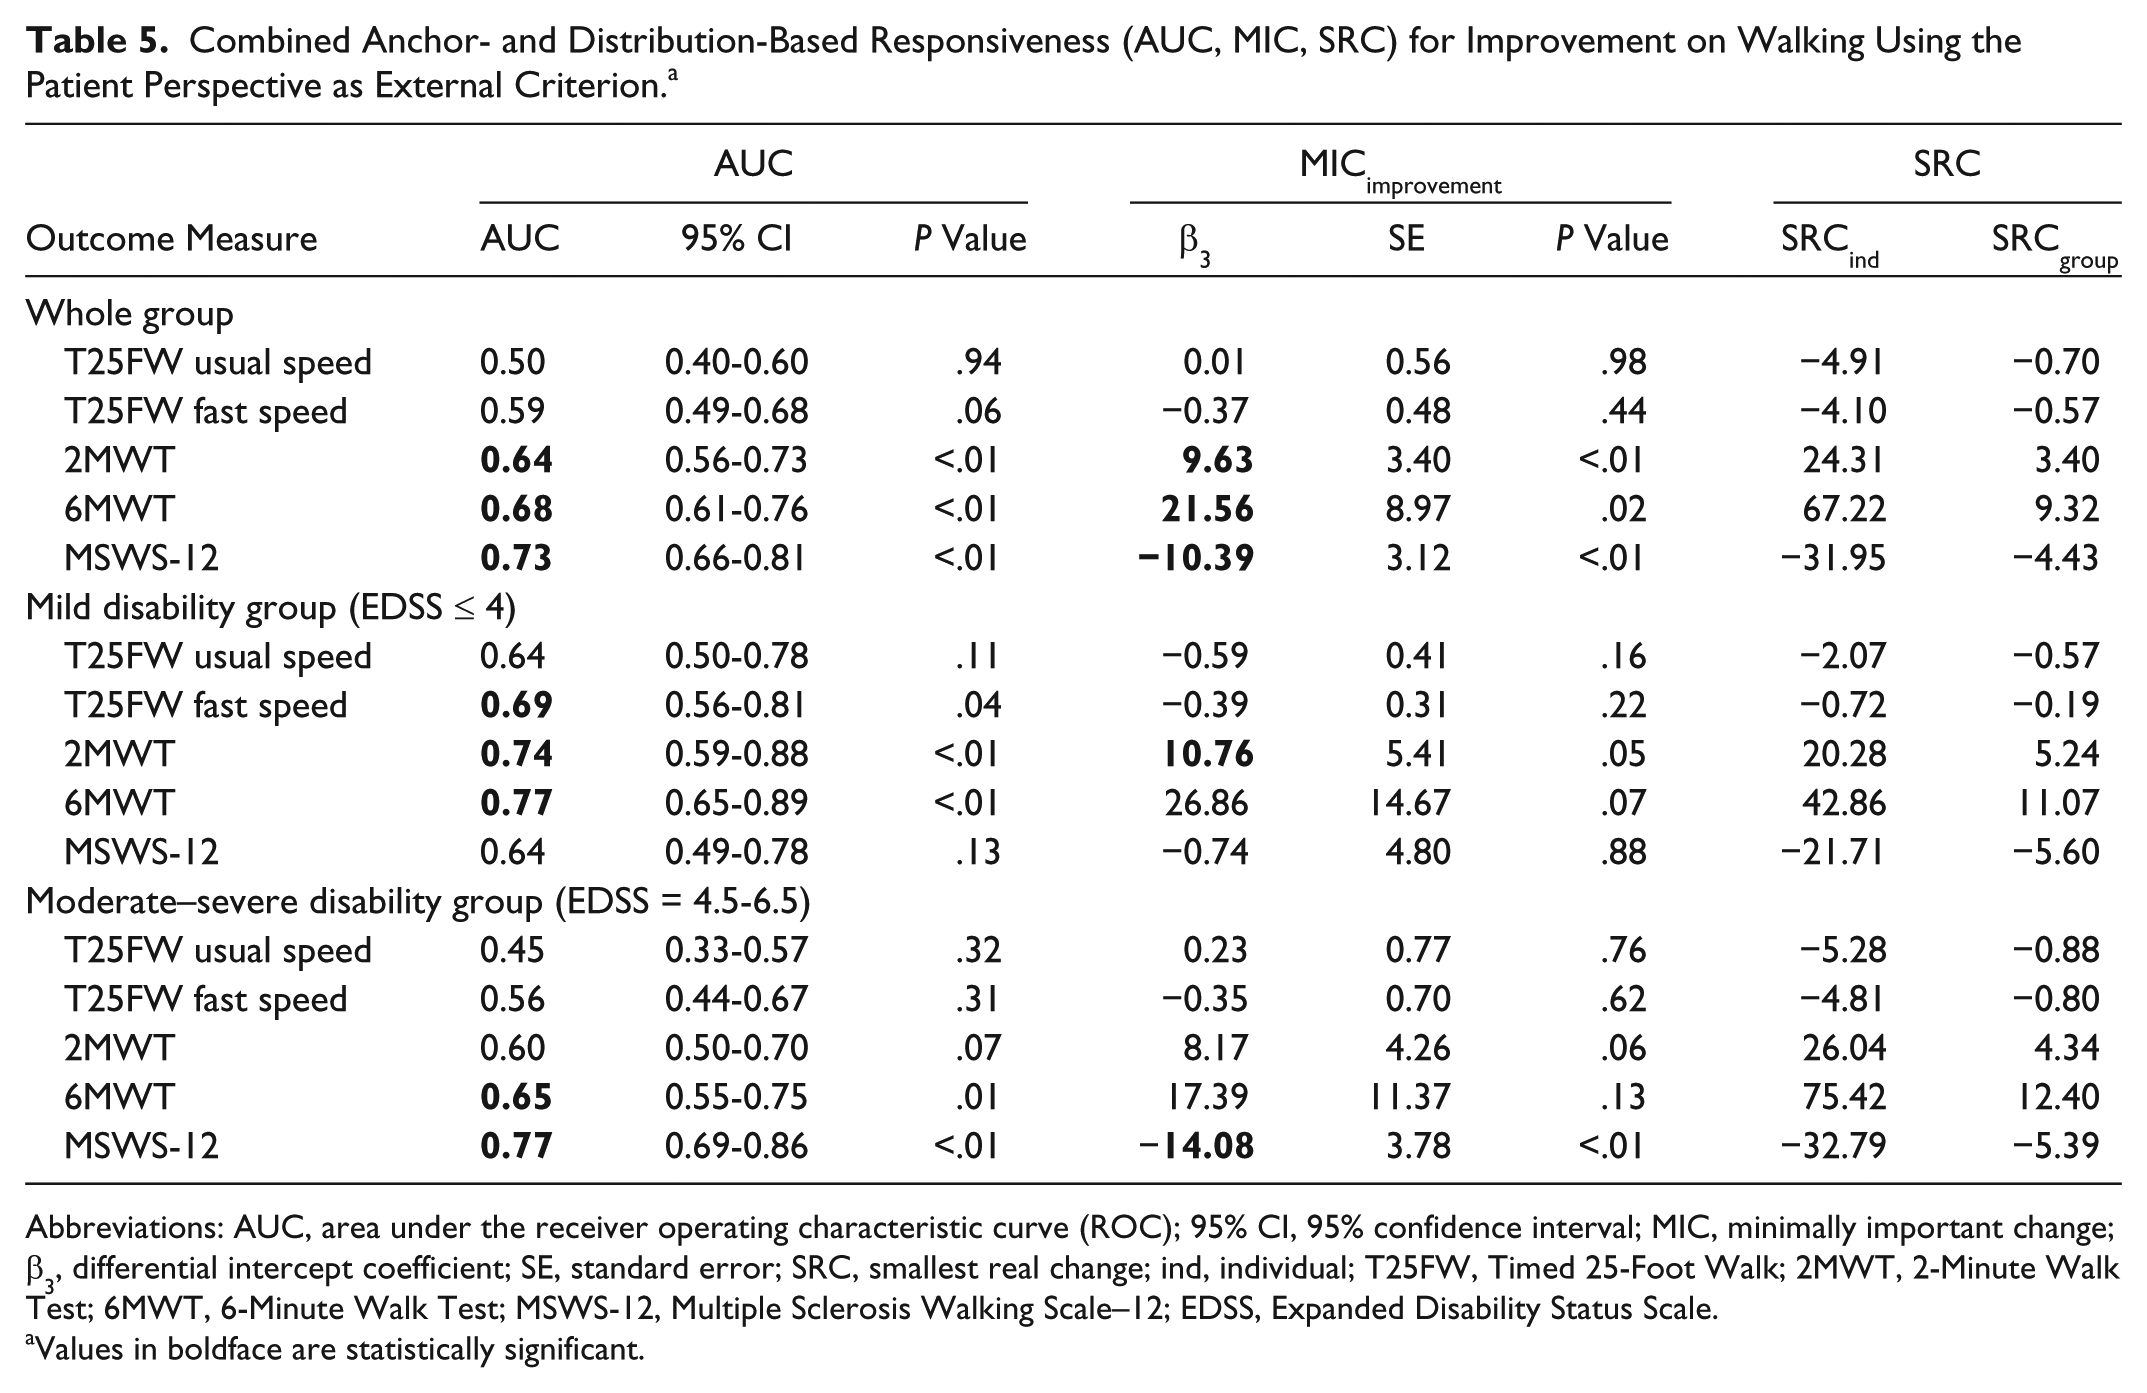
Abbreviations: AUC, area under the receiver operating characteristic curve (ROC); 95% CI, 95% confidence interval; MIC, minimally important change; β3, differential intercept coefficient; SE, standard error; SRC, smallest real change; ind, individual; T25FW, Timed 25-Foot Walk; 2MWT, 2-Minute Walk Test; 6MWT, 6-Minute Walk Test; MSWS-12, Multiple Sclerosis Walking Scale–12; EDSS, Expanded Disability Status Scale.
Values in boldface are statistically significant.
Combined Anchor- and Distribution-Based Responsiveness (AUC, MIC, SRC) for Improvement on Walking Using the Therapist Perspective as External Criterion. a
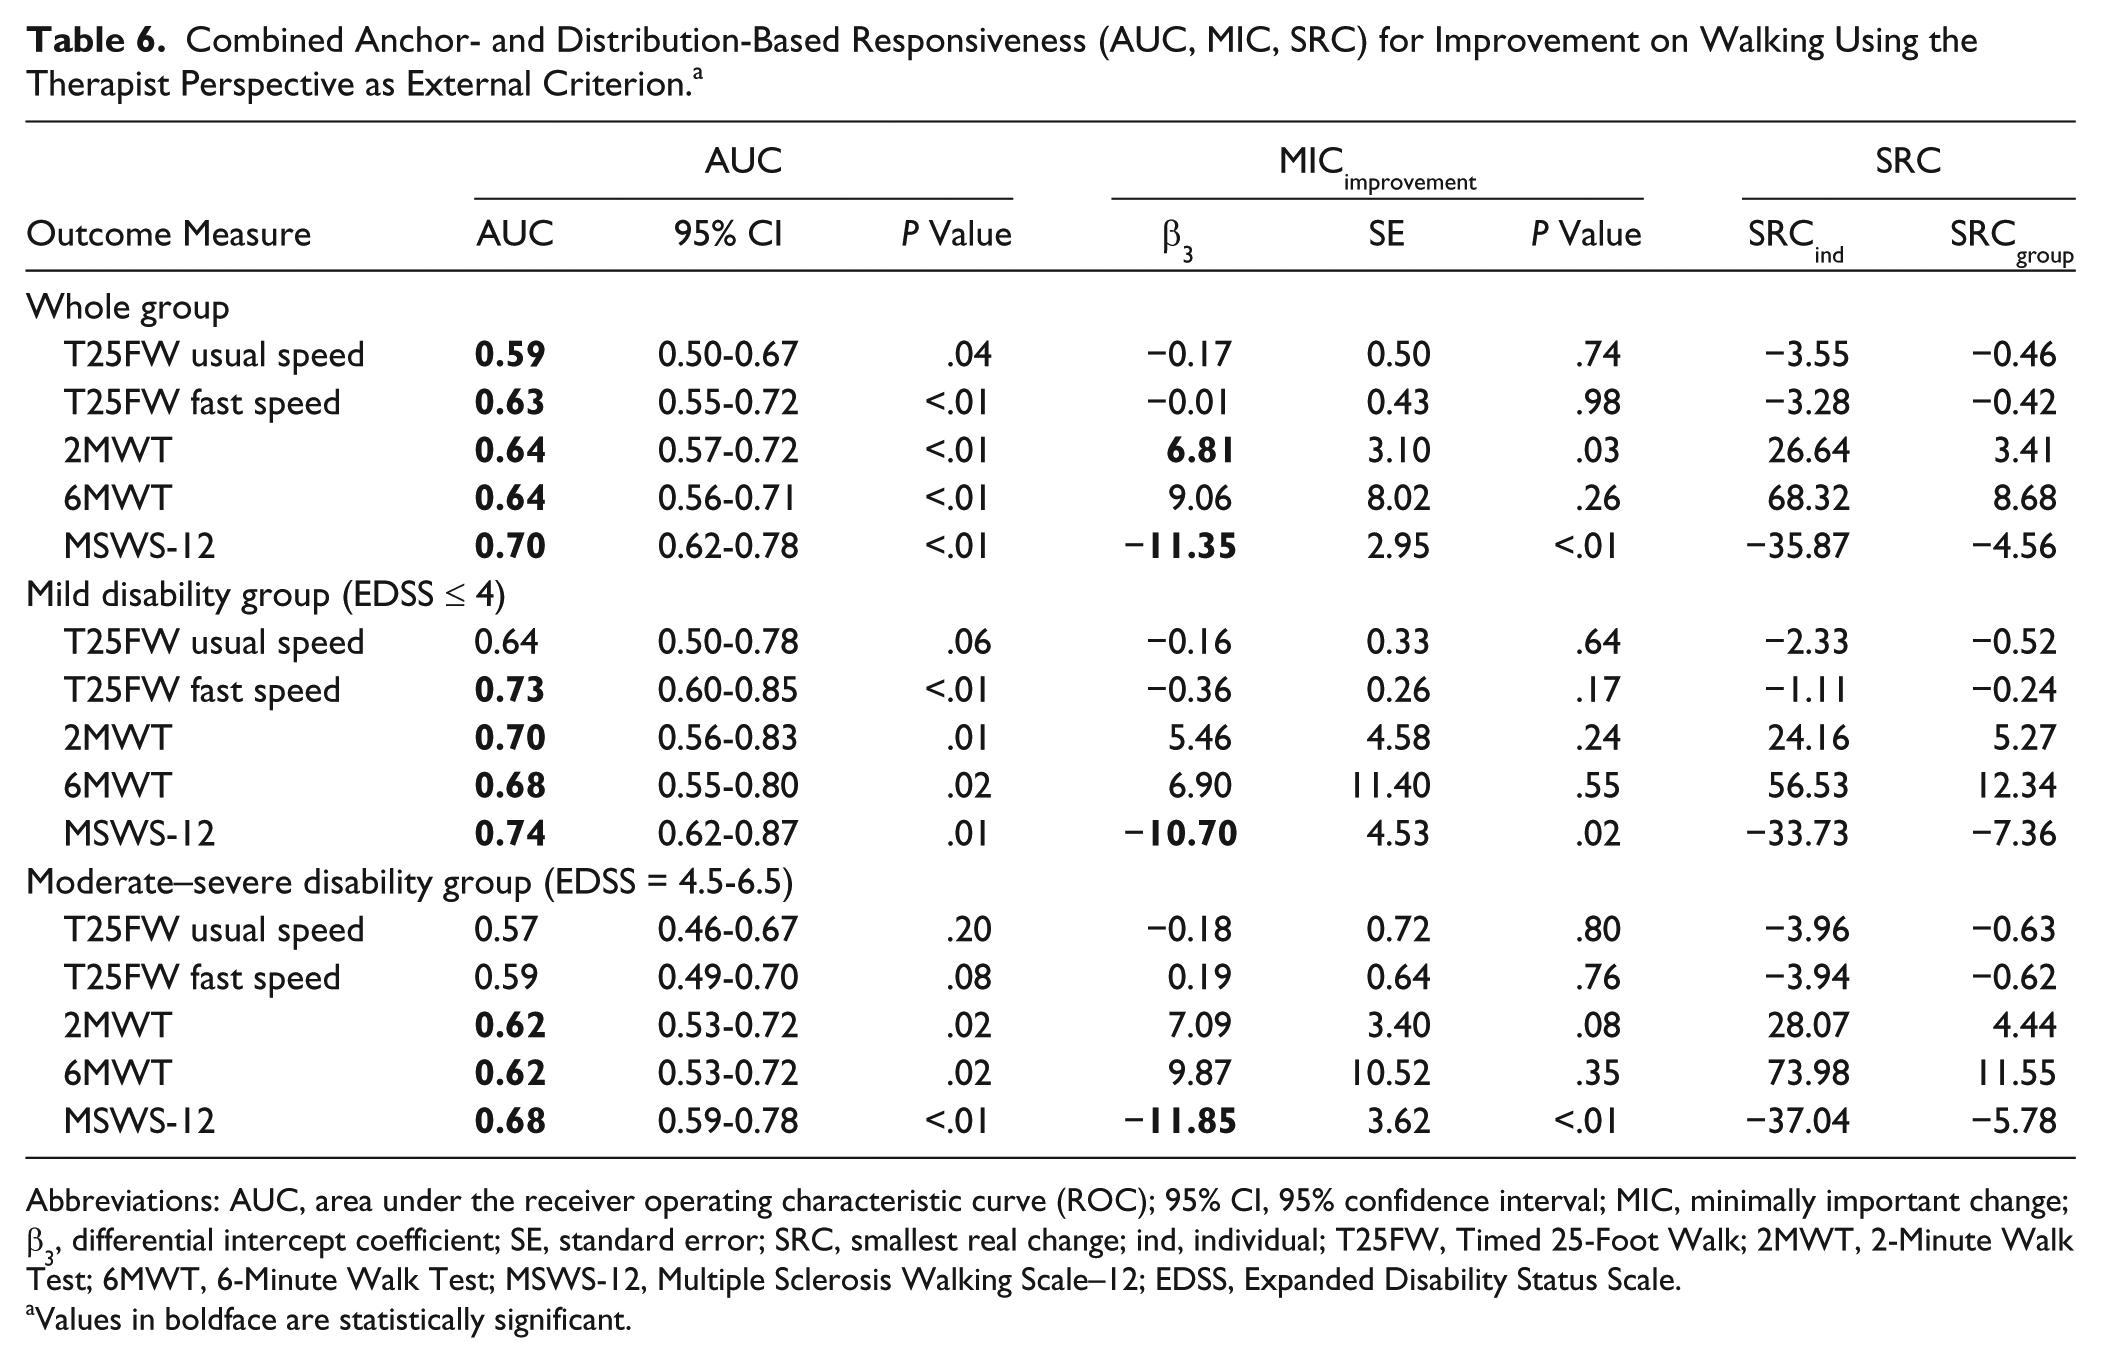
Abbreviations: AUC, area under the receiver operating characteristic curve (ROC); 95% CI, 95% confidence interval; MIC, minimally important change; β3, differential intercept coefficient; SE, standard error; SRC, smallest real change; ind, individual; T25FW, Timed 25-Foot Walk; 2MWT, 2-Minute Walk Test; 6MWT, 6-Minute Walk Test; MSWS-12, Multiple Sclerosis Walking Scale–12; EDSS, Expanded Disability Status Scale.
Values in boldface are statistically significant.
Reference Values of Clinically Meaningful Improvement
From the patient and therapist perspective, respectively, the MICimprovement values were −10.4 and −11.4 for the MSWS-12 (P < .01), 9.6 m and 6.8 m for the 2MWT (P < .05), and 21.6 m (P < .05) and 9.1 m (P = .3) for the 6MWT. None of the outcome measures have a |MIC| > |SRCind|, making them statistically unsuitable for detecting important changes in individuals. However, MICimprovement is greater than SRCgroup for 2MWT, 6MWT, and MSWS-12, making them suitable to compare treatment effects at a group level.
Responsiveness and Reference Values According to Disability Level
The “mild” disability subgroup demonstrated the highest AUC from the patient perspective in the 6MWT and 2MWT, followed by T25FW at fast speed, T25FW at usual speed, and MSWS-12. From the therapist perspective, the highest AUC values for this subgroup were found for MSWS-12 and T25FW at fast speed followed by the 2MWT, 6MWT, and T25FW at usual speed. A significant MICimprovement was found for the 2MWT (10.8 m) from the patient perspective and for the MSWS-12 (−10.7) from the therapist perspective. None of the outcome measures had a |MIC| > |SRCind|, but >|SRCgroup| for the T25FW at fast speed and 2MWT from both perspectives, and for T25FW at usual speed and 6MWT from the patient perspective, and for the MSWS-12 from the therapist perspective.
In the “moderate–severe” disability subgroup, the highest AUCs from both the patient and therapist perspectives were for the MSWS-12, 2MWT, and 6MWT, followed by T25FW at fast speed and T25FW at usual speed. On the MSWS-12, a significant MICimprovement was revealed by patients (−14.1) and therapists (−11.9). MICimprovement was always smaller than |SRCind|, but >|SRCgroup| for the 2MWT and MSWS-12 from both perspectives, and for the 6MWT from the patient perspective.
Discussion
This study aimed to determine the most appropriate walking measures for evaluating effect of physical rehabilitation interventions in pwMS by comparing the responsiveness of several commonly used walking measures and providing reference values of clinically meaningful improvement from both the patient and therapist perspective, taking different disability levels into account.
Which Walking Measure Is the Most Appropriate in Detecting Improvement?
By comparing responsiveness of the 5 measures, we found that for the whole group, MSWS-12, 2MWT, and 6MWT appeared to better detect change scores than the T25FW, as revealed by higher AUC values. Furthermore, MICimprovement values were significant for long walking tests and MSWS-12, but not for short walking tests. The nonsignificant MIC values of the T25FW at both usual and fast speed means that MIC values of these walking measures cannot be accurately estimated in this study sample. Overall, findings were similar regardless as to whether the patient or therapist perspective was used as the anchor for impression of change. Short tests can be prone to a floor effect, 28 rendering them less responsive in detecting changes among patients with minimal walking disability. Results of a previous multicenter study on within-day variability of walking capacity measures also revealed greater variability of short walking tests (10MWT, usual and fastest speed) compared with long walking tests (2MWT, 6MWT). 15
In the “mild” disability subgroup, AUCs of patient and therapist perspectives were contradictory. Superiority of responsiveness of walking measures varied as to whether the patient or therapist perspective was used as the anchor for impression of change. Significant MICimprovement (>SRC) were found for the 2MWT from patient perspective and for the MSWS-12 from therapist perspective. These results indicate that the MSWS-12 and long walking capacity tests may be more appropriate than short walking tests for detecting change in mildly disabled pwMS.
In the “moderate–severe” disability subgroup, the MSWS-12 and long walking tests demonstrated superior responsiveness compared with the short walking tests (higher AUCs) from both patient and therapist perspective. The MICimprovement significantly exceeded measurement error for the MSWS-12 for both perspectives. These results suggest the MSWS-12 may be the most appropriate evaluative walking measure for detecting change in moderate to severely disabled pwMS undergoing physical rehabilitation.
In addition, walking measures were more responsive in mildly disabled persons than in moderate to severely disabled pwMS (higher AUC).
Reference Values of Clinically Meaningful Improvement and Real Change
To our knowledge, this is the first study providing reference values for clinically meaningful change in walking measures associated with improved function among pwMS. Previous studies6,9 have reported AUC and MIC for deterioration of the 10MWT and 6MWT after a 2- to 3-year follow-up period. In line with our findings, Paltamaa et al 9 also found higher AUC values for the 6MWT (0.76) compared with the 10MWT (0.62-0.76). These previous studies reported higher AUC and MIC (absolute) values for 10MWT and 6MWT; however, it can be questioned whether it is appropriate to compare MIC values of improvement with values of deterioration. Moreover, one must be aware of the different anchors and timeframes applied in these studies. A minimal clinically important difference after rehabilitation of 25-m improvement was found for the 6MWT in patients with coronary artery disease 29 and chronic obstructive pulmonary disease 30 based on patients’ impression of change, which correspond to our result of 22 m.
In addition to anchor-based information, the present study provides detailed information on distribution-based responsiveness. The SRC values of T25FW at fast speed were slightly higher than those of the 10MWT (fast speed) in the study by de Groot et al. 6 It is recognized, however, that direct comparison with studies is often difficult because of differences in study design, calculation method, sample size, and anchor.
Implications for Research and Practice
Simultaneous assessment of several walking measures allows direct comparison of responsiveness of these measures. This enables clinicians and researchers to make evidence-based choices regarding their selection of walking measures. Our results suggest that long walking capacity tests and the patient-reported MSWS-12 may be the most sensitive measures in detecting improvements in walking after physical rehabilitation. Provision of reference values for clinically meaningful improvement and real change after physical rehabilitation, established in this study, may also guide clinicians and researchers in interpreting if change in walking capacity/ability exceeds measurement error (SRC values) and whether this change is meaningful (MIC values). For example, when evaluating treatment effects in mildly disabled pwMS, a change beyond 5 m on the 2MWT is unlikely to be caused by measurement error; and is likely to be clinically meaningful if the improvement exceeds 11 m. These reference values can be used to assist clinical decision making and to interpret the results of studies reporting treatment efficacy. For example, in the study by Smedal et al, 31 mean walking distance on the 6MWT increased by 70 m for pwMS in Spain and by 49 m for pwMS in Norway after physiotherapy. Because this improvement exceeds the MIC of 22 m demonstrated in our study, it implies that physiotherapy led to a meaningful change on the 6MWT, in both locations.
Methodological Considerations
Overall, physical rehabilitation led to a significantly better walking capacity and patient-reported walking ability in both disability subgroups; this finding was supported by the large proportion of patients and therapists who reported a impression of improvement. This lends support to the conclusion of previous studies on the beneficial effects of physiotherapy 32 and exercise therapy33,34 on walking. The fact that the patients improved after physical rehabilitation supports the validity of the results examining responsiveness of the walking measures within this context.
The agreement between the patient and therapist perception in classifying the participants corresponding GRS was moderate 35 (κw = 0.46). The number of therapists responding “no change” and “minimally improved” on the GRS question was slightly higher than the number of patients responding to these categories (Table 4). For the other categories this was vice versa. However, overall similar results of responsiveness indexes (Tables 5 and 6) were found for both the external criteria, increasing our confidence in the results.
The use of GRS as external criteria, in contrast to a clinician-based measure such as the EDSS, may be considered problematic as this is subject to recall bias. Nonetheless, it has been used in previous studies investigating responsiveness.6,9,11 In the present study, changes in the EDSS were, however, not expected over the 3- to 12-week study period, a time frame clearly shorter than the 2- to 3-year time span in the longitudinal studies that have measured clinically meaningful deterioration.6,9 Of note, change scores in the T25FW at fast speed, 2MWT, 6MWT, and MSWS-12 showed a significant linear decrease/increase and a tendency to linear decrease for the T25FW at usual speed, according to the stratification of GRS (Table 4), suggesting that the estimation of change by patients/therapists was appropriate. Moreover, correlations between the GRS and change scores of walking measures was greater than 0.30 36 for the MSWS-12 (patients’ GRS) and 2MWT, 6MWT, and MSWS-12 (therapists’ GRS, data not shown). This indicates that the anchor is useful to establish responsiveness and minimally important change.
The category “minimally improved” was used to determine the cutoff point of the GRS for the calculation of MICimprovement. In our opinion, the next category “much improved” is, at least semantically, less appropriate to determine the minimally important change. The change scores of walking measures improved proportionally across GRS categories (Table 4), indicating the estimation of change by patients/therapists was appropriate, thereby providing support for our decision to choose this cutoff point on the GRS.
Because of skewness of the scores of the T25FW postintervention, the results of the linear regression calculating MIC scores for the T25FW should be interpreted with caution. However, the distribution of residuals was symmetrical. Moreover, the mainly high nonsignificant AUC values of the T25FW justify our assertion that long walking capacity tests are better outcome measures to evaluate walking improvement compared with short tests. Nonetheless, further research concerning responsiveness of walking measures in pwMS is needed.
Conclusion
The present study showed that long walking tests (2MWT and 6MWT) and patient-reported measure of walking ability (MSWS-12) were superior to short walking tests (T25FW at either usual or fast speed) in detecting improvement after physical rehabilitation, and particularly the MSWS-12 for moderate to severely disabled pwMS. Reference values for clinically meaningful improvement on the T25FW (at both speeds) could not be accurately estimated in this sample in contrast to the 2MWT, 6MWT, and MSWS-12. Values were also significant in subgroups: the 2MWT (patient perspective) and MSWS-12 (therapist perspective) in mildly disabled pwMS and the MSWS-12 (both perspectives) in moderate to severely disabled pwMS. Results of the current study seem valuable for interpreting research findings and when evaluating walking performance in clinical practice.
Footnotes
Acknowledgements
Coordination of this study was partially funded via a unrestricted educational grant from Novartis Pharma AG to the European RIMS network which is acknowledged for facilitating inter-European consultation and testing. The staff of each participating site is thanked for their cooperation. Thanks to Dr H. Thijs (CENSTAT, Hasselt University) and B. Bibby (Department of Biostatistics, Aarhus University) for statistical advice. We gratefully thank all the participating persons with multiple sclerosis, and acknowledge the contribution of Domien Gijbels in study preparation.
Declaration of Conflicting Interests
The author(s) declared no potential conflicts of interest with respect to the research, authorship, and/or publication of this article.
Funding
The author(s) disclosed receipt of the following financial support for the research, authorship, and/or publication of this article: This study was partially funded via a unrestricted educational grant from Novartis Pharma AG to RIMS.