
Abstract
Background. Motor rehabilitation after cerebral ischemia can enhance motor performance and induce motor map reorganization. Electrical stimulation of the cortex (CS) during rehabilitative training (CS/RT) augments motor map plasticity and confers gains in motor function beyond those observed with motor rehabilitation alone. However, it is unclear how the distribution of electrical stimulation across the cortex accomplishes these changes. This study examined the behavioral and neurophysiological effects of delivering CS/RT through a distributed versus focal arrangement of electrical contacts. Methods. Adult male rats were given rehabilitative training on a skilled forelimb reaching task following induction of focal ischemic damage within motor cortex. Intracortical microstimulation was used to derive high-resolution maps of forelimb movement representations within motor cortex contralateral to the trained/impaired paw before and after rehabilitation. Results. All animals that received rehabilitation showed greater increases in motor map area and reaching accuracy than animals that received no training. Animals with the distributed configuration performed significantly greater reaching accuracy than animals in both the CS/RT with focused contact arrangement and rehabilitative training alone (RT) conditions on days 3 to 4 and on day 6 through the remainder of the study (P < .05). However, both CS/RT groups exhibited larger motor maps than the RT condition (E1-CS/RT, 4.71 ± 0.66 mm2; E2-CS/RT, 4.64 ± 0.46 mm2; RT, 2.99 ± 0.28 mm2). Conclusion. The results indicate that although both focal and distributed forms of CS/RT promote motor map reorganization only the distributed form of CS/RT enhances motor performance with rehabilitation.
Introduction
Rehabilitation-dependent improvements in motor function after stroke are associated with functional restoration and/or compensation within residual motor brain regions. 1-3 Animal studies show that focal ischemic damage to motor cortex results in a loss of microstimulation-evoked movement representations and a weakening of synaptic connectivity within residual cortical areas that can be restored with motor rehabilitation. 4-11 Thus, adjuvant therapies that promote synaptic plasticity and motor map reorganization may enhance improvements in motor performance after stroke. 12
Early clinical studies of epidural electrical stimulation, intended to reduce chronic pain after subcortical strokes, showed some efficacy in overcoming hemiparesis, 13 hemiplegia, 14 spasticity, 15 action tremor, 16 and dystonia. 17 Subsequent animal models of cortical stimulation during rehabilitation therapy (CS/RT) after stroke have demonstrated enhanced motor improvements relative to rehabilitative training alone. 18,19 The improved motor performance with CS/RT is also associated with motor map expansion in rodents 20 and primates 21 that is accompanied by increased synapse density 22 and enhanced synaptic potentials. 23 Although these preclinical results suggest the viability of CS/RT for enhancing motor improvement after stroke in human patient populations, results from a phase III clinical trial of CS/RT failed to show any significant effects. 24 One key difference between the preclinical and clinical studies of CS/RT is the distribution of stimulation across the cortex. Clinically, CS/RT is delivered to a focal region of motor cortex defined by functional magnetic resonance imaging (fMRI) activation during hand/wrist/finger movement, whereas animal studies have used more distributed arrangements of stimulation that include representations of face and proximal forelimb movements. 24 Given the profound CS/RT-induced expansion of distal forelimb representations into nondistal representations observed in animal models of stroke, the differences in the spatial distribution of stimulation between the clinical and animal studies may in part account for the failure to show clinical efficacy. To test this hypothesis, we examined the effects of focal versus distributed cortical stimulation on both motor performance and motor map plasticity in a rodent model of stroke.
Methods
Subjects
A total of 45 adult male Long-Evans hooded rats (350-420 g) were singly housed on a 12:12 hour light–dark cycle throughout the experiment in the University of Florida’s Communicore Research Building vivarium. All experimentation was conducted during the light cycle. Rats were maintained on Lab Diet 5001 (PMI Feeds, St. Louis, MO) and water ad libitum, and were handled and cared for in accordance with the National Institutes of Health’s Guide for the Care and Use of Laboratory Animals and with the approval of the University of Florida’s Institutional Animal Care and Use Committee (IACUC).
Reach Training
All animals were initially placed on a restricted diet (90% original body weight) before pretraining in test cages (10 × 18 × 10 cm) with front walls constructed of 2-mm bars, 9 mm apart edge to edge. A 4-cm wide and 5-cm deep tray filled with food pellets (45 mg; Bioserv) was mounted on the front of each cage. Rats were trained until they had successfully retrieved 10 pellets in one session (approximately 1 h/day for 2 days). After pretraining, all rats were trained to criterion with a single pellet reaching task (approximately 2 weeks). 25 A successful reach was scored when the animal grasped the food pellet, and brought it into the cage and to its mouth without dropping the pellet. Each session was videotaped and later used to assess reaching performance where both the percentage of successful reaches [(number of successful retrievals/the total number of reaches) × 100] and the number of reach attempts were calculated. Animals were sorted by their prelesion reaching performance to create 5 groups with comparable baseline levels of reaching accuracy: nontrained (NT; n = 11), E1 configuration cortical stimulation with rehabilitative training (E1-CS/RT; n = 10), E2 configuration cortical stimulation with rehabilitative training (E2-CS/RT; n = 9), E3 configuration cortical stimulation with rehabilitative training (E3-CS/RT; n = 7), and rehabilitative training alone (RT; n = 8).
Electrophysiological Mapping
Within 2 days of baseline training, standard intracortical microstimulation (ICMS) techniques were used to generate detailed maps of forelimb regions of the motor cortex contralateral to the trained forelimb. 26,27 Prior to surgery animals were anesthetized with ketamine hydrochloride (70 mg/kg intraperitoneally [i.p.]) and xylazine (5 mg/kg i.p.). Animals received supplemental doses of ketamine (20 mg/kg i.p.) and xylazine (0.02 mg/kg i.p.]) as needed. Under sterile conditions, a craniotomy was performed over the motor cortex contralateral to the trained paw of each animal. To prevent edema, a small puncture was made in the cisterna magna prior to removing the skull and dura. The exposed cortex was then covered in a mixture of silicone fluid (50%) and silicone oil (50%) (Factor II, Lakeside, Arizona) (37°C). A digital image of the cortical surface was taken and a 500-µm grid was superimposed onto the image. A glass microelectrode (controlled by a hydraulic microdrive) was used to make systematic penetrations across the cortex using the cortical surface image and grid as a guide. At each penetration site, the electrode was lowered to approximately 1550 µm (corresponding to cortical layer V). Stimulation consisted of thirteen 200-µs cathodal pulses delivered at 350 Hz from an electrically isolated stimulation circuit. Animals were maintained in a prone position with the limb consistently supported. Sites where no movement was detected at ≤60 µA were recorded as unresponsive. Forelimb movements were classified as either distal (wrist/digit) or proximal (elbow/shoulder) and representational maps were generated from the pattern of electrode penetrations. The caudal forelimb area (CFA) was defined by a medial boundary of vibrissa representations, a lateral and caudal boundary of nonresponsive sites and a rostral boundary of head and neck representations. 26-28 An image analysis program (CANVAS v. 3.5) was used to calculate the areal extent of the CFA. Briefly, each map was imported into CANVAS and calibrated to magnification. Individual areas were traced using the marquis tool to produce a measure of area (mm2).
Infarction
Following ICMS, focal ischemic infarcts were created within the CFA (primarily targeting the distal forelimb representations) of motor cortex via bipolar electrocauterization of the surface vasculature (Figure 1B). 9,20 The cauterized vessels included fine arterial and venous capillaries as well as larger vessels but specifically avoided any bypassing arteries supplying other cortical areas. Cauterization was continued until all vessels within the targeted area were no longer visible and the tissue appeared white.
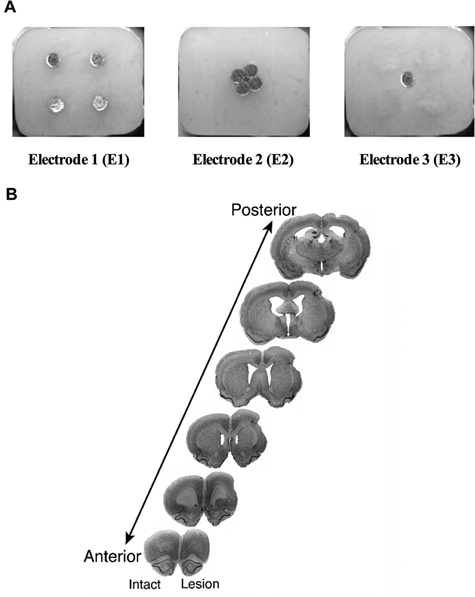
Representative images of the cortical stimulation and rehabilitation training (CS/RT) stimulating electrodes and the lesion location.
Cortical Electrode Implantation
After infarction animals were implanted with electrode arrays. Each 9-pin electrode carriage (Plastics One Inc., Roanoke, VA) was inserted into the cranial window over the entire exposed cortex including the devascularized region and remaining forelimb representation area of motor cortex. The metal contacts were placed in a consistent manner relative to skull landmarks and were orientated approximately parallel to midline. This electrode placement has been found to reliably enable postoperative stimulation-evoked contralesional forelimb, face, and/or upper body movement. 19,22 A return lead was fixed to the skull in a position posterior to Lambda (the point of intersection of the sagittal and lambdoid sutures; located approximately 0.3 ± 0.3 mm anterior to the interaural line). 29 Four skull screws were placed in a 4 mm × 4 mm square surrounding the cranial window to create additional bonding surface for PolyWave dental acrylic and dental cement that was then applied to the skull and screws. 19,22 Following the implantation the animals were given 4 ml3 of warm Ringer’s solution (subcutaneous [s.c.]) and metacam (0.10 mg/kg, s.c.). The electrode contacts were all 0.60 mm in diameter and placed in 1 of 3 configurations. E1 electrodes had 4 contacts positioned 2 mm distributed from one another in an equidistant manner. E2 electrodes had the same 4 contacts but clustered in the center of the pedestal and E3 electrodes had a single contact in the center (Figure 1A).
Determining Motor Thresholds
After surgery all rodents were returned to their home cage to recover for 10 days to allow for comparison with prior animal CS/RT studies. 18,19,22 Food restriction was reinstated on day 10. Motor thresholds 19,20 were determined the following day, when motor rehabilitation was initiated, and again on days 5 and 12. Cortical stimulation was administered with a preclinical stimulation system (Northstar Neuroscience, Seattle, WA). Current was delivered to the electrode through a remote stimulator linked to a computer-driven base-station (Dell, Roundrock, TX). Stimulation consisted of a 1-second, 50-Hz monopolar cathodal pulse. Motor thresholds were determined while animals moved freely in a transparent polymethyl methacrylate cylinder. Current was gradually increased by 5% increments until an involuntary movement on the contralateral side of the body could be clearly detected. Motor threshold was defined for each animal as the minimum current required to induce an involuntary motor response in 3 of 5 pulses. Animals in the E1 condition (n = 10) showed large-scale movements of the head, neck, forelimb, and hindlimb in response to stimulation. Animals in the E2 condition (n = 9) showed very focal forelimb movements. This finding is consistent with the location of the electrode contacts within the motor maps. No movements could be elicited in the E3 (n = 7) animals at the maximum current (12 mA) output level. As a result, animals in E3 did not receive stimulation and were combined with the rehabilitation alone (RT) animals where they received no stimulation during rehabilitative training.
Cortical Stimulation and Rehabilitation Training
Motor rehabilitation consisted of daily 15-minute training sessions on the skilled reaching task for 12 consecutive days. 19,20 Animals in the cortical stimulation and rehabilitation training (CS/RT) conditions received stimulation during these 15-minute sessions. A probe trial was given at the end of training where all animals performed without stimulation. Monopolar cathodal stimulation was administered continuously with a frequency of 50 Hz and a current intensity of 50% of each animal’s most recent movement threshold. 19,22 Each pulse was biphasic, charged balanced, and asymmetric consisting of a square phase lasting 100 ± 10 µs and a decaying exponential phase lasting ~19 900 ± 10 µs.
Assessing Residual Motor Map Area and Topography
Within 3 days of the final rehabilitation training session, animals were anesthetized, stimulating electrodes removed, and the same ICMS procedures were used to generate a second map of the CFA contralateral to the trained/impaired forelimb. Infarct area was calculated by outlining the cauterized area on the digital image of the cortical surface obtained from the first map. The infracted area was clearly visible as a bleached or whitened area because of the loss of blood flow. Residual CFA prior to rehabilitation was defined as the total area of CFA minus the area of infarct. Residual CFA postrehabilitation was the total area of CFA after rehabilitation. In addition, the percentage of residual CFA that was occupied by distal or by proximal movement representations was calculated both pre- and postrehabilitation.
Results
Reaching Accuracy
A repeated measures analysis of variance (ANOVA) with CONDITION as a between-subject factor and TIME as a within-subject factor revealed a significant CONDITION × TIME interaction, F(26, 38) = 13.092, P < .05, on reaching accuracy (Figure 2A). Subsequent multiple comparisons (Fisher’s protected least significant difference [PLSD]; P < .05) revealed that all conditions had significantly lower reaching accuracies on day 1 of rehabilitation in comparison with prestroke levels. Although all animals receiving rehabilitation showed significant increases in reaching accuracy during the 12 days of training, the E1-CS/RT condition exhibited a significantly greater reaching accuracy than the E2-CS/RT and RT conditions on days 3 to 4 and on day 6 through the remainder of the study. The E2-CS/RT condition had a significantly greater reaching accuracy than the RT condition on days 5 through 8. The RT and E3-CS/RT conditions did not differ on any day. On the probe day, NT control animals showed a significant increase in reaching accuracy in comparison to day 1, T(10) = 5.006, P < .05, but were lower than all other conditions.
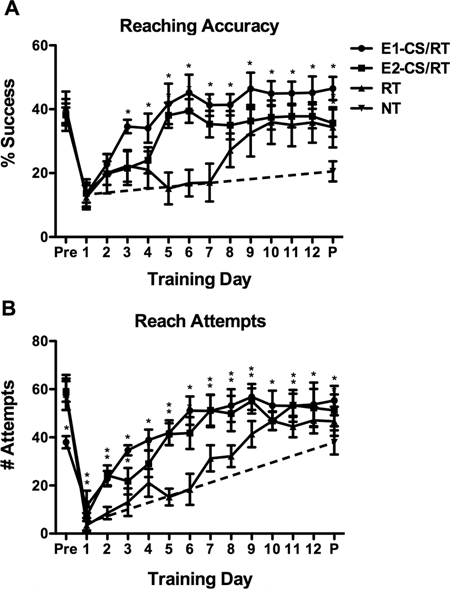
Reaching performance prestroke and during rehabilitation: One probe session (P) was given at the end of training without stimulation.
Reach Attempts
A repeated measures ANOVA with CONDITION as a between-subject factor and TIME as a within-subject factor revealed a significant CONDITION × TIME interaction, F(26, 38) = 14.916, P < .05, on the number of reach attempts (Figure 2B). Subsequent multiple comparisons (Fisher’s PLSD; P < .05) revealed that all conditions had significantly fewer reach attempts on day 1 of rehabilitation in comparison with prestroke levels. E1-CS/RT condition animals showed fewer reach attempts than all other groups on the prelesion assessment. The E1-CS/RT animals performed significantly more reach attempts than animals in the NT group on the first day of rehabilitation (Fisher’s PLSD; P < .05). Although all animals receiving rehabilitation showed significant increases in the number of reach attempts during the 12 days of rehabilitation, the animals in the E1-CS/RT condition exhibited a significantly greater number of reach attempts than the RT group on all days following the lesion. The E2-CS/RT condition exhibited significantly more reach attempts relative to RT controls on days 2 to 9 and on day 11 (Fisher’s PLSD; P < .05). The RT control condition showed a progressive increase in the number of attempts during the first 4 days of training that was followed by a significant decrease in reach attempts on days 5 to 6 (Fisher’s PLSD; P < .05). The RT and E3-CS/RT conditions did not differ in the number of reach attempts during rehabilitation (Fisher’s PLSD; P < .05). All groups given rehabilitation performed a significantly greater number of reach attempts than the NT-control condition in the final probe assessment (Fisher’s PLSD; P < .05).
Motor Thresholds
A repeated measures ANOVA with CONDITION and TIME showed a significant CONDITION × TIME interaction, F(1, 20) = 4.115, P < .05, on mean motor threshold. The mean threshold required to elicit movement was significantly higher in the E1 electrodes at all time points (Fisher’s PLSD; P < .05). Animals in both E1 and E2 conditions showed a progressive decrease in threshold as training continued (Figure 3). An unpaired Student’s t test comparing the total reduction in movement threshold revealed that there was a trend for the E1 condition to show a larger decrease in threshold than the E2 condition, t(17) = 1.933; P = .07.
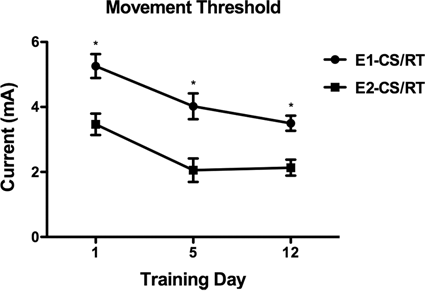
Mean (±SD) movement thresholds for animals in the E1 and E2 conditions.
Residual Motor Maps
CFA motor maps prior to infarction were 4.36 mm2 (±0.40 mm2) in RT controls, 4.30 mm2 (±0.74 mm2) in E1-CS/RT, 4.14 mm2 (±0.38 mm2) in E2-CS/RT, and 4.25 mm2 (±0.45 mm2) in NT controls. The mean infarction area was 1.08 mm2 (±0.18 mm2) in RT controls, 1.20 mm2 (±0.22 mm2) in E1-CS/RT, 1.12 mm2 (±0.20 mm2) in E2-CS/RT, and 1.10 mm2 (±0.19 mm2) in NT controls.
A one-way ANOVA revealed a significant main effect of CONDITION on the area of residual CFA after rehabilitation, F(3, 41) = 120.170, P < .05. Subsequent multiple comparisons (Fisher’s PLSD; P < .05) of the postrehabilitation motor maps showed that area of residual CFA in all groups given rehabilitation was greater than that of NT controls (Figure 4A). The area of postrehabilitation residual CFA for both groups given CS/RT was greater than that of RT controls (Fisher’s PLSD; P < .05). The RT and E3-CS/RT conditions did not differ in the amount of postrehabilitation residual CFA (Fisher’s PLSD; P < .05). No significant effect of CONDITION on the area of residual proximal representations after rehabilitation was observed, F(3, 41) = 1.402, P = .256 (Figure 4B). There was a significant effect of CONDITION on the area of residual distal representations after rehabilitation, F(3, 41) = 97.243, P < .05, where the amount of residual distal representations for all rehabilitation groups was greater than that of NT Controls (Figure 4C). The amount of residual distal representations for both CS/RT groups was greater than that of the RT controls after rehabilitation (Fisher’s PLSD; P < .05). The RT and E3-CS/RT conditions did not differ in the amount of residual distal representations (Fisher’s PLSD; P < .05). A significant effect of CONDITION on the percentage of CFA occupied by distal representations was observed after rehabilitation, F(3, 41) = 25.732, P < .05, with all rehabilitation conditions exhibiting a significantly greater proportion of distal representations within the CFA compared with NT controls (Figure 5). After rehabilitation, the E1-CS/RT had a significantly greater proportion of residual distal representations than the RT controls (Fisher’s PLSD; P < .05) whereas the E2-CS/RT and E3-CS/RT groups did not differ from the RT condition. Finally, a significant positive correlation was found between the absolute increase in the area of postrehabilitation CFA and the absolute increase in reaching accuracy during rehabilitation (mean final 3 rehabilitation days − mean first 3 rehabilitation days; r = .7838, P < .0001; Figure 6A). A significant positive correlation was also found between the absolute increase in the area of postrehabilitation distal representations and the absolute increase in reaching accuracy during rehabilitation (mean final 3 rehabilitation days − mean first 3 rehabilitation days; r = .7619, P < .0001; Figure 6B).
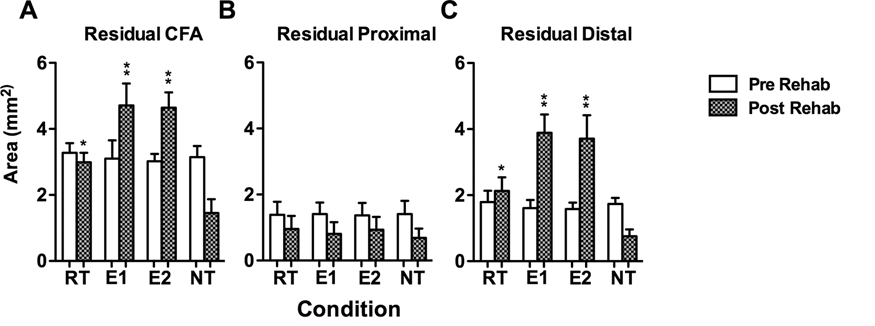
Reorganization of movement representations within motor cortex before and after rehabilitation training.
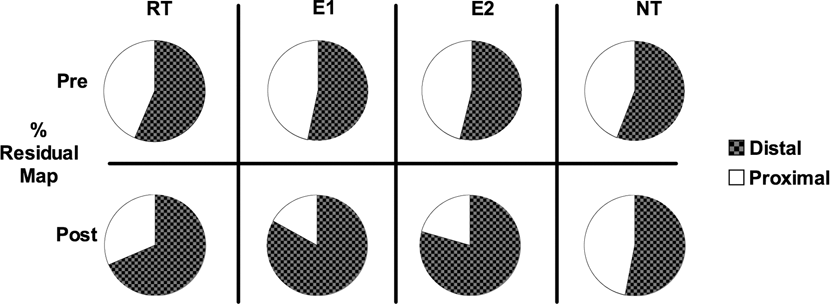
Percentage change in the proportion of distal and proximal movement representations.
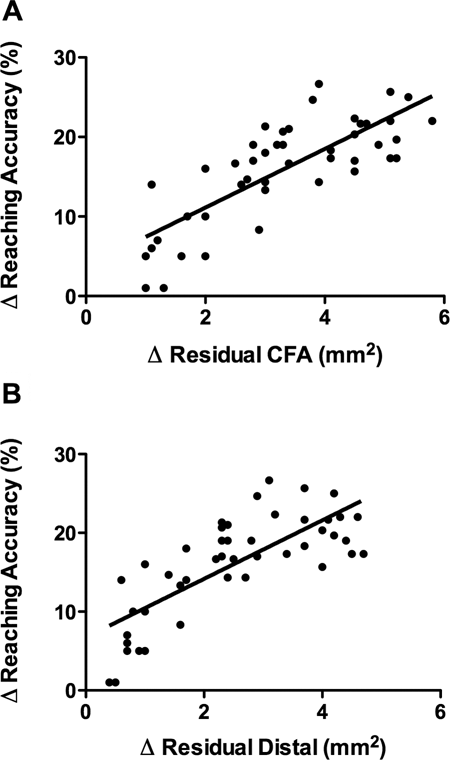
Scatterplots showing the relationship between reorganization of movement representations and motor improvements during rehabilitation.
Discussion
Animal studies have consistently demonstrated the efficacy of various plasticity promoting agents at enhancing rehabilitation-dependent motor improvement after stroke. 30-34 Despite the success of such preclinical studies, these same therapies have not consistently demonstrated clinical efficacy. 35 The failure to translate such therapies may in part reflect differences in the mechanism by which treatments are delivered. Although there is clear evidence that CS/RT both enhances cortical plasticity and augments motor improvement after stroke, no significant effects were observed in a randomized controlled trial. 24 The present study demonstrates in an animal model that the efficacy of CS/RT is dependent on the distribution of stimulation across motor cortex. In this experiment, stimulation specifically in the more peripheral regions of motor cortex supported the enhancement of behavioral improvements during rehabilitation, whereas stimulation within the interior did not. The results have clear implications both for understanding the basic neural mechanisms underlying CS/RT and the translation of the therapy into human stroke patients.
The mechanisms of CS/RT’s enhanced motor recovery are not clearly understood but likely involve enhancing synaptic strength within residual cortical circuits 18-23 similar to that observed in animal studies of the intact motor cortex during motor skill learning. 10,11 The observation that there were expansions in distal representations and total CFA that correlated with the degree of motor improvement suggests that CS/RT induces changes in cortical excitability that may be mediated by increased synaptic strength within the corticospinal system. 22,23,36 There was, however, a dissociation between plasticity and motor improvement in the present study. Animals in both the E1-CS/RT and E2-CS/RT conditions showed increases in CFA in comparison with RT animals. However, only the E1-CS/RT condition exhibited significantly greater motor improvements compared with the RT condition during rehabilitation. This is consistent with previous animal work showing a similar dissociation after electric 20 or pharmacological stimulation where map plasticity appears necessary but not sufficient for enhanced motor recovery. 34 E1-CS/RT animals exhibited significantly higher proportions of distal representations relative to RT animals, whereas the E2-CS/RT animals did not. Thus, more subtle changes in map topography within the overall increase in map size may be more directly related to functional outcome. Focal stimulation may result in overlapping areas of excited cortex limiting the overall volume of tissue being affected. Furthermore, the focal arrangement (E2-CS/RT) was primarily localized to forelimb areas, whereas the distributed arrangement stimulated both forelimb and nonforelimb (whisker, neck, etc) areas as evidenced during measurements of movement thresholds. The distributed stimulation may have further facilitated timing-dependent recruitment of residual cortex into forelimb representations. 37
Prior animal studies 18-23 using dual rail electrodes ranged in contact area from 1.6 mm2 to 6.0 mm2, whereas in the present study the E1 and E2 electrodes had a stimulation contact area of 1.13 mm2. Relative to the focal E2-CS/RT configuration tested here, the present E1-CS/RT’s 2 × 2 array and the dual rail configuration represent distributed configurations of CS/RT, and both are associated with enhanced motor improvements. Both the present 2 × 2 array and the dual rail configuration are also associated with an expansion of movement representations within rat motor cortex. 20 It is possible that the focal CS/RT in the present study lacked behavioral benefit because its stimulation was administered to infarct tissue. In opposition to this, it was noted that the movement thresholds for the focal E2-CS/RT were actually lower in contrast to the distributed E1-CS/RT. Furthermore, the specific involuntary responses (eg, shoulder, elbow) of E2-CS/RT suggest that its stimulation was activating portions of the motor map near the electrodes’ contacts rather than regions remote to the site of the electrode.
It is important to note that the experimental lesions used in the present study were relatively modest in their resulting motor impairments in contrast to the motor deficits observed with stroke. It is also expected that effective current spread is different in rat versus human cortex. Modeling of epidural cortical stimulation over the precentral gyrus indicates that even at low current amplitudes, the majority of current enters the cortex, particularly in the crown of the gyrus. 38 The geometry, orientation, and membrane properties of individual cells will affect their activation by brain stimulation. 39,40 The smaller dura and cerebrospinal fluid barriers and lissencephalic nature of the rat brain also lend to greater responses to surface stimulation relative to human cortex. 38 These factors are important considerations for interpreting the data of animal studies of CS/RT. The distribution of CS/RT stimulation is an important translational issue because of the markedly greater size of motor cortex in humans relative to rodents. Cytoarchitectonic analysis 41 of the human precentral gyrus has suggested its volume to be approximately 11 cm3, whereas metabolic mapping of rodent motor cortex using positron emission tomography (PET) 42 has estimated its volume to be 0.105 cm3. In contrast to the disparity in tissue volumes, the stimulating contact areas of the human CS electrodes are only modestly larger, ranging between 28.27 and 42.41 mm2. 43-45
The clinical trials of CS/RT have localized the placement of the stimulating contacts based on fMRI activation during hand/wrist/finger movement. 43-45 More detailed localization with fMRI using craniometer landmarks and phase reversal to localize the central sulcus will likely provide better localization of the appropriate target for CS/RT stimulation movements. 24 Furthermore, transcranial magnetic stimulation (TMS) mapping of ipsilesional motor cortex may provide more optimal placement of stimulating contacts by providing details of the size and location of each motor map. 24 If the present data are correct and stimulation for CS/RT should be directed to movement representations surrounding the representations compromised by brain ischemia, then it will be necessary to perform TMS motor mapping in order to identify these sites. In addition to the location/distribution of stimulation, several other translational issues need to be addressed in order to properly administer CS/RT to individuals who have suffered stroke. For instance, optimal protocols for the timing and intensity of CS/RT are not known but may be guided by noninvasive brain stimulation studies such as TMS and transcranial direct current stimulation. 24 The specific profile of each individual with stroke may also affect the efficacy of CS/RT therapy. For example, lesion location, 46,47 sex of the individual, 48,49 and genotype 50,51 may affect responsiveness to rehabilitative training and/or brain stimulation.
The present findings further support the viability of CS/RT for enhancing motor function after stroke. The results also demonstrate the importance of stimulation distribution in CS/RT. Future clinical trials of CS/RT must consider the importance of stimulating wide areas of cortex to promote functional reorganization and motor recovery.
Footnotes
The author(s) declared no potential conflicts of interest with respect to the authorship and/or publication of this article.
The author(s) received no financial support for the research and/or authorship of this article.