
Abstract
Methods in molecular and genetic biology have provided important clues to elucidate the complex mechanisms of oral and craniofacial development and pathogenesis of diseases. It has become increasingly clear that a biological phenotype is a result of multiple factors involving a large number of regulatory genes, while a single nucleotide mutation can cause various degrees of oral and craniofacial abnormalities. These oral and craniofacial problems often present a challenge to the molecular screening process. Recent advances in microarray-based technologies allow for large-scale gene expression analysis in a single experiment, which have been applied to genome-wide assays, mutational analysis, drug discovery, developmental biology, and molecular analysis of various diseases. This review introduces the basic principle and some modifications of techniques and materials used in microarray technology, as well as currently available microarray data analysis strategies. Microarray technology can be applied to the soon-to-be-available human genome database and will be a powerful research tool for those inquiring into specific problems associated with oral and craniofacial biology.
(I) Introduction
Over the past decades, genetic studies have elucidated numerous genes and their functions. Moreover, the completion of the human genome project is expected within the next several years. With the increasing availability of genetic information, the focus of biological and molecular biologic studies has begun to shift from the characterization of individual components of a biologic system to the behavior of the entire biologic system. Microarray-based assay technology provides investigators with the ability to measure the expression profile of thousands of genes in a single experiment. The concept of this technology appeared as an oligonucleotide array on a solid surface in the early 1990s (Fodor et al., 1991, 1993; Chetverin and Kramer, 1993; Pease et al., 1994). Subsequently, the complementary DNA (cDNA) microarray was developed by Patrick O. Brown's group at Stanford University in 1995 (Schena et al., 1995). Shortly thereafter, it became a widely used technology. MEDLINE database searches of the key words "DNA microarrays", "oligonucleotide arrays", and "DNA chips" reveal a rapid increase in the number of articles related to these technologies (Fig. 1). Publication of an entire supplemental issue of Nature Genetics (Phimister, 1999), some monographs (Schena, 1999, 2000), and the increasing number of commercially available services (Table) also reflect the rapid growth of interest in microarray technology.
In the field of oral and maxillofacial biology and medicine, study at the molecular level is essential for the diagnosis, prognosis, and treatment of diseases, as well as for understanding the development of normal and abnormal tissues/organs. Based on the findings of previous studies, it is now clear that comprehensive profiling of gene expression using microarray technology helps investigators to clarify the complex mechanisms of physiological and pathophysiological events at the transcriptional level. Here we provide an overview of the basic knowledge of and recent advances in microarray-based technology, and discuss its impact and future direction on oral biology and medicine. The following topics will be discussed:
Principle of microarray technologies Critical issues on the methods Technical challenges and alternative methods Data interpretation and validation Data management strategies Designs and application of the microarray Microarray application to oral biology and medicine Use of microarray in tissue engineering, phenotype analysis, and monitoring Future directions of genome-wide biology
(II) Principle of Microarray Technologies
The basic principle underlying microarray technology is that complementary nucleic acids will hybridize. This is also the basis for traditional gene expression analyses, such as Southern and Northern blotting. Hybridization provides exquisite selectivity of complementary stranded nucleic acids, with high sensitivity and specificity. In the traditional techniques, in which radioactive labeling materials are usually used, the simultaneous hybridization of test and reference samples is impossible. In microarray-based technologies, the solid surface, such as a glass slide, contains hundreds to thousands of immobilized DNA (targets) spots which can be simultaneously hybridized with two samples (probes) labeled with different fluorescent dyes (Fig. 2). [With the recent progress in technology, the size of the filter array has also been reduced from macro to micro. Although the term "microarray" was originally used to describe solid-support DNA microarrays, it has recently been used to include some filter arrays (Chen et al., 1998; Han et al., 2000; Lyakhovich et al., 2000). To prevent confusion, we use the term "microarray" to describe only solid-support microarrays in this article. Also, the terms "target" and "probe" have been used to denote immobilized DNA on a support and labeled cDNA synthesized from an RNA sample, respectively, by the group of developers (Shalon et al., 1996). Although some researchers have used these terms to denote the opposite meanings, in this article we define these terms using the same definitions as the developers' to prevent confusion.] After hybridization, the fluorescent signals of two probes bound to individual spots are detected with a confocal laser scanner. The separately scanned images from each of the two probes are then combined and pseudocolored by means of computer software, and the expression ratios of two probes are calculated. Based on these systematic procedures, microarrays make possible large-scale gene expression monitoring in a parallel fashion.
Compared with filter arrays, in which DNAs are arrayed on a membrane, the solid surface of a glass slide has several advantages (Cheung et al., 1999; Southern et al., 1999). First, the covalent attachment of the target DNA to the coated-slide surface provides sufficient stability of the spotted DNA (Zammatteo et al., 2000). Second, because glass is impermeable and rigid, liquid cannot penetrate the surface of the support. Consequently, the targets can find immediate access to the probes without diffusing. Third, by preventing diffusion, it is possible for one to minimize hybridization sample volume, to reduce the washing time after hybridization, and to improve the reproducibility. Fourth, rigidity and flatness of the glass support surface also provide high image definition. Fifth, glass is a low-fluorescent material; therefore, it does not significantly contribute to background noise.
Currently, there are two different formats of microarray-based technologies dependent on the target nucleic acid components, i.e., the oligonucleotide array and the cDNA microarray. The oligonucleotide type of array consists of oligonucleotide targets, generally less than 25 mer in length (Shoemaker et al., 1996; Fambrough et al., 1999; Lipshutz et al., 1999), which are generated in situ on a solid surface by light-directed synthesis (GeneChip®, Affymetrix, Inc., Santa Clara, CA, USA) (Fodor et al., 1991; Hacia et al., 1996). Synthetic linkers modified with photochemically removable protecting groups are attached to the glass substrate. Light is then directed through a photolithographic mask to specific areas on the surface to produce localized photodeprotection. Hydroxyl-protected deoxynucleotides are incubated with the surface so that chemical coupling occurs at the sites that have been illuminated in the preceding step. By repetition of these procedures with new masks, hundreds of thousands of oligonucleotides can be synthesized in a very small area (Fodor et al., 1991; Lipshutz et al., 1999). Alternatively, oligonucleotide arrays can be constructed by the spotting of pre-synthesized oligonucleotides onto the solid surface (Yershov et al., 1996; Marshall and Hodgson, 1998; Ramsay, 1998).
Because oligonucleotide arrays are designed and synthesized based on sequence information, physical intermediates such as cloning and polymerase chain-reaction (PCR) are not required. Specific sequences, which are non-overlapping if possible or minimally overlapping if necessary, can be designed to increase the hybridization sensitivity, even through their shorter sequences (Lipshutz et al., 1999). In contrast, the cDNA microarray is fabricated by the printing of cloned and amplified cDNAs onto the solid surface. The advantages of the cDNA microarray compared with the oligonucleotide array have been thought to include less susceptibility and higher specificity due to the longer sequences of the targets (Bilban et al., 2000). However, cDNA may contain repetitive sequences that are often observed in various genes, or similar sequences that are found in family member genes. These non-specific sequences may affect the sensitivity of the cDNA microarray.
To date, it is still unclear which method is more sensitive. There are no scientific data in which the cDNA microarray and the oligonucleotide array are directly compared. There is a tendency that the cDNA microarray is used for the screening of steady-state mRNA expression levels and the oligonucleotide array is applied when more precise analysis, including the detection of single nucleotide polymorphisms, is required (Wang et al., 1998; Sapolsky et al., 1999; Lindblad-Toh et al., 2000).
(III) Critical Issues on the Methods
(A) Fabrication of a c DNA microarray
The first step in cDNA microarray construction is the preparation of cDNA as arrayed targets. Any double-stranded cDNA, and probably single-stranded cDNA, can be used for the fabrication of a microarray (Eisen and Brown, 1999). In general, cDNAs ranging in length from 0.2 to 2.5 kb are used. For adequate hybridization with probe cDNA, the concentration of the target cDNA should be as high as 500 ng/μL. Conventional cloning techniques and PCR amplification are usually required for the target cDNA preparation. After ethanol precipitation, PCR products are suspended in 3X SSC (20X SSC = 17.5% sodium chloride and 8.82% sodium citrate, pH 7.0) and are placed in 96- or 384-well microtiter plates. Target cDNAs are printed onto a poly-L-lysine-coated microscope glass slide by means of a robotic arrayer (Fig. 3). The coated surface provides attachment sites for the target cDNA so that it remains bound to the glass surface during hybridization and washing. Two types of arraying techniques have been used for application of target cDNA to the glass surface. First, in passive dispensing, in which the target is loaded into a spotting pin by capillary action, a small volume of the target is transferred to the glass surface by physical contact between the pin and the solid surface. The second method is based on drop-on-demand delivery, which is achieved by the adaptation of ink- or bubble-jet technology (Schena et al., 1998; Okamoto et al., 2000). To date, the passive dispensing method with spotting pins has been used more widely than ink-jet technology. By means of a robotic arrayer, approximately 75,000 genes can be printed on a standard 1 x 3 inch microscope (Eisen and Brown, 1999).
Before hybridization, the microarray requires four steps of post-processing. Rehydration and snap-drying of the microarray provide an even distribution of the target cDNA throughout the spot. Ultraviolet cross-linking with 65 mJ of energy improves the stability of the spotted cDNA. Blocking of the coated glass surface reduces the non-specific binding of the labeled probe to any remaining free poly-L-lysine. This step is essential to minimize hybridization background noise (Fig. 4A). Particular attention must be paid to the blocking process. An unnecessarily long period of blocking can cause washing-off of the spotted DNA. This phenomenon is called "comet tails" (Eisen and Brown, 1999) (Fig. 4B). The final step in post-processing is the denaturation of the printed target cDNA by heating of the array with boiling water for 2-3 min. After post-processing, individual spots on the microarray are usually invisible. Based on our experience, post-processed microarrays can be stored at room temperature for at least six months to probably several years.
(B) Probe preparation and microarray hybridization
For the comparative hybridization of two probe samples to the microarray, total RNA or mRNA is isolated from tissues or cells. For an adequate fluorescent signal, from 15 to 200 μg of total RNA, depending on the size of the microarray and type of sample, is required for cDNA synthesis and labeling. RNA from test and reference samples is converted to cDNA by reverse transcription with reverse transcriptase, and labeled with two different fluorescent dyes. Although various types of fluorescent labeling materials are now commercially available, Cy3- and Cy5-dUTP or dCTP (Amersham Pharmacia Biotech, Inc., Piscataway, NJ, USA) are generally used for this purpose (Schena et al., 1995; Eisen and Brown, 1999). These fluorescent dyes are spectrally well-separated and can be directly incorporated into synthesized cDNA during reverse transcription. In addition, they have sufficient brightness for image acquisition processing. The separately labeled probes are pooled and concentrated. After concentration, successfully labeled probe can be identified by its color. Probes labeled with Cy3 and Cy5 show light pink and light blue, respectively. Pooled probes of Cy3 and Cy5 are light purple. Probes are suspended into the hybridization solution containing 3X SSC and 0.5% sodium dodecyl sulfate (SDS), and hybridized to the microarray under a coverslip in a specially designed hybridization chamber that is submerged in a 65°C water bath for 14-20 hrs. Alternatively, a mixture of 50% formamide, 3X SSC, 0.5% SDS, and 5X Denhardt's solution can be utilized as a hybridization solution. In this case, hybridization should be carried out at 42°C. In addition, supplementation of oligo(dA), Cot-1 DNA, and/or salmon sperm DNA into the hybridization solution is effective for minimizing non-specific hybridization. After hybridization, the microarray is washed and air-dried. A complete protocol, including microarray fabrication, probe sample preparation, and hybridization of the microarray, is available on the Web site for Brown's laboratory (http://cmgm.stanford.edu/pbrown/).
(IV) Technical Challenges and Alternative Methods
(A) Alternative techniques for microarray fabrication
In addition to the original method described previously, some researchers have attempted to modify the techniques or materials to improve the effectiveness of microarray technology. For example, disulfide coupling, which has been used in the ligation of DNA, was applied to increase the stability of the target DNA on the solid support (Rogers et al., 1999). The preparation of target cDNA by means of the PCR/ligase detection reaction demonstrates an increase in hybridization sensitivity such that a point mutation could be detected (Gerry et al., 1999; Favis et al., 2000).
(B) Modified methods for probe preparation from a small amount of sample
One of the technical challenges is to obtain the distinction of hybridization signals. As described above, DNA microarray hybridization requires relatively large amounts of RNA for probe cDNA synthesis and labeling. However, when only a small amount of sample tissue or a limited number of cells is available, it is difficult for enough RNA to be prepared. Microarray hybridization with cDNA probes synthesized from insufficient RNA results in inadequate or undetectable signal intensities. Therefore, to maintain or improve the fluorescent signal with a concomitant reduction of starting RNA, investigators have applied modified methods for probe preparation and labeling for microarray technology.
In vitro transcription (IVT), also known as the antisense RNA (aRNA) or complementary RNA (cRNA) amplification technique, was originally developed for gene expression analysis of single cells and extremely small amounts of tissue sample (Kacharmina et al., 1999). cDNA synthesis from mRNA is carried out with a specially designed oligo(dT) primer [oligo(dT)24-T7]. This primer contains the bacteriophage T7 RNA promoter sequence. The cDNA is made double-stranded by conventional techniques. Synthesized double-stranded cDNA containing the T7 RNA promoter can then be utilized as a template for aRNA synthesis by the T7 RNA polymerase. The original protocol recommended repeating the amplification procedure to produce a greater concentration of aRNA. By repetition of the procedure for two rounds, aRNA is amplified 106-fold greater than the starting material (Eberwine et al., 1992). This amplified aRNA can be used in microarray assessment, as well as in other methods for gene expression analysis, such as reverse transcriptase (RT)-PCR. For microarray hybridization, aRNA amplification is carried out in the presence of biotinylated UTP or CTP. The biotinylated aRNA probe can be hybridized to the microarray and stained with streptavidin-phycoerythrein before or after hybridization to the microarray (Coller et al., 2000). The detailed protocol for this method is available on the Whitehead/MIT Genome Center's Molecular Pattern Recognition Web site (http://waldo.wi.mit.edu/MPR/index.html). Alternatively, conventional cDNA synthesis and labeling can also be applied to the amplified aRNA (http://cmgm.stanford.edu/pbrown/).
Some studies have demonstrated the effectiveness of the aRNA amplification technique for microarray probe preparation. The improved signal intensities by aRNA amplification with 2.5 μg of starting total RNA have been documented by application to oligonucleotide array hybridization (Mahadevappa and Warrington, 1999). It has also been demonstrated that two rounds of aRNA amplification from 0.01 μg of starting total RNA and Cy dye-labeling can produce enough signal for microarray analysis (Wang et al., 2000).
By integrating aRNA amplification with the whole-cell patch electrode technique, one can analyze the gene expression in a single cell (VanGelder et al., 1990; Eberwine et al., 1992). It is likely that this approach can be applied to microarray technology. In addition, when aRNA amplification is performed in situ (in situ transcription; IST) on a fixed tissue section or microdissected tissue (Tecott et al., 1988; Zangger et al., 1989), the aRNA can be separately amplified in histologically normal and abnormal areas. Therefore, a more accurate comparison of gene expression in histologically different areas within the same tissue section is possible (Bowtell, 1999; Kacharmina et al., 1999). In fact, the RNA expression patterns in large- and small-sized neurons harvested independently from a fixed tissue section by laser-capture microdissection can be analyzed by aRNA amplification and DNA microarray (Luo et al., 1999). The results successfully have demonstrated the differential expression of genes in small and large neurons, as well as the usefulness of the integration of aRNA amplification with the microarray system. A combination of aRNA amplification and immunohistochemical staining may make possible a comparison of gene expression profiles between immunologically positive and negative areas in the same tissue section.
As another method for increasing the fluorescent signal intensities, amino-allyl reverse transcription (AA-RT) can be used for probe preparation (http://cmgm.stanford.edu/pbrown/). Briefly, cDNA is synthesized from total RNA or mRNA in the presence of amino-allyl dUTP (aa-dUTP, Sigma, St. Louis, MO, USA) instead of Cy3- or Cy5-dUTP. The aa-dUTPs incorporated into the synthesized cDNA are coupled with Cy3 or Cy5 monofunctional dye (Amersham Pharmacia Biotech, Inc.). Before the two labeled samples are pooled, aa-dUTP is quenched by the addition of hydroxylamine. Based on our findings, this technique results in an increase in fluorescent signal intensities compared with the direct fluorescent dye incorporation method, and reduces the required starting total RNA concentration to less than 10 μg. It is suspected that the enhancement of sensitivity by AA-RT is due to an increase in the reverse transcription rate compared with reverse transcription in the presence of Cy-dUTP.
Although the aRNA amplification technique is a very effective method for reducing the necessary starting RNA concentration, it does involve a long, complex protocol and the use of additional materials, such as the oligo(dT)24-T7 primer and the IVT kit (Ambion, Austin, TX, USA). In contrast, although AA-RT is less effective, this method is simpler and easier than aRNA amplification and has been the primary protocol used in our laboratory.
(V) Data Interpretation and Validation
(A) Image scanning
After being hybridized and washed, the microarray is scanned by means of a dual-wavelength confocal laser scanner. For fluorescent signals to be detected, wavelengths of 532 nm and 635 nm are required for Cy3 and Cy5, respectively. Scanning of the hybridized microarray should be carried out immediately after the washing, because the fluorescent dyes lose signal intensity with time (Fig. 5). Repeated scanning of the microarray also causes a decrease in fluorescent signal intensity, particularly for Cy5 (van Hal et al., 2000). For an accurate comparison of two samples, the scanned signal intensities of Cy3 and Cy5 should be at the same level. Because the starting RNA volumes of the two samples may not be exactly the same in most cases, the signal intensities of Cy3 and Cy5 must be adjusted to be as close as possible, with the use of sets of positive control genes. Although normalization of signal intensities between two samples is usually performed after scanning, adjustment of scanning level makes the normalization process easier.
(B) Measurement and normalization of signal intensities
Separately scanned images (TIFF files) of Cy3 and Cy5 signals are transferred into programmed software. Each image of Cy3 and Cy5 is gridded manually or automatically to define the areas of the individual spots. Averages and standard deviations of both signal intensities and background noise in individually defined areas are calculated. The difficulty of accurate control of the starting RNA sample volumes to the same level and the use of two different fluorescent dyes result in the discrepancy of raw fluorescent signal intensities between two probes. Therefore, a subsequent and very important step is the normalization of the fluorescent signals between two samples. Two different approaches have been used as normalization strategies (Duggan et al., 1999). One is the general normalization method, in which all of the target genes are considered for normalization (Hardwick et al., 1999; Ross et al., 2000). When two probes are derived from closely related samples, the transcriptional levels of many genes are expected to be unchanged. In other words, the Cy3/Cy5 ratios in this situation generally show a "bell-shaped curve" distribution (Fig. 6A). Also, when a large-scale microarray including thousands of genes is used, the distribution of the Cy3/Cy5 ratios likely shows a "bell-shaped curve". In these instances, the general normalization method is a useful tool.
The other approach is performed based on the sets of selected normalization control spots, such as housekeeping genes, which are expressed consistently under most circumstances (Lashkari et al., 1997; Loftus et al., 1999; Stephan et al., 2000). When divergent samples are compared or a small-scale microarray with hundreds or fewer genes is used, the transcriptional level may become more varied. This may result in a deviated distribution of the Cy3/Cy5 ratios toward one sample (Fig. 6B). In these cases, discrepancies between two samples should be normalized with sets of housekeeping genes. The distribution of the Cy3/Cy5 ratios is an important factor to be considered in the choice of a normalization strategy. In addition, when normalization is carried out with selected housekeeping genes, it is essential for as many control genes as possible to be used, particularly in a comparison between dissimilar samples. Our study revealed that the transcript levels of housekeeping genes were divergent from sample to sample (Figs. 7A, 7B). Inappropriate normalization may affect the results of selection of differentially expressed genes. After the normalization process, the Cy3/Cy5 ratio for each individual spot is calculated against the normalized signal intensities.
Two separately scanned images of Cy3 and Cy5 are combined and pseudocolored for visualization of the differentially expressed genes (Fig. 2). Yellow spots indicate evenly expressed genes in both test and reference samples. Red and green spots denote up-regulated and down-regulated genes in the test compared with the reference sample, respectively.
(VI) Data Management Strategies
(A) Selection of differentially expressed genes
To date, various approaches have been attempted for the analysis and exploration of microarray data. However, investigators are confronted with the problem of deciding which expression ratios to regard as significant, because there are no standard criteria for the selection of differentially expressed genes. The most widely used method is the application of the cut-off value. Most studies have defined a two- to three-fold change in gene expression in the test sample compared with the reference as significant induction or repression (Fambrough et al., 1999; Feng et al., 1999; Zhao et al., 2000). Differentially expressed genes can also be selected by the calculation of confidence intervals (CIs). In this method, 99% CIs are usually used. A recent study suggested that two strategies of fold changes and CIs were consistent, i.e., 95% and 99% CIs corresponded to 1.5- and two-fold changes, respectively (Geiss et al., 2000). However, these consistencies are not necessarily observed in biology, particularly when expression ratios show a deviated distribution (Fig. 6B). Like the normalization process for signal intensities, distribution of the expression ratios is an essential factor for choice of the appropriate gene selection strategy. In addition, ± 2 or ± 3 standard deviations of expression ratios is also used for selection of the differentially expressed genes (DeRisi et al., 1996; Behr et al., 1999; Karpf et al., 1999).
(B) Data visualization and exploration
To visualize and explore microarray expression data, investigators have applied several methods (Ermolaeva et al., 1998; Bittner et al., 1999; Gaasterland and Bekiranov, 2000; Young, 2000). Scatter-plot analysis can identify outlying genes whose expression levels are different between the test and reference (Coller et al., 2000; Sudarsanam et al., 2000). If one reference (e.g., one time-point) is used as a baseline, the scatter-plot comparisons of one reference with several test samples generate a Pearson correlation coefficient for each comparison (Khan et al., 1998; Voehringer et al., 2000).
For identification of the sets of regulated genes, several clustering methods have been applied for microarray data. K-means cluster, clustergram, and self-organizing maps with a software program make clustering of genes through several time points possible, due to the similarity of their expression patterns (Eisen et al., 1998; Tamayo et al., 1999; White et al., 1999; Soukas et al., 2000; Zhao et al., 2000). Clustering analysis of sample-sample correlation can also be performed by the dendrogram method (Khan et al., 1998; Scherf et al., 2000). In this technique, samples are clustered based on their gene expression profiles or their sensitivity to the stimuli, such as a drug, by measurement of the metric distance of one Pearson correlation coefficient. Additionally, by the addition of a second dimension of clustering, such as gene clusters, to the dendrogram, a double dendrogram can be displayed (Perou et al., 1999; Alizadeh et al., 2000). As another means of cluster analysis, genes can be classified into several categories based on their biological functions (Ferea et al., 1999; Iyer et al., 1999; Ly et al., 2000). In addition, some investigators combine several clustering methods and/or other techniques to elucidate and explore the comprehensive and complex transcriptional regulation mechanisms and functional interactions of genes. As mentioned above, individual clustering techniques provide different information. Investigators, therefore, should choose or combine the appropriate methods for their purpose.
The chromosomal display technique of the yeast genome has been applied to microarray data for visualization of the chromosomal locations of differentially expressed genes by histone H4 depletion (Wyrick et al., 1999). The ProbeBrowser software (http://molepi.stanford.edu/free_software.html), which integrates microarray data with the genomic positions of the hybridization targets and displays corresponding open reading frames annotations, has been used for the microarray analysis of Bacille Calmette-Guerin vaccines (Behr et al., 1999). These methods can visualize the relationship between differentially expressed gene and genomic region. To determine the genetic network architecture, investigators have applied a combination of K-means clustering and sequence motif searching to the microarray results at the several time points throughout the yeast cell cycle (Tavazoie et al., 1999). The results indicate a significant correlation between gene expression patterns and sequence motifs.
(C) Biological validity of microarray data
In some studies, microarray analysis was performed in tandem with another traditional gene expression assessment assay as a means of ensuring the reliability of the microarray data. Northern blotting and RT-PCR have generally been used for comparison. Consistencies or at least similar tendencies were demonstrated in the results of these experiments (DeRisi et al., 1996; Chu et al., 1998; Mochii et al., 1999; Wilson et al., 1999; Aharoni et al., 2000; Coller et al., 2000; Feng et al., 2000; Pendurthi et al., 2000; Soukas et al., 2000; Yoshioka et al., 2000; Zhao et al., 2000). In another study, the in situ hybridization positive cells were captured by laser microdissection, and the corresponding gene expression was tested by microarray. Two independent experiments validated the microarray data (Luo et al., 1999). Thus, the high reliability of the microarray data has been documented.
(VII) Designs, Applications, and Weaknesses of the Microarray
Researchers can fabricate a custom microarray with any design, depending on their purpose and question. Microarray design can be classified into two major categories. One is the large-scale microarray that includes thousands of target genes. Because this type of microarray contains different kinds of genes, it is utilizable for any type of gene expression analysis and is the most common application. We therefore call it the versatile-type microarray. This type of microarray has been used in genomic-wide research (Schena et al., 1996; Lashkari et al., 1997; Eisen et al., 1998), mutational analyses (Myers et al., 1999; Sudarsanam et al., 2000), pharmacology (Behr et al., 1999; Scherf et al., 2000), toxicology (Nuwaysir et al., 1999; Bartosiewicz et al., 2000), aging research (Lee et al., 1999, 2000; Ly et al., 2000), molecular analyses of malignant tumors (Golub et al., 1999; Alizadeh et al., 2000; Ross et al., 2000), and other diseases (Kozal et al., 1996; Wilson et al., 1999; Geiss et al., 2000). The results of these studies demonstrate the value of the versatile-type microarray for the analysis of development, disease, and drug discovery at the transcriptional level.
The second category of microarrays includes those designed for a specific purpose. We call this the "aim-specific microarray (ASMA)". A microarray in this category is constructed with selected genes of interest, or genes that are significant to a certain disease. An ASMA fabricated with 96 inflammatory-related genes has been used for evaluation of the mRNA expression levels in samples from rheumatoid arthritis patients (Hellar et al., 1997). Another ASMA with 148 target genes, including metabolic enzymes, DNA repair enzymes, stress proteins, and cytokines, has been generated for analysis of the genetic response to toxicants (Bartosiewicz et al., 2000). Several studies have reported analyses combining the microarray and other differential display techniques (Welford et al., 1998; Yang et al., 1999; Liau et al., 2000). For instance, 26 differential immuno-absorption products of human glioblastoma (GBM) and normal brain tissues are used for construction of an ASMA for monitoring transcript levels in tumorous and non-tumorous brain specimens (Liau et al., 2000).
Microarray construction with a cDNA library derived from a specific tissue, which is called "tissue-specific microarray", has also been proposed. Microarrays with rat heart cDNA libraries are fabricated for examination of the gene expression profile in response to myocardial infarction (Sehl et al., 2000; Stanton et al., 2000). In addition, others have fabricated microarrays with genomic DNA. A microarray constructed with clones from chromosome 20 is used for analysis of the DNA copy number variation in breast cancer (Pinkel et al., 1998). With this approach, the result has demonstrated chromosome 20 aberrations in breast cancer. Linkage-disequilibrium mapping in combination with a chromosome-11 microarray analysis has successfully achieved gene-mapping without marker-by-marker genotyping (Cheung et al., 1998).
Various types of ASMAs, such as apoptosis, malignant tumor, and cytokines, are now commercially available from several manufacturers. In general, an ASMA can be constructed on a smaller scale. An advantage of the smaller microarrays is that it is possible for the time and cost for microarray fabrication to be reduced, the RNA sample volume to be minimized, and a high quality of target DNA to be maintained. Although there are more limited data acquired with an ASMA, it is a valuable tool for investigators to use in achieving specific objectives. Researchers should therefore choose the design of the microarray with due consideration given to their purpose.
Today, with the rapid progress in sequencing the human genome, we have entered the "post-genome" era. Whereas the concept of functional genomics was once futuristic, it is now a reality. The research after extended genome projects is moving from data-poor science to data-rich science. This is reflected in a recent Nature "Insight" (Dhand, 2000) that focused on functional genomics, including global gene expression analysis by microarray technology (Lockhart and Winzeler, 2000), proteomics or large-scale analyses of proteins (Pandey and Mann, 2000), and computational biology (Eisenberg et al., 2000). Some researchers have even attempted to analyze DNA-protein interactions using a double-stranded DNA array (Bulyk et al., 1999), or the differential-display proteomics assay using a protein chip (Pandey and Mann, 2000). Future post-genomic research includes functional genomics, global expression monitoring for genes and proteins, and gene network analyses that combine several genetic analysis techniques (Thieffry, 1999).
Against the advantages, several weaknesses of microarray technology have also been pointed out. These include high cost and time consumption, necessity of special devices, and difficulty of data interchange between individual microarrays. Moreover, it is also difficult for the expression levels between individual targets to be compared in the same RNA sample, because of different hybridization rates due to variations of melting temperature depending on sequence and length of target gene fragments (Duggan et al., 1999).
(VIII) Microarray Application to Oral Biology and Medicine
Microarray is generally applied for the following purposes:
tissue/cell phenotype analysis by multiple gene expression assay, identification of pathogenes, and genome-wide mutation survey and diagnosis of genotypic polymorphisms and mutations.
In the areas of dental, oral, and maxillofacial research, great effort has been devoted to elucidating the molecular and genetic bases of normal and abnormal conditions. Although most human diseases are assumed to have multifactorial etiologies, they often include a genetic contribution (Townsend et al., 1998; Hart et al., 2000). Typically, congenital and developmental malformation, infections, and malignant diseases are associated with a particular genetic background (Mitchel, 1997; Miller et al., 1998; Tucker and Sharpe, 1998; Weiss et al., 1998; Hodge et al., 2000; Schwartz, 2000; Scully et al., 2000a,b). Molecular and genetic information related to these diseases has accumulated and has been applied for developing clinical tools for diagnosis, prognosis, and treatment (Garlick and Fenjves, 1996; Shillitoe, 1998; Tralongo et al., 1999; Komiya et al., 2000). However, the complex mechanisms of the genetic pathways specific to oral and maxillofacial tissues in both physiological and pathophysiological events are not yet fully understood.
It has been suggested that the neural-crest-derived craniofacial tissues may react differently to tissue remodeling, wound healing, and/or aging processes. In particular, craniofacial bones, which lack cartilage precursor tissue, develop through intramembranous ossification, whereas lumbar and extremity bones undergo endochondral ossification. Once these bones of different embryonic origin are generated, however, a similar remodeling process is thought to take place. We have characterized the differential expression patterns of the extracellular matrix (ECM)-related genes between adult female mouse calvaria and humerus bones with a custom ASMA constructed with ECM-related genes (Fig. 8). The gene expression pattern was generally similar; however, calvaria was associated with the elevated expression (> two-fold) of col1a1, col1a2, col9a1, col19a1, and osteonectin.
The DNA microarray analysis of human gingival epithelial cells has revealed that multiple genes, including transcription factors, cell proliferation factors, cytokines, cell adhesion molecules, and metalloproteinases, are induced in response to bacterial lipopolysaccharide (Abiko et al., 2000). A tissue-specific microarray for oral epithelium (normal and malignant) is in the developmental stage (http://web.upstate.edu/~shillitoe). In our recent study, in which, using a custom ASMA constructed with ECM-related genes, we examined gene expression in bone around titanium implants placed in the femurs of ovariectomized (OVX) and sham-operated rats, we demonstrated the differential expression of multiple ECM genes in the OVX rats (unpublished observation). These investigations documented the expression of genes whose association with a particular condition had not been previously known.
The gene expression profiles of nearly 300 Saccharomyces cerevisiae deletion mutants were evaluated by DNA microarray with genomic DNA hybridization (Hughes et al., 2000). The results demonstrated widespread aneuploidy in those mutants. In combination with comparative genomic hybridization for surveying DNA copy-number variation across the whole genome in normal and tumor cells, the microarray analysis has successfully identified gene amplifications and deletions throughout the genome (Pollack et al., 1999). These types of genomic analyses would be useful for elucidating the pathological mechanisms of congenital and developmental abnormalities, such as cleft lip and palate, and mandibular prognathism. Adaptation of microarray technology makes it possible for investigators to analyze the genetic pathways and dynamic interactions of genes in various diseases, e.g., oral mucosal disease including pre-malignant and malignant tumors, periodontal disease, endodontic disease, temporomandibular joint disorders, and cystic diseases, as well as normal and abnormal development of oral and craniofacial structures.
(IX) Use of Microarrays in Tissue Engineering, Phenotype Analysis, and Monitoring
Tissue engineering, a rapidly developing scientific field, is a technology designed to produce biological products for replacing lost or malfunctioning tissues/organs due to congenital or developmental abnormalities, disease, or trauma (Langer and Vacanti, 1993). Tissues in vertebrates consist of many components, e.g., cells, ECM proteins, receptors, and other proteins. The ECM acts as a modulator for cell attachment, growth, migration, and spreading (Luparello et al., 1999; Vaday and Lider, 2000). Interactions between cells and the ECM, therefore, play a crucial role in development, differentiation, growth, remodeling, and wound healing (Adams and Watt, 1993; Rudolph et al., 1999). Moreover, numerous studies have demonstrated that cell-ECM interactions regulate gene expression at the transcriptional level during physiological and pathophysiological events (Ashkenas et al., 1996; Lelievre et al., 1996).
Gene expression analyses have been used for the phenotypic assessment of various tissues, as well as engineered tissue (Khorramizadeh et al., 1999; Kim et al., 1999; Nishimura et al., 2000). However, classic gene expression techniques, such as Northern or Southern blot analysis, are limited in their ability to evaluate the expression patterns of multiple genes. In fact, in a recent study, Northern blot analysis failed to document differential gene expression (Delany et al., 2000). Comprehensive monitoring of gene expression by microarray technologies is essential for the identification of a cell or tissue phenotype and for determination of their activities.
The contributions of the senescent cell type and telomerase expression in dermal fibroblasts to the morphology and phenotype of skin were evaluated by means of a cDNA microarray (Funk et al., 2000). The results have demonstrated a higher expression of matrix degradation-related genes, such as tPA, uPA, stromelysins-1 and -2, and cathepsin O, and a lower expression of ECM genes, such as α1(I), α1(III) collagens, and integrin α1, in senescent and telomerase-expressing fibroblasts compared with young fibroblasts. Gene expression during cardiac growth and myocardial infarction development by a cDNA has demonstrated specific molecular characteristics of those phenotypes (Sehl et al., 2000; Stanton et al., 2000). Surprisingly, the result suggests that osteoblast-specific factor 2, also known as type II Cbfa1, which is thought to be a specific gene in bone and tooth formation (D'Souza et al., 1999; Ducy et al., 1999), might be an important gene for the development of myocardial infarction (Stanton et al., 2000). An aging study of human fibroblasts with the use of oligonucleotide arrays demonstrated that one-third of differentially expressed genes are involved in the maintenance and remodeling of the ECM (Ly et al., 2000).
The gene expression patterns in a p53-transfected human colon cancer cell line were assessed by oligonucleotide arrays (Zhao et al., 2000). The results revealed that the genes of cytoskeletal molecules, growth factors, ECMs, and cell adhesion proteins are significantly more frequent in p53-regulated genes than those of other categories. These studies demonstrate the usefulness of comprehensive gene expression profiling by means of microarray technologies, as well as the importance of ECM-related genes for cell and tissue phenotype analysis.
There is a relatively high incidence of tissue defects in the oral and maxillofacial area. Tissue engineering, therefore, will be a very important area of study in the next decade. It may be valuable for investigators, using comprehensive gene expression analysis, to determine how close engineered tissues are to the original tissue. Microarray-based technologies can lead us to a higher level of understanding of the biology of the oral and maxillofacial area.
(X) Future Directions of Genome-wide Biology
In February, 2001, near-complete sequence of human genome was revealed by two teams (International Human Genome Sequencing Consortium, 2001; Venter et al., 2001). The history of molecular biology has officially entered the post-genome era. As we described in the introduction to this review, the focus of research in molecular biology has shifted from the characterization of individual components of a biologic system to the behavior of the entire system. For example, transition of gene expression analysis from Northern blotting to high-throughput methods, such as microarray-based systems, has facilitated an analysis that is more informative. Similar transition of technology has also occurred in protein research, from Western blotting to protein chips (Pandey and Mann, 2000). A recent review described this future direction of post-genomic research and the necessity of the biological atlas of functional maps (Vidal, 2001). For this to be done, large-scale functional maps must be created. In gene expression profiling, genomics, and proteomics, large-scale mapping becomes realistic. Development of other large-scale mapping technologies, such as knock-out mapping of large numbers of genes and localization mapping of large numbers of proteins, might be required for scientists in the next decade. Integration of many large-scale approaches of gene expression profiling, gene knock-out, biochemical and structural genomics, proteomics, and protein localization will be able to create the biological atlas of functional maps. Microarray-based technologies for comprehensive gene expression profiling will play a critically important role in this direction. It is clear that the goal of biology and pathophysiology in the next decade will be to create a cell/tissue-specific atlas of functional maps.
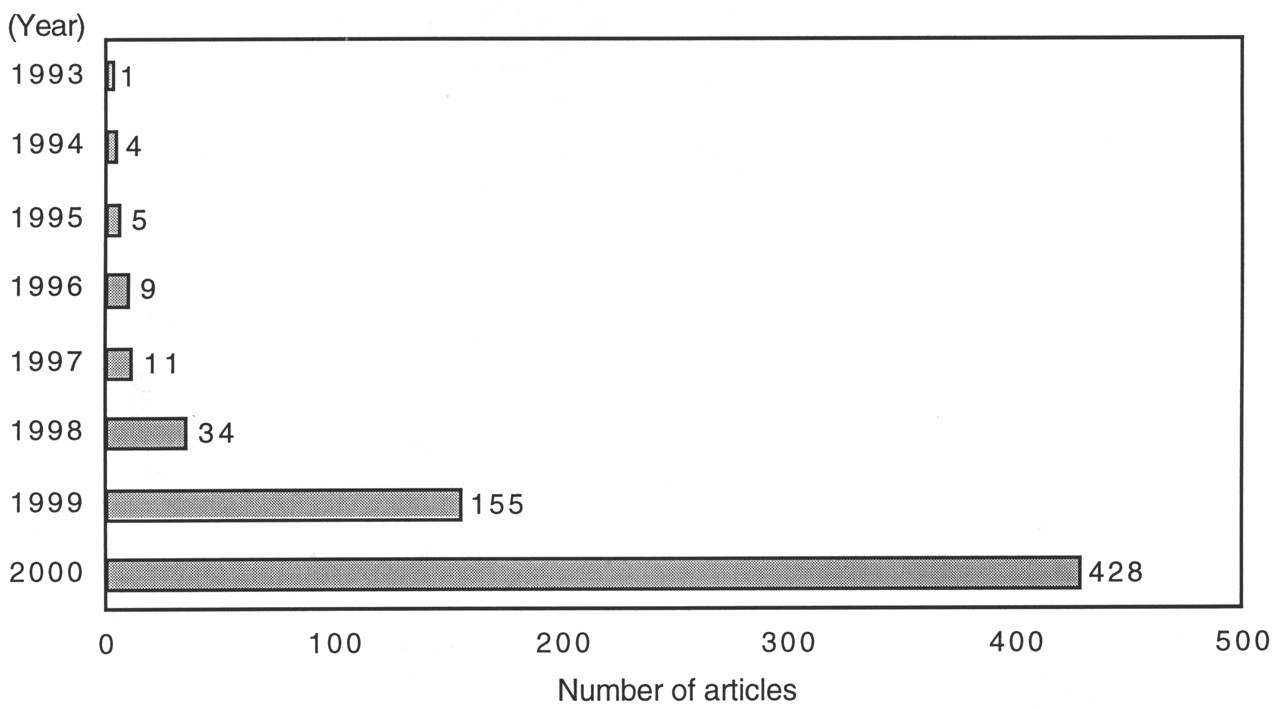
The number of published articles related to microarray technologies from 1993 to 2000. A rapid increase in the number of published articles from 1997 until the present is revealed by MEDLINE database searches.
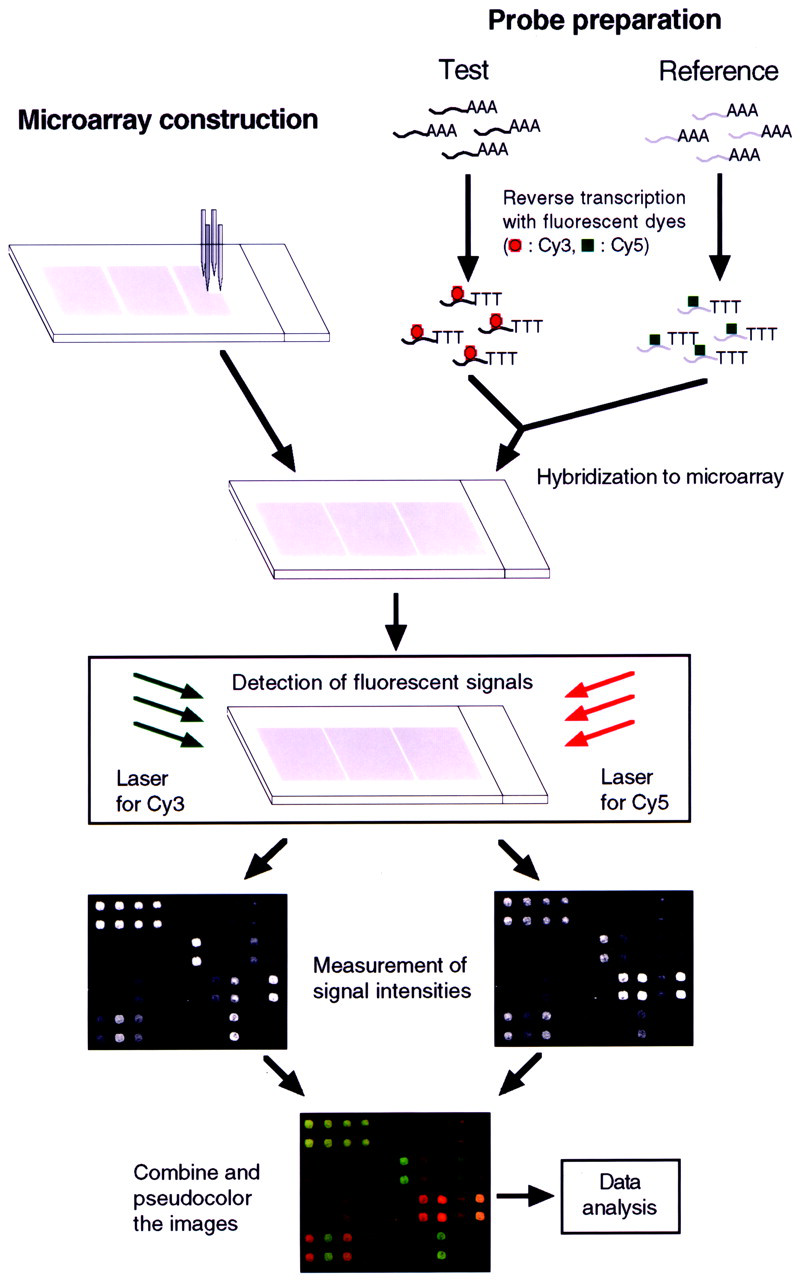
Principle of the cDNA microarray analysis system. Target cDNAs are cloned, and amplified by PCR. Purified PCR products are printed onto glass microscope slides with a robotic microarrayer. cDNA probes (test or reference) labeled with different fluorescent dyes (Cy3-dUTP and Cy5-dUTP) are synthesized from total RNA or mRNA derived from test and reference samples. Pooled probes are hybridized to the microarray. Hybridized fluorescent signals are detected with a dual-wavelength laser scanner. Separately scanned images are combined and pseudocolored by means of specialized computer software. Normalized ratios of Cy3/Cy5 are calculated for individual target genes.
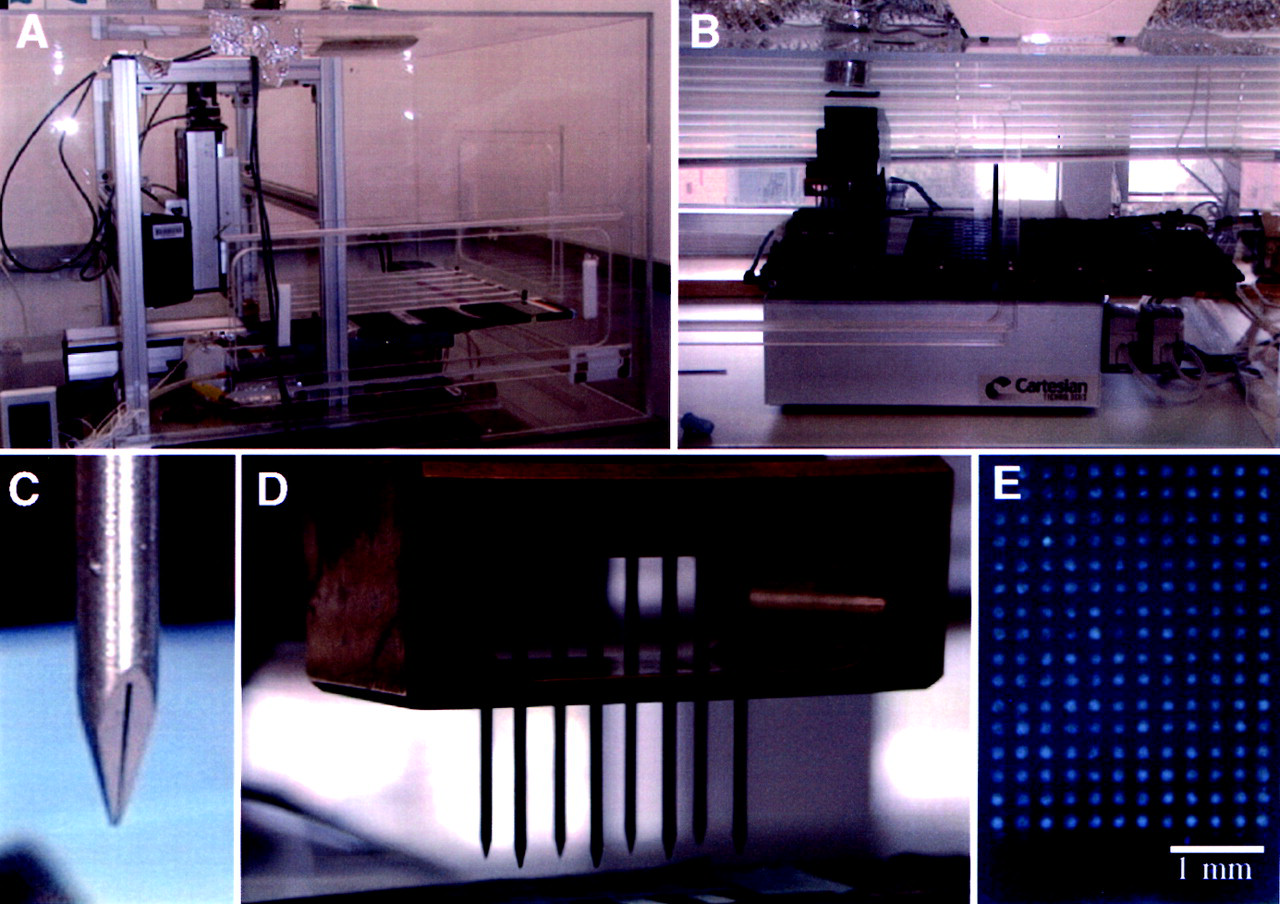
Computer-controlled custom-built
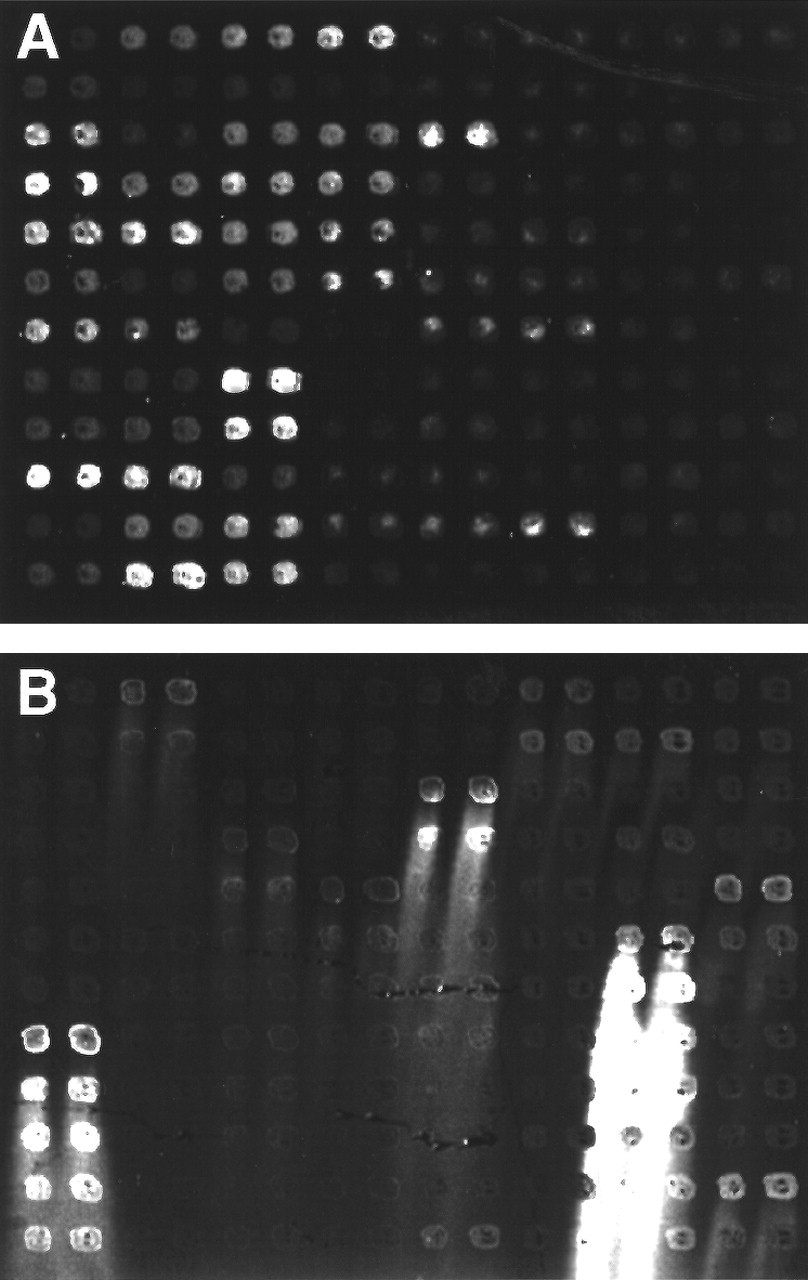
cDNA microarrays following hybridization.
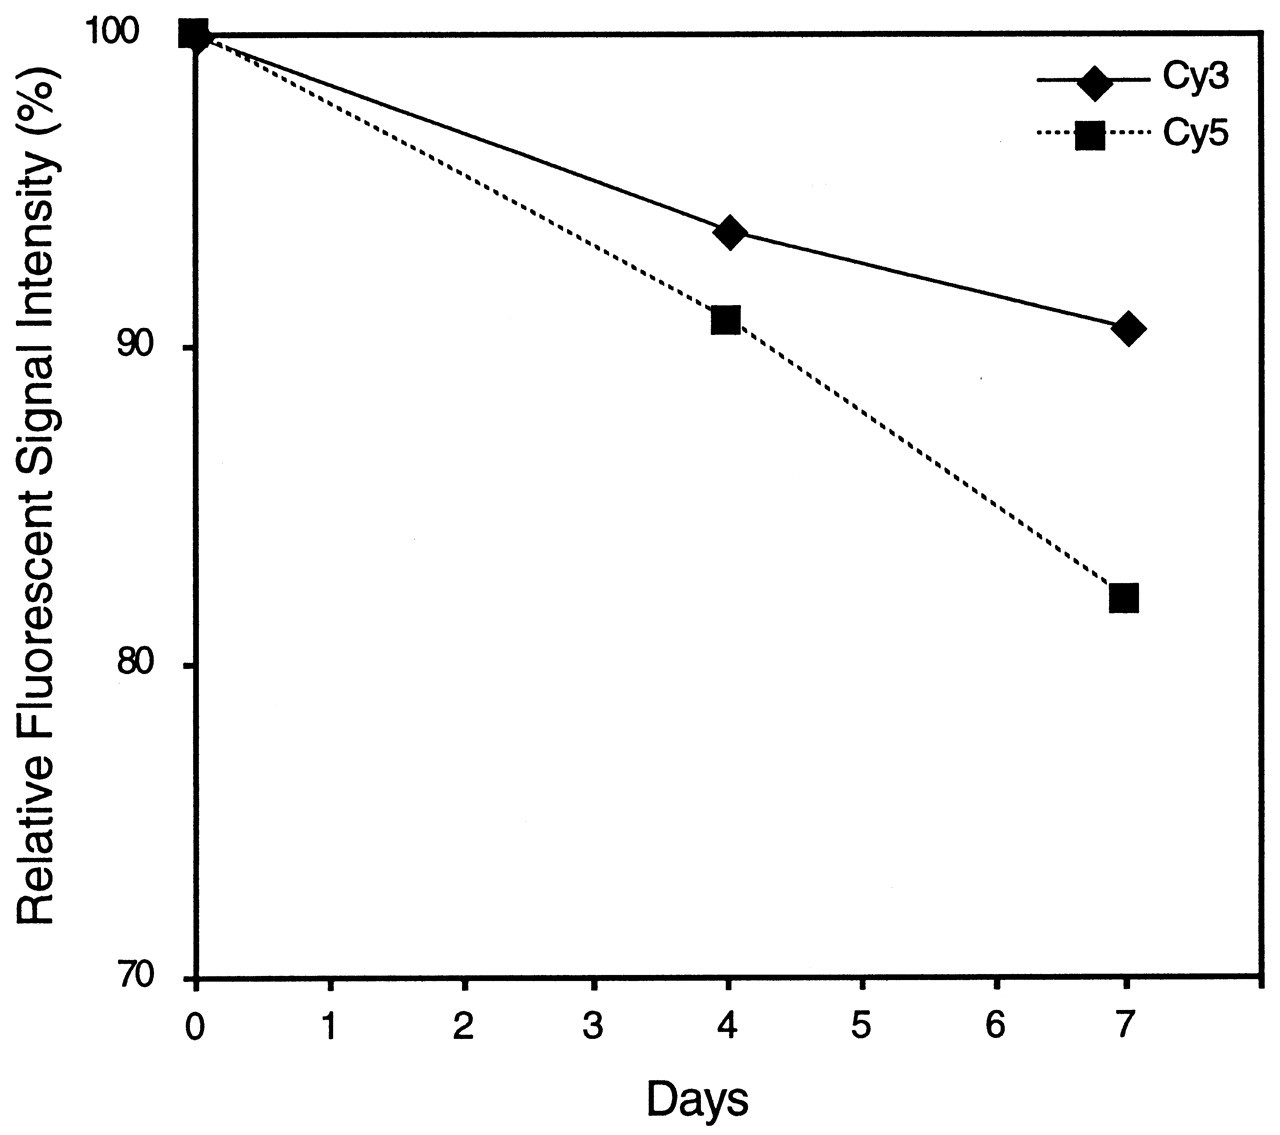
Hybridized fluorescent signal intensities vs. time. The decrease in the fluorescent signal intensities of the Cy dyes over time is demonstrated in both dyes. Although the intensities immediately after the hybridization and washing are the same levels for both Cy dyes, those at day 7 show different intensity due to a faster reduction of signal intensity in Cy5.
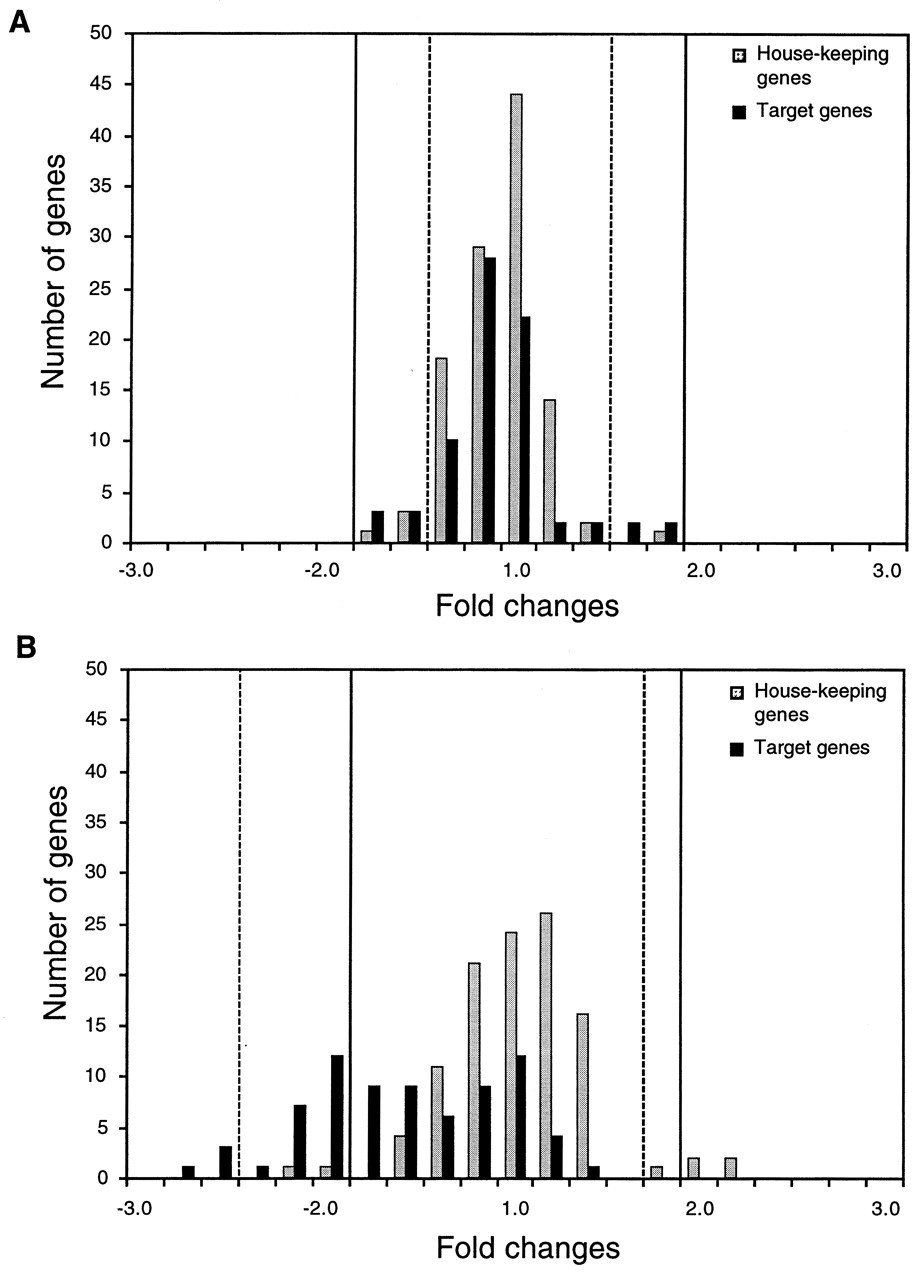
Histograms representing the distributions of Cy3/Cy5 ratios. Continuous lines and interrupted lines indicate ± two-fold changes and 99% CIs, respectively.
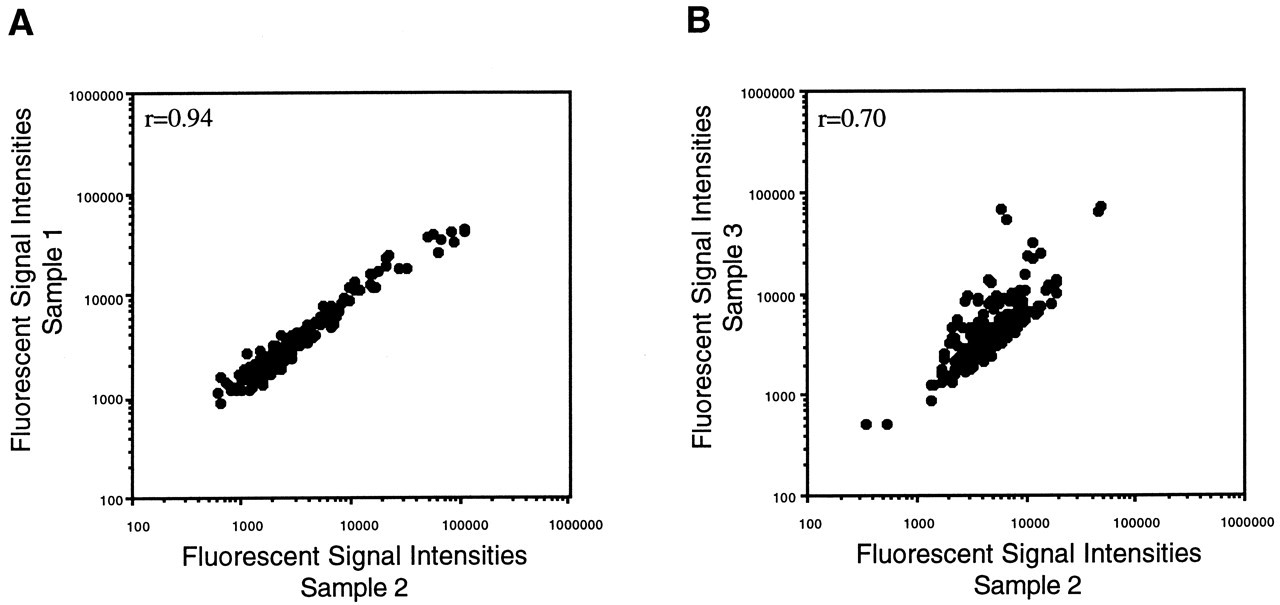
A scatter plot showing the results of comparative hybridization with the microarrays constructed with 96 duplicated housekeeping genes.
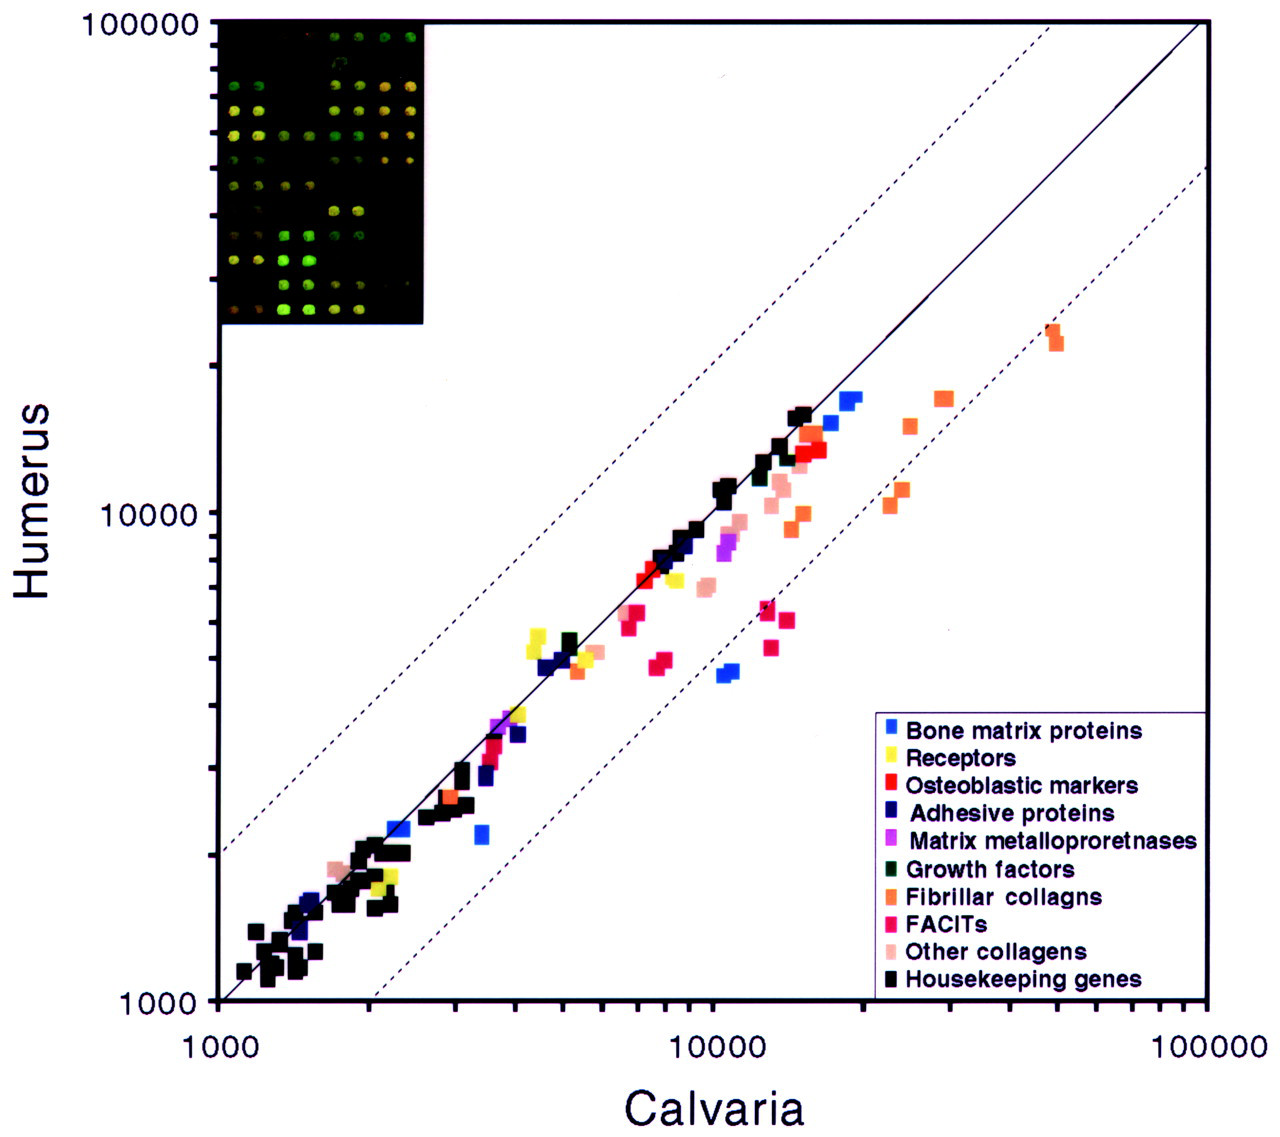
A scatter plot comparing the expression ratios between mouse humerus and calvaria bones. Elevated gene expressions (> two-fold) of col1a1, col1a2, col9a1, col19a1, and osteonectin are found in calvaria compared with humerus.
Footnotes
Acknowledgements
The authors thank Dr. Stanley F. Nelson, UCLA Microarray Core, for various suggestions on this technology, and Dr. Sharon Hunt Gerardo for editorial assistance with this manuscript. Drs. Takahiro Ogawa and Cortino Sukotjo, UCLA School of Dentistry, The Jane and Jerry Weintraub Center for Reconstructive Biotechnology, have significantly contributed to the establishment of the microarray system in our laboratory. We also thank Drs. Joseph Zernik and Harold Slavkin of the University of Southern California and Dr. Edward Shillitoe of the State University of New York at Syracuse for constructive discussion of this manuscript. This project is supported, in part, by Sumitomo Chemical, Co., Ltd. Tokyo, Japan.