
Abstract
An extensive body of research suggests that youth of color are more likely to experience an arrest than their White counterparts. Theoretically, these findings have been understood, at least in part, as the result of the differential deployment of law enforcement to areas with higher Black and Hispanic concentrations as well as stereotyped attributions of dangerousness and threat implicitly assigned to these suspects by police before and during encounters. However, previous studies typically have employed conventional racial/ethnic categorizations, which might obscure potential nuances in arrest disparities across subgroups. Using data on a statewide representative sample of adolescents from the 2018 Florida Youth Substance Abuse Survey (N = 54,611), these analyses reveal that the likelihood of a self-reported arrest is greatest among Haitian, West Indian/Caribbean, Dominican, and non-Hispanic Black youth. Further, Mexican and Puerto Rican adolescents have a higher risk of experiencing an arrest than members of other Hispanic subgroups.
Formal contact with the police can represent a crucially important turning point in the lives of youth, and a vast body of scholarship has documented a wide range of short- and long-term negative outcomes stemming from being arrested. For instance, research has demonstrated that adolescents who experience an arrest, even if no charges are filed, frequently have diminished educational opportunities (Sweeten, 2006; Widdowson et al., 2016) and occupational success (Bushway, 1998; Kirk & Sampson, 2013; Uggen et al., 2014), especially in the digital age where criminal records are particularly accessible and “sticky” (Lageson, 2016). Arrest also has been shown to have a labeling effect, increasing the risk of subsequent offending regardless of whether youth are adjudicated or convicted (e.g., Bernburg & Krohn, 2003; Liberman et al., 2014; Wiley et al., 2013). More generally, the stigma associated with a negative police encounter can be detrimental for youths’ self-identity, mental health, and emotional well-being (Jackson et al., 2019; Moore et al., 2016; Sugie & Turney, 2017), ultimately structuring their daily interactions with people and institutions (Brayne, 2014; Stuart, 2016).
The likelihood of experiencing justice system contact is not equal across racial and ethnic groups, and several decades of research have revealed that Black and Hispanic youth are more likely than Whites to be arrested (for reviews, see Kochel et al., 2011; Lytle, 2014; Mitchell & Caudy, 2015; Smith et al., 2017). Theoretical accounts of these disparities often draw upon the conflict perspective, which posits that mechanisms of social control are mobilized to protect and reinforce existing power relations by suppressing segments of the population presumed to threaten the status quo (Black, 1976; Chambliss & Seidman, 1971; Turk, 1969). Using this framework, scholars have proposed that inequalities in arrest may stem from the differential deployment of police resources to areas with larger populations of color (Beckett et al., 2006; Engel et al., 2012; Gaston, 2019) as well as the use of more aggressive tactics in those contexts (Terrill & Reisig, 2003). Further, the decision-making of individual officers also may be influenced by social conditioning and implicit bias, as unconscious beliefs, attitudes, and stereotypes might link suspects’ minority status with attributions of dangerousness, hostility, and violence (Russell-Brown, 2009; Smith & Alpert, 2007).
Although this body of research has provided important insights, two key limitations exist. First, disparities in arrest frequently have been assessed using administrative data collected on traffic stops and other police encounters, with researchers examining the extent to which the suspects’ race/ethnicity affects arrest decisions after accounting for situational factors, offense type, suspect criminal record, victim preferences and attributes, and various characteristics of officers and police departments (e.g., Ridgeway, 2006; Schafer et al., 2006; Stolzenberg et al., 2021; Tillyer & Engel, 2013). However, such data include no information about criminal activity that is not observed or recorded by law enforcement. Indeed, while a police-suspect encounter of some kind must occur prior to an arrest, these interactions are themselves tied to processes that make contact with individuals of color more likely (Thacher, 2011; Warren et al., 2006). In contrast, self-report survey data are not dependent on these potential sources of bias, though relatively few studies on race/ethnicity and arrest have used this approach (Barnes et al., 2015; Brame et al., 2014; Mitchell & Caudy, 2017; Tapia, 2010, 2011).
A second limitation concerns the measurement of individuals’ racial/ethnic identities. Many scholars contend that traditional, monolithic conceptions of race and ethnicity do not accurately capture the increasingly fluid and pluralistic demographic landscape of the U.S., especially in light of recent immigration from Latin America and the Caribbean (Bonilla-Silva, 2018; Khanna, 2012; Lee & Bean, 2007). Specifically, broad classifications of people as “Black” or “Hispanic” fail to account for nuances in ancestry, heritage, and national origin, ultimately producing simplistic constructions of racial/ethnic identity that overlook notable intra-group diversity (Jiménez et al., 2015; Morning, 2011; Telles, 2018). While the salience of physical appearance and colorism has been emphasized in recent scholarship on a wide range of institutional social control outcomes (e.g., Chen et al., 2021; King & Johnson, 2016; Viglione et al., 2011), including police contact (Branigan et al., 2017; Finkeldey & Demuth, 2021; Monk, 2019; White, 2015), no prior study has explored possible disparities in the likelihood of arrest according to youths’ racial and ethnic subgroup identities.
To address this gap in the literature, the current study uses survey data collected on a statewide representative sample of middle and high school students in Florida (N = 54,611) to investigate the existence and extent of heterogeneity in the likelihood of a self-reported arrest across 13 racial/ethnic subgroups. Before presenting our findings, we first review the extant theory and research surrounding racial/ethnic arrest disparities, highlighting the ways in which the present analyses advance this line of inquiry. Next, we discuss theoretical considerations surrounding possible differences which might emerge in the likelihood of arrest across more precise racial/ethnic classifications, relating these expectations to the specific context of Florida. Finally, we present the research questions guiding the current study.
Background
Theoretical Accounts
Theoretical explanations of racial/ethnic inequalities in arrest typically are guided by a conflict-based understanding of justice system outcomes. According to this perspective, the law enforcement apparatus represents an instrument employed to serve the interests of privileged groups, helping to maintain existing political and economic arrangements by enacting repressive measures against subordinate groups perceived as threatening (Blalock, 1967; Chambliss & Seidman, 1971; Quinney, 1970; Turk, 1969). Relatedly, according to Black’s (1976, 1980) theory of law, the mobilization of social control is expected to vary according to the economic, cultural, and organizational status positions of the involved parties, with race/ethnicity representing a key dimension of social stratification. This unequal enforcement of the law can be manifest across multiple domains, as minorities may be at an increased risk of contact with police not only because of differential involvement in criminal activity but also due to the systematic application of police resources and the discretionary behaviors of officers during suspect encounters (Engel et al., 2002, 2012; Mitchell & Caudy, 2015).
From this theoretical foundation, two alternative mechanisms have been proposed to explain racial/ethnic arrest disparities. First, these inequalities may represent an artifact of the differential deployment of patrol officers to areas with higher concentrations of Black and Hispanic residents, as these neighborhoods are typically also characterized by concentrated disadvantage, higher rates of crime, and more frequent citizen calls for service (Beckett et al., 2006; Gaston, 2019; Tomaskovic-Devey et al., 2004). In this way, disparities in arrest are connected to structural causes beyond the decision-making of individual actors, as heightened police presence and scrutiny provide more opportunities for officers to detect criminal behavior by members of minority groups (Engel et al., 2012; Stewart et al., 2020). These systematic inequalities in police deployment complicate analyses of data on suspect encounters. Indeed, even where the probability of arrest is found to be similar for minority and White suspects following police stops (e.g., D’Alessio & Stolzenberg, 2003; Tillyer & Engel, 2013; Smith & Petrocelli, 2001), the likelihood of initial contact with the police is often higher for persons of color in the first place, thus producing disparities that are otherwise obfuscated (Thacher, 2011; Warren et al., 2006).
A second theoretical explanation for the observed patterns of racial/ethnic inequality in arrest concerns implicit bias among law enforcement officers. While differential deployment produces contexts in which police-suspect interactions can be more likely, the outcomes of these incidents ultimately depend upon the situational perceptions and judgments of individual officers (Carroll & Gonzalez, 2014; Kane, 2002; Rojek et al., 2012; Terrill & Reisig, 2003). In the U.S., stereotypes which characterize Black and Hispanic individuals as dangerous, hostile, and crime-prone have long been engrained in the public consciousness (Russell-Brown, 2009; Welch, 2007), and it is possible that officers’ decision-making can be informed by these attributions (Graham & Lowery, 2004; Kahn & Martin, 2016; Spencer et al., 2016; Swencionis & Goff, 2017). Many scholars have argued that implicit biases among law enforcement, which may be reinforced through repeated interactions (Smith & Alpert, 2007), are central for understanding the outcomes of police-suspect encounters, as inequities in arrest have been found to persist even after other incident-level factors are accounted for (e.g., Brown & Frank, 2006; Petrocelli et al., 2003; Ridgeway, 2006; Schafer et al., 2006; Sealock & Simpson, 1998; Smith & Visher, 1981).
Prior Research on Race/Ethnicity and Youth Arrest
The past several decades have seen the accumulation of a vast body of empirical work exploring the influence of extralegal factors on the likelihood of arrest among juveniles. Some early research on these issues revealed that suspect demeanor, incident- and case-related factors, and the characteristics of communities, officers, and organizations were more salient than suspect race (e.g., Black & Reiss, 1970; Piliavin & Briar, 1964; Riksheim & Chermak, 1993; Sherman, 1980). However, even after accounting for potential alternative sources of disparity, other research demonstrated that racial inequalities in juvenile arrest persist (e.g., Huizinga & Elliott, 1987; Smith & Visher, 1981). More recently, many additional studies have provided further evidence that youth of color are more likely than Whites to be arrested following encounters with police (e.g., Brown & Frank, 2006; Crum & Ramey, 2022; Pope & Snyder, 2003; Sealock & Simpson, 1998). While the findings from some of these studies have been mixed (D’Alessio & Stolzenberg, 2003; Skogan & Frydl, 2004; Stolzenberg et al., 2021; Tillyer & Engel, 2013), reviews of this literature generally conclude that race/ethnicity likely influences arrest outcomes (Kochel et al., 2011; Lytle, 2014; Smith et al., 2017).
Because police presence within specific ecological contexts as well as the discretionary decisions which precede police-suspect encounters are themselves the outcomes of racialized processes (Brame et al., 2012; Warren et al., 2006), several studies instead have examined self-reports of arrest among juveniles and young adults. Findings from these studies reveal robust and consistent evidence of racial/ethnic inequalities. For instance, using nationally representative data from the NLSY97, Brame and colleagues (2014) observed that nearly 30% of Black males, 26% of Hispanic males, and 22% of White males had experienced an arrest by age 18. Similarly, a study by Barnes et al. (2015) of the Add Health survey data showed that 40% of Native Americans, 38% of Blacks, and 29% of Whites had been arrested by young adulthood; however, these authors did not examine arrest prevalence among Hispanic individuals. Other studies have found that inequalities in the likelihood of a self-reported arrest are not explained by differential involvement in offending, gang membership, peer effects, school and family risk factors, socioeconomic status, and neighborhood characteristics (Andersen, 2015; Crutchfield et al., 2012; Mitchell & Caudy, 2015, 2017; Stevens & Morash, 2015; Tapia, 2010, 2011, 2015).
The Importance of Subgroup Heterogeneity
Theoretical accounts of social control outcomes have long emphasized the salience of relative group position, with scholars positing that the justice system apparatus may be mobilized in response to perceived threats posed by populations of color (Blumer, 1958; Bobo & Hutchings, 1996; Olzak, 1992). According to the group threat perspective (Blalock, 1967; Liska, 1992), members of the White majority can react to demonstrations of cultural visibility, political power, or economic viability by racial/ethnic minority groups with feelings of resentment, prejudice, and punitiveness (Kinder & Kam, 2010; Liska & Chamlin, 1984; Quillian, 1995). While traditional applications of the group threat framework in the context of the U.S. have emphasized Black-White relations, the influx of immigrants from Latin American and Caribbean countries in recent decades has initiated an expansion of the theory to explicitly incorporate these complex racial/ethnic dynamics (e.g., Stupi et al., 2016; Wang, 2012). Indeed, this rapidly evolving racial structure arguably presents a challenge to traditional notions of the U.S. as a biracial society comprised of “Whites” and “non-Whites” (Bonilla-Silva, 2018; Frank et al., 2010; Jiménez et al., 2015; Lee & Bean, 2007).
In light of these demographic developments, a growing body of literature has highlighted important nuances in the conceptualization and assessment of racial and ethnic disparities in social control outcomes. For example, some scholars contend that the U.S. now represents a loosely structured “pigmentocracy” (Telles, 2018) where social stratification is patterned largely on the basis of skin tone and racialized physical characteristics (Hunter, 2007; Uhlmann et al., 2002). This perspective emphasizes the salience of “reflected race,” where the evaluations and responses of others are more strongly influenced by easily identifiable attributes rather than subjective dimensions of racial identity such as national origin, ancestry, or self-classification (Gonlin, 2020; Khanna, 2010; Roth, 2018). Corresponding with these expectations, some research has revealed that people with darker skin and/or Afrocentric facial features are more likely to experience police stops and arrests (Branigan et al., 2017; Finkeldey & Demuth, 2021; Monk, 2019; White, 2015) as well as harsher sentences upon conviction (Blair et al., 2004; Burch, 2015; Chen et al., 2021; King & Johnson, 2016; Viglione et al., 2011).
Beyond the relevance of appearance and colorism, however, some evidence suggests that membership in specific racial/ethnic subgroups can carry unique social meanings that have implications for experiences of disadvantage (Jiménez et al., 2015). For example, prior scholarship has noted that popular conceptions of Hispanics as criminally threatening are largely directed against Mexican immigrants (e.g., Chouhy & Madero-Hernandez, 2019; Telles & Ortiz, 2008), whereas Cubans, Puerto Ricans, and some other Hispanic subgroups have been extended “model minority” status in some respects (Bonilla-Silva, 2018; Current, 2008; Loveman & Muniz, 2007). Other research likewise has revealed that culturally persistent negative stereotypes about Black Americans are less frequently and forcefully applied to Haitians, West Indians, and other Afro-Caribbean immigrants (Hamilton, 2020), with these latter groups experiencing greater advantages in education and the labor market than native-born Blacks (e.g., Grosfoguel, 2004; Ifatunji, 2017). To date, however, limited criminological work has examined disparities in the application of social control across distinct racial/ethnic subgroups (cf. Lehmann & Meldrum, 2023; Martinez, 2004), and whether such patterns of inequality exist in youths’ self-reported arrest remains an important yet unexplored line of inquiry.
The Current Study
The current study assesses possible heterogeneity in the risk of arrest across racial/ethnic subgroups using survey data on a statewide representative sample of adolescents from Florida. The Florida context is ideal for this purpose, as Florida’s status as a traditional immigrant destination, particularly over the past three decades, has distinguished the state as one of the nation’s most ethnically diverse. Recent estimates from the Bureau of Economic and Business Research (2022) indicate that Hispanics comprise nearly 27% of the state’s 21 million residents, and only 53% self-identify as White and non-Hispanic. While the Hispanic population in Florida has long been comprised of people with Cuban, Mexican, Puerto Rican, and Central and South American ancestry, Florida recently took in hundreds of thousands of Puerto Rican refugees in the wake of Hurricane Maria in 2017, with many of them ultimately settling permanently in the state (Meléndez et al., 2017; Silver, 2020). Also of note, 41% of the 4.4 million Caribbean immigrants in the U.S. and nearly 50% of migrants from Haiti live in Florida (Olsen-Medina & Batalova, 2020; Zong & Batalova, 2019), with the largest concentration located in the Miami-Fort Lauderdale-West Palm Beach area.
Analyzing data collected on public middle and high school students in this unique setting, this study examines the presence and extent of disparities in the likelihood of self-reported arrest across 13 subgroups of racial/ethnic identity. Given the multichotomous nature of this key independent variable, the selection of a meaningful reference group against which racial/ethnic contrasts should be made can pose a theoretical and empirical challenge. For instance, while research on inequalities in social control frequently uses the modal category (i.e., White/non-Hispanic) as the sole reference for all comparisons, “this convention may encourage the idea that dominant groups are ‘baseline’ and marginalized groups are deviations,” thereby implicitly reifying and reinforcing unequal power relations (Johfre & Freese, 2021, p. 254). As previously noted, much prior literature identifies non-Hispanic Black adolescents as having a particularly high risk of experiencing an arrest. Thus, examining whether this risk is greater than, similar to, or less than that of other subgroups also represents a meaningful line of inquiry.
Accordingly, this study addresses the following two research questions. Research Question 1: Are there differences in youths’ likelihood of a self-reported arrest according to their racial/ethnic subgroup identity relative to those who are White/non-Hispanic? Research Question 2: Are there disparities in youths’ likelihood of a self-reported arrest according to their racial/ethnic subgroup identity compared to youth who are Black/non-Hispanic? Distinguishing these two subgroups for purposes of comparison is informative, as prior research has identified White/non-Hispanic youth as particularly advantaged in the context of arrest and Black/non-Hispanic as having a heightened risk of experiencing an arrest.
Data and Methods
To address these research questions, this study uses data from the 2018 administration of the Florida Youth Substance Abuse Survey (FYSAS). The FYSAS is an annual cross-sectional survey of students enrolled in public middle and high schools in the state. The sampling design of the FYSAS involves two stages. In the first stage, separate groups of public middle and high schools are randomly selected from Florida counties, and all educational institutions except for adult education, correctional, vocational, and special education schools are included in the sampling frame. In 2018, the sampling frame included 932 middle schools and 523 high schools. Each school’s probability of selection is proportional to its enrollment size. Then, classrooms are randomly selected from within the schools to fulfill each school’s survey quota. Because special education and ESOL (i.e., English for speakers of other languages) classes are not included in the survey, they are also not included in the classroom selection list.
Descriptive Statistics: 2018 Florida Youth Substance Abuse Survey (FYSAS).
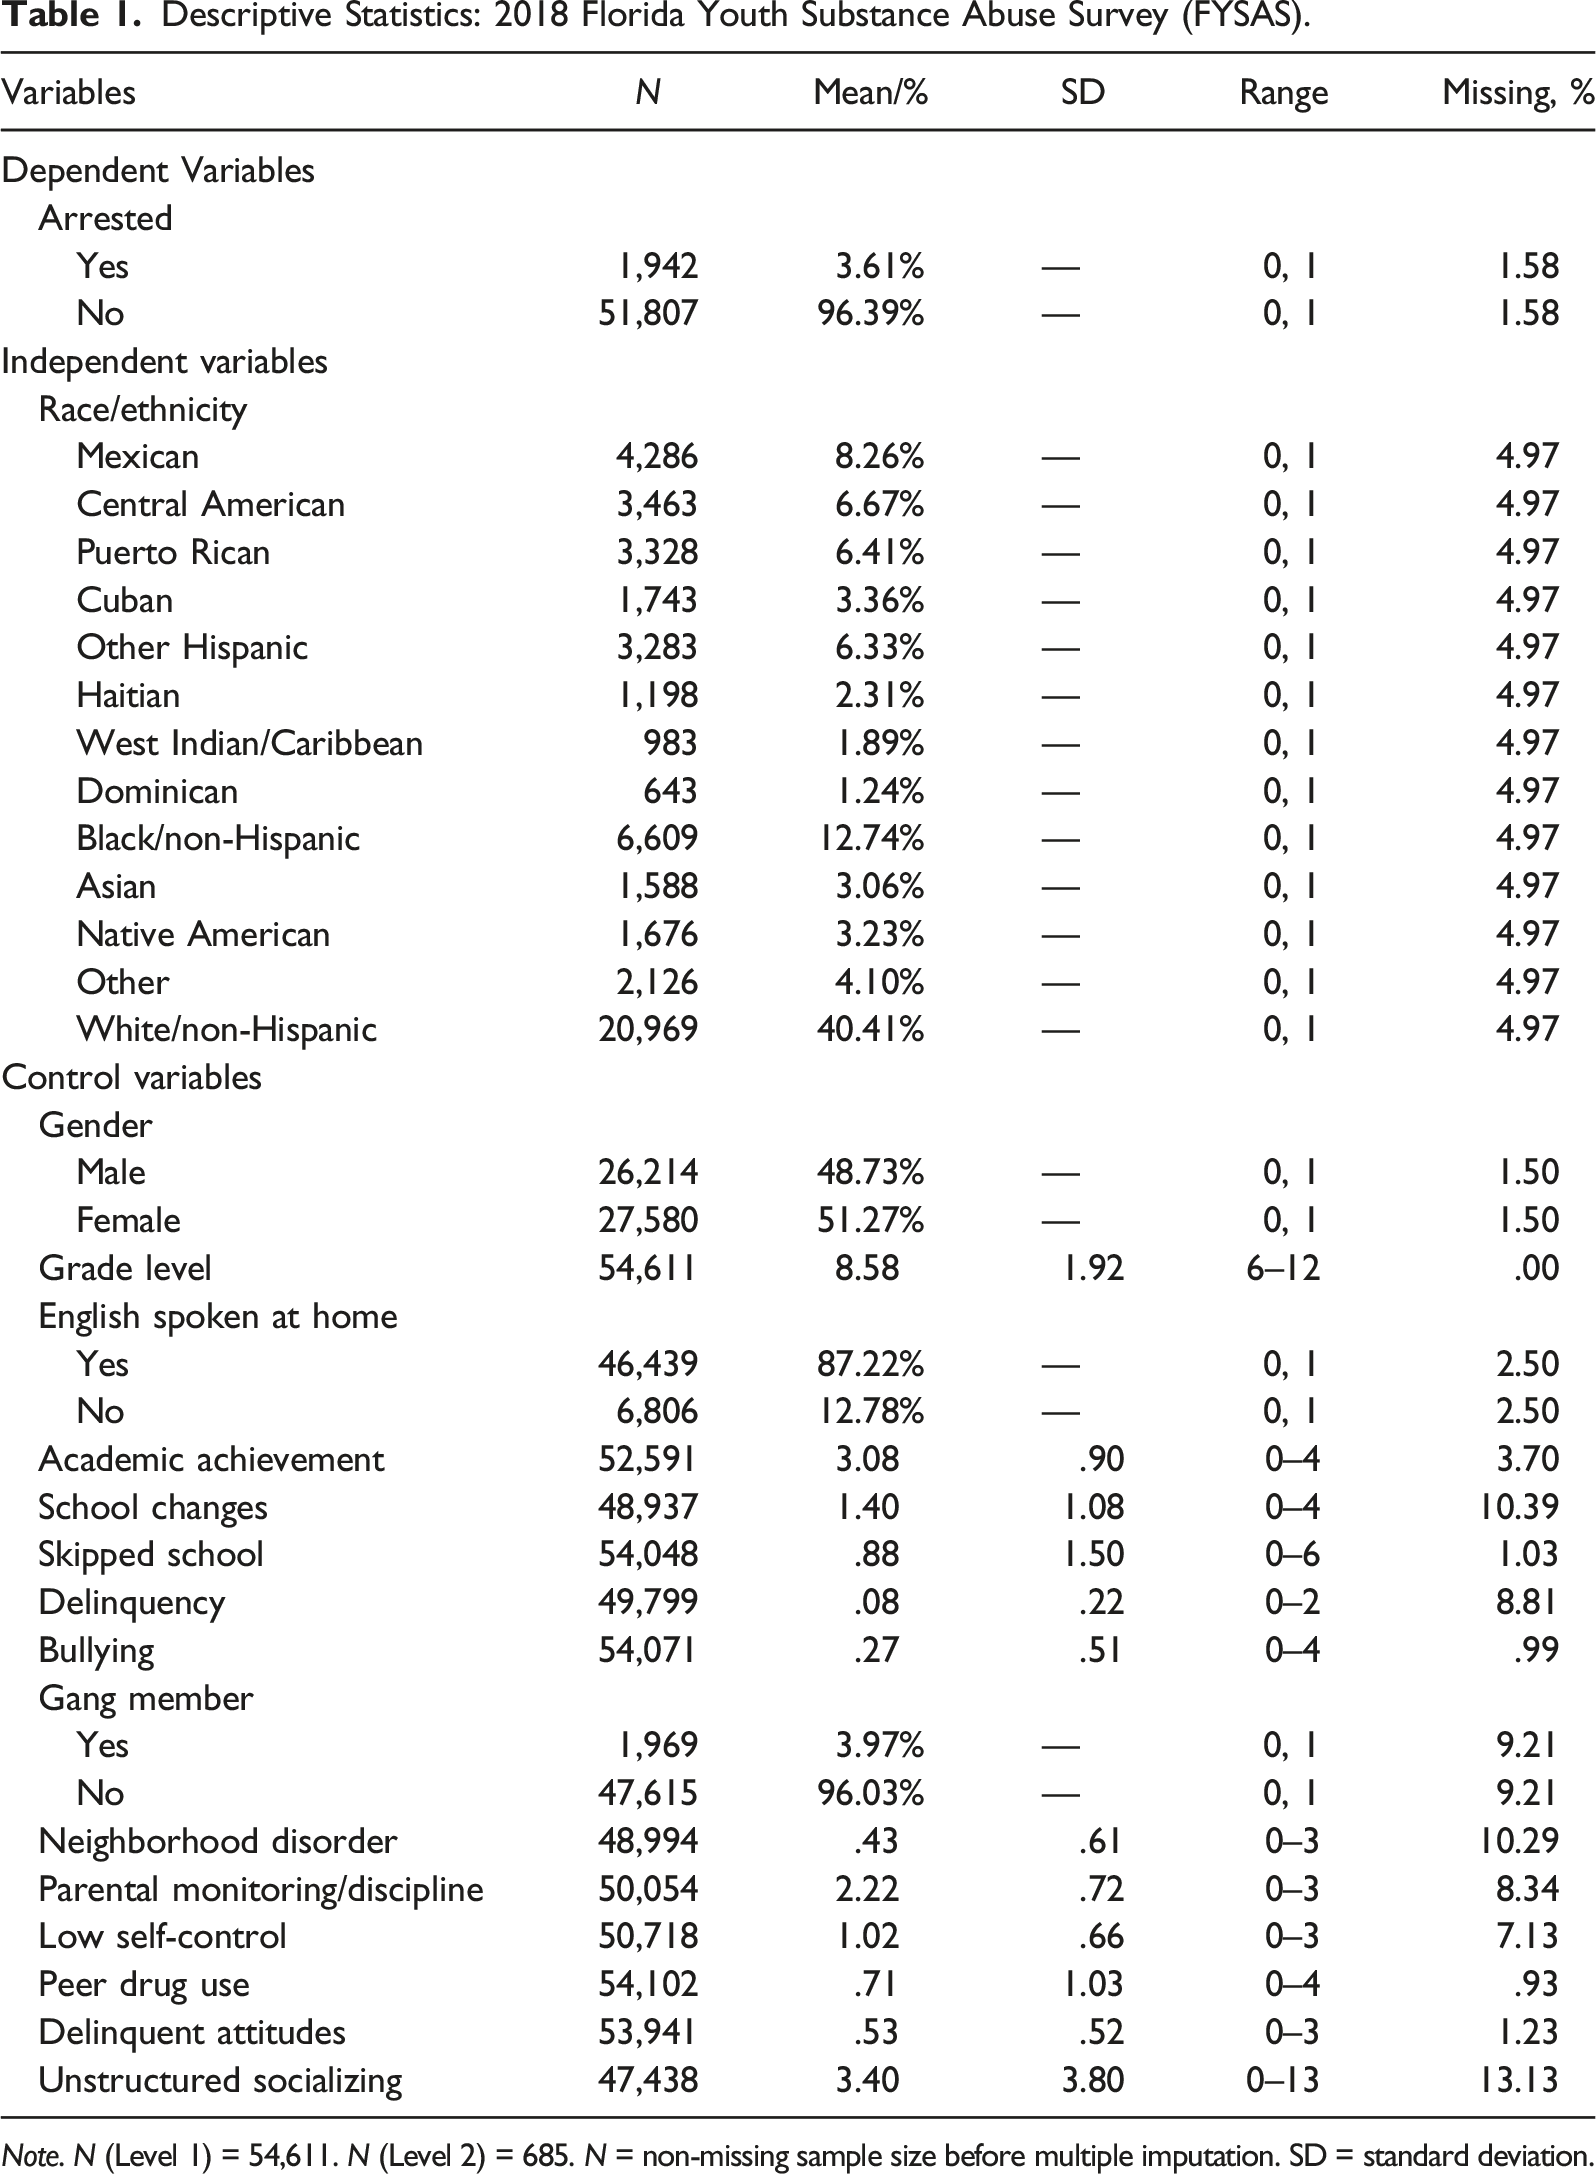
Note. N (Level 1) = 54,611. N (Level 2) = 685. N = non-missing sample size before multiple imputation. SD = standard deviation.
Dependent Variable
This study’s outcome of interest is whether youth had ever been arrested. Specifically, we use a survey item which asked, “How old were you when you were first arrested?” The response options included “Never have” as well as an ordinal scale ranging from “10 or younger” to “17 or older.” Unsurprisingly, an arrest is an uncommon experience in this statewide representative sample of youth, and 96.4% of participants indicated that they had never been arrested. For this reason, the variable was dichotomized such that youth who had been arrested at least once at any age were coded as 1, and those who reported never having been arrested were coded as 0. In this sample, 3.6% of youth (N = 1,942) had been arrested.
Independent Variables
The primary independent variable examined in this study is youths’ race or ethnicity. The FYSAS contains two separate questions capturing these characteristics, one of which asked about participants’ race and the other about their ethnic group identity. The response options for the race item included seven categories (i.e., Black/African American, Asian, Native American, Native Hawaiian or Pacific Islander, Hispanic/Latino, White/Caucasian, and Other), and youth were permitted to choose more than one option if applicable. The ethnic identity item prompted participants to indicate which of nine options best describes them (i.e., Mexican, Central American, Puerto Rican, Cuban, Other Hispanic, Haitian, West Indian/Caribbean, Dominican, and None of these), and they were instructed to select only one response.
For this study, these two measures were combined to form a single, comprehensive race/ethnicity variable. First, we used the responses from the ethnic group item to identify participants who identified as Mexican (8.3%), Central American (6.7%), Puerto Rican (6.4%), Cuban (3.4%), Haitian (2.3%), West Indian/Caribbean (1.9%), and Dominican (1.2%). Next, youth who self-identified as “Other Hispanic” on the ethnicity item or who indicated via the race question that they were “Hispanic/Latino” yet did not select any of the above classifications were coded as Other Hispanic (6.3%). Then, among participants who answered “None of these” to the ethnicity question, the conventional race measure was used to distinguish the three categories of Black/non-Hispanic (12.7%), Asian (3.1%), and Native American (3.2%), the latter of which also included a small number of Native Hawaiian/Pacific Islander youth. To ensure that the categories are mutually exclusive, hierarchy rules were used such that if “Black/African American” was selected along with any additional options besides Hispanic/Latino (along with “None of these” on the ethnic identity item), the participant was coded as Black/non-Hispanic. Next, Asians were coded as non-Hispanic and non-Black, and Native Americans were then identified as non-Hispanic, non-Black, and non-Asian.
The category of Other (4.1%) included those who self-identified as “Other” on the race item and also indicated “None of these” on the ethnicity question. Finally, White/non-Hispanic (40.4%) youth were coded as such if they selected only “White/Caucasian” on the race item and “None of these” on the ethnic identity measure. Thus, the final measure includes 13 mutually exclusive categories. 3 As the two research questions suggest, White/non-Hispanic and Black/non-Hispanic are treated as the reference groups.
Presented in Table A1 of Appendix A are the descriptive statistics of the study variables disaggregated by arrest status. Of note, while an arrest experience is a relatively rare occurrence in these data, the subsample of youth who reported having been arrested is sufficiently large to permit the use of the race/ethnicity measure described above. Additionally, there are statistically significant differences between the proportions of arrested youth and non-arrested youth who are Puerto Rican (1.7%, p < .01), Haitian (2.0%, p < .001), West Indian/Caribbean (1.2%, p < .001), Dominican (.7%, p < .01), Black/non-Hispanic (6.7%, p < .001), and Other (1.0%, p < .05). Further, there are proportionately fewer youth who have ever been arrested who identify as White (−10.6%, p < .001) and Asian (−2.1%, p < .001) than those who have never been arrested.
Control Variables
These analyses consider several key control variables. First, gender is measured dichotomously with male respondents coded as 1. Grade level is an ordinal variable ranging from sixth grade (= 6) to 12th grade (= 12). 4 A dichotomous indicator of whether English is spoken at home (= 1) is also included. To capture academic achievement, we make use of a survey item which asked, “Putting them all together, what were your grades like last year?” (“Mostly Fs” = 0, “Mostly As” = 4). School changes represent the number of times the participant reported changing schools since kindergarten (“Never” = 0, “7 or more times” = 4). Another control variable captures how often each respondent skipped school: “During the last 4 weeks, how many whole days have you missed [at school] because you skipped or ‘cut’?” The response options for this item ranged from “None” (= 0) to “11 or more” (= 6).
Additionally, the analyses include a seven-item index of delinquency. The questionnaire asked participants, “How many times in the past 12 months have you: (1) carried a handgun? (2) sold illegal drugs? (3) stolen or tried to steal a motor vehicle such as a car or motorcycle? (4) been arrested? (5) attacked someone with the idea of seriously hurting them? (6) drunk alcohol before or during school? (7) smoked marijuana before or during school?” For each of the seven items, the response options were coded as follows: “Never” (= 0), “1 or 2 times” (= 1), and “3 or more times” (= 2). An index was created by taking the average of the responses (α = .73). Next, we control for a three-item measure of bullying that captures the frequency of (1) physical, (2) verbal, and (3) cyber-bullying committed against others (“Never” = 0, “Every day” = 4). The responses to the three items were averaged together (α = .68). We also include a dichotomous indicator of whether the respondent reported ever having been a gang member (“Yes” = 1).
Beyond involvement in delinquent and criminal behavior, we control for several key theoretical correlates of offending and justice system contact. A measure of neighborhood disorder is constructed as the average (α = .83) of responses to four questions: “How much do each of the following statements describe your neighborhood? (1) crime and/or drug selling, (2) fights, (3) lots of empty or abandoned buildings, and (4) lots of graffiti.” For each of these four items, the response options were “NO!” (= 0), “no” (= 1), “yes” (= 2), and “YES!” (= 3). Also included is an index of parental monitoring/discipline, which is the average (α = .86) of responses to seven statements about parental rules and the likelihood of being caught by parents engaging in certain delinquent acts (“NO!” = 0, “no” = 1, “yes” = 2, “YES!” = 3). To account for criminal propensity, a six-item index (α = .79) of low self-control was created. The items originated from the Grasmick et al. (1993) self-control scale, with two items capturing impulsivity, two items reflecting risk-seeking, and two items measuring anger. The response options for each of the six items ranged from “Strongly disagree” (= 0) to “Strongly agree” (= 3).
Peer drug use was constructed using the average of three items (α = .76) asking respondents to report how many of their four closest friends have (1) drunk alcohol, (2) smoked cigarettes, and (3) used marijuana within the past 12 months (“None” = 0, to “4” = 4). The extent to which participants hold delinquent attitudes is measured using an index of 10 items (α = .86) which ask participants how wrong they think it is for someone their age to engage in theft, fighting, truancy, substance use, and various other delinquent activities (“Very wrong” = 0, “Not wrong at all” = 3). Finally, a control for unstructured socializing captures responses to the question, “How many hours per week do you spend hanging out with friends, not doing anything particular, where no adults are present?” Response options reflected two-hour increments and ranged from “0 hours” (= 0) to “More than 24 hours” (= 13). 5
Analytic Strategy
All analyses for this study were conducted using Stata 17.0. Regarding the missing data, Little’s (1988) test was conducted and revealed that the data are not missing completely at random (MCAR). Accordingly, the missing data were imputed using multiple imputation by chained equations (White et al., 2011). The imputation model included all of the analytic variables, and 30 datasets were imputed. Following the imputation, cases with data missing on the dependent variable were removed prior to the analyses, thus producing a final analytic sample of 53,749 observations nested within the 685 schools.
Due to the hierarchical structure of the data, the present study employs a multilevel analytic strategy. We began by estimating an unconditional model (not displayed), which showed that there is indeed statistically significant between-school variation in arrest (χ2 = 147.30, p < .001). 6 Thus, the analyses use multilevel logistic regression to estimate the effects of membership in each of the 13 racial/ethnic subgroups on the likelihood of having experienced an arrest. As anticipated by the research questions, two sets of models are presented: the first with White/non-Hispanic treated as the reference and the second with Black/non-Hispanic as the reference.
Because the outcome measure captures any lifetime arrest experience, the inclusion of control variables using items with ambiguous or proximate recall periods (e.g., past 4 weeks, past 12 months) may pose issues of temporal order. In addition, it has been argued that the inclusion of controls which capture characteristics or experiences that are highly correlated with race and ethnicity may not lessen bias in the estimates of race/ethnicity effects. On the contrary, researchers commonly attempt to “separate racially structured patterns from racial structures, in effect ‘controlling for’ supposed non-racial factors and diminishing the impact of racism” (Bonilla-Silva & Baiocchi, 2001, p. 126) and in so doing estimate effects of race/ethnicity that are inappropriately reduced (Bonilla-Silva, 2018; VanderWeele & Robinson, 2014). In light of these considerations, we begin by examining the “total effects” of race/ethnicity on arrest using multilevel logistic regression models of arrest without any of the covariates. Then, we present the findings from the full models that include the complete list of control variables.
To enhance interpretability and simplify between-group comparisons, the regression coefficients are used to calculate the average adjusted predictions (AAPs), which provide the average conditional probabilities of arrest according to each of the 13 racial/ethnic categories. 7 Then, these AAPs are used to estimate the average marginal effects (AMEs), and the absolute and proportional differences in the probability of arrest for each focal category in contrast to the identified reference group are presented (Long & Freese, 2014; Williams, 2012).
Results
Regression Analyses
Multilevel Logistic Regression of Arrest: White/Non-Hispanic and Black/Non-Hispanic Contrasts.
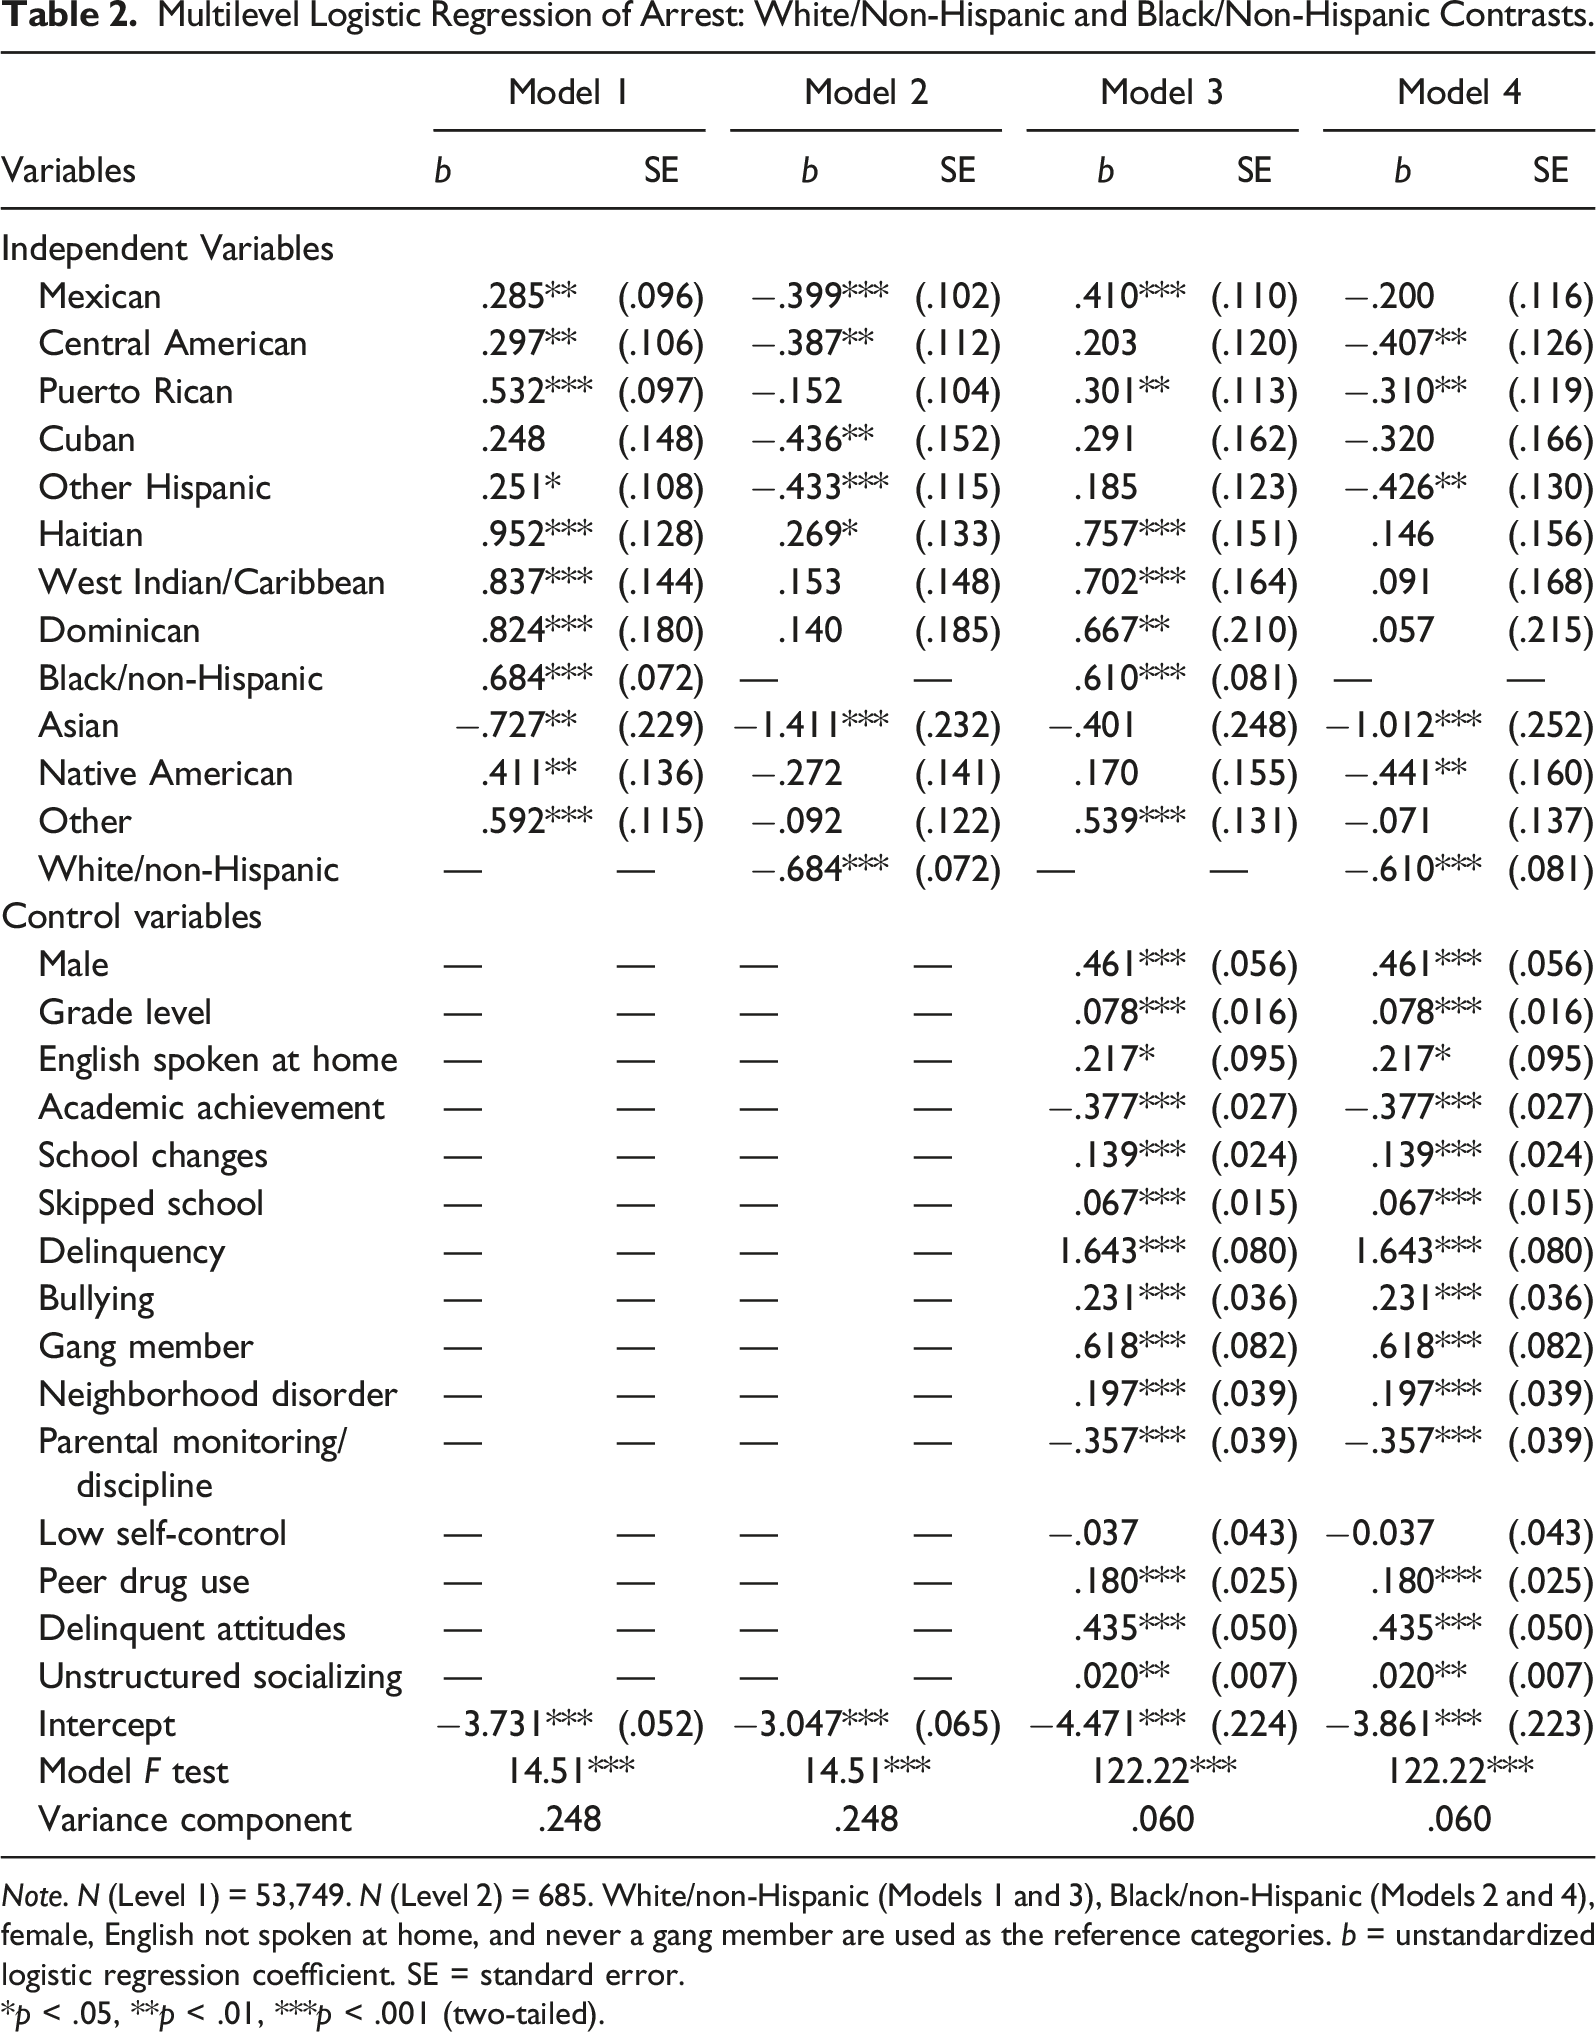
Note. N (Level 1) = 53,749. N (Level 2) = 685. White/non-Hispanic (Models 1 and 3), Black/non-Hispanic (Models 2 and 4), female, English not spoken at home, and never a gang member are used as the reference categories. b = unstandardized logistic regression coefficient. SE = standard error.
*p < .05, **p < .01, ***p < .001 (two-tailed).
The next stage of the analyses involves estimating the effects of racial/ethnic subgroup membership on the likelihood of arrest net of the full list of controls. As shown in Model 3 of Table 2, which again treats White/non-Hispanic as the reference category, positive and statistically significant effects emerge for seven of the 12 subgroups. Specifically, among Hispanic youth, disparities in arrest are observed only among those who identify as Mexican (b = .410, p < .001) or Puerto Rican (b = .301, p < .01). However, as in the bivariate analyses, particularly noteworthy positive effects also are observed for Haitian (b = .757, p < .001), West Indian/Caribbean (b = .702, p < .001), Dominican (b = .667, p < .01), and Black/non-Hispanic youth (b = .610, p < .001). Adolescents who belong to the “Other” subgroup are likewise more likely to have been arrested than White respondents (b = .539, p < .001). Central American, Cuban, Other Hispanic, Asian, and Native American adolescents are found to have a statistically similar arrest risk to that of their non-Hispanic White counterparts.
Presented in Model 4 of Table 2 is the fully specified regression model identical to that in Model 3 but with Black/non-Hispanic used as the reference group for the race/ethnicity measure. These results show that non-Hispanic Black individuals have a higher likelihood of arrest than those belonging to several Hispanic subgroups, including Central Americans (b = −.407, p < .01), Puerto Ricans (b = −.310, p < .01), and Other Hispanics (b = −.426, p < .01). Further, as previously suggested, Black/non-Hispanic adolescents are more likely to experience an arrest than youth who self-identify as Asian (b = −1.012, p < .001), Native American (b = −.441, p < .01), and White/non-Hispanic (b = −.610, p < .001); the negative effect associated with being Cuban approaches statistical significance (b = −.320, p = .055). Notably, the model also indicates that youth who are Haitian, West Indian/Caribbean, Dominican, and Mexican are not statistically significantly more likely to be arrested than non-Hispanic Black youth. 8
Adjusted Predictions and Marginal Effects
To enhance the interpretability of the relationships of interest, we use the coefficients from the full regression models described above to generate the average adjusted predictions (AAPs) of an arrest for each of the racial/ethnic subgroups. Accordingly, as shown in Figure 1, Haitian youth have the highest predicted probability of arrest (5.2%), followed by West Indian/Caribbean (5.0%), Dominican (4.9%), and non-Hispanic Black individuals (4.7%). Among the five Hispanic subgroups, the highest probabilities of arrest are observed for Mexican (4.0%) and Puerto Rican (3.7%) youth. Those with the lowest adjusted probability of arrest include Asians (2.1%), White/non-Hispanics (2.9%), and Native Americans (3.3%). Average Adjusted Predictions (AAPs) of Arrest by Race/Ethnicity.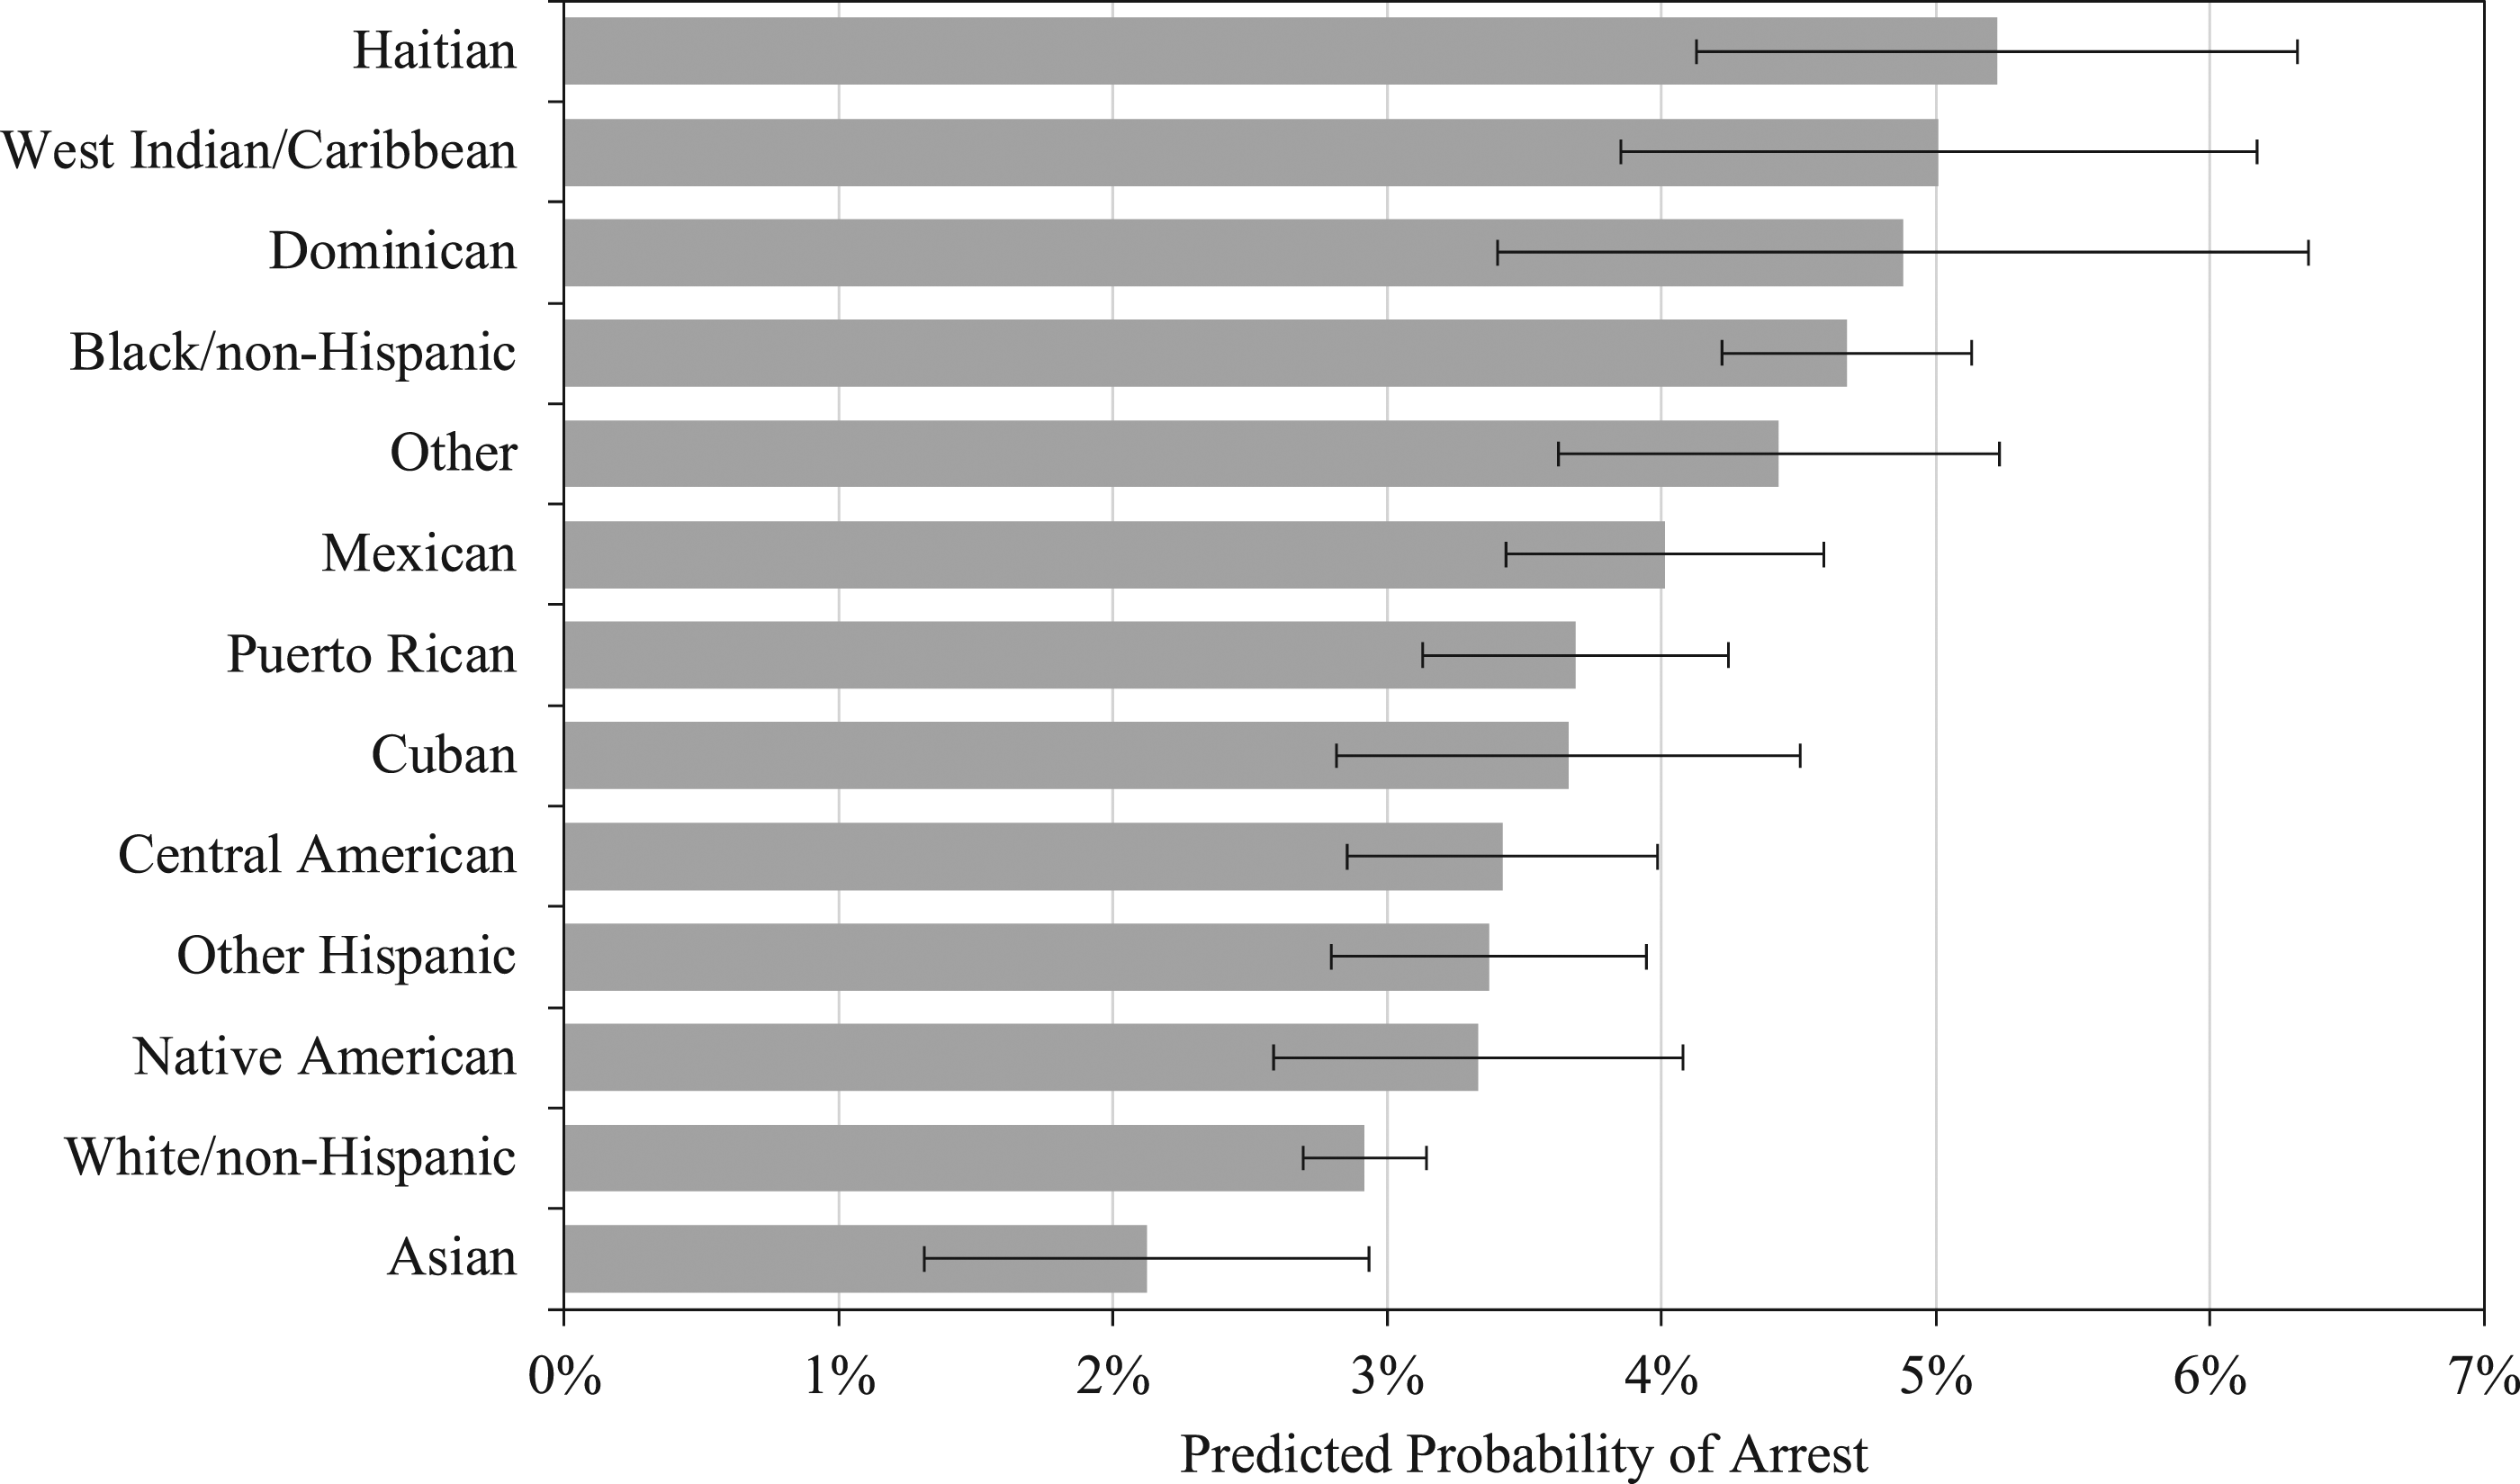
Average Marginal Effects (AMEs) of Race/Ethnicity on Arrest: White/Non-Hispanic and Black/Non-Hispanic Contrasts.
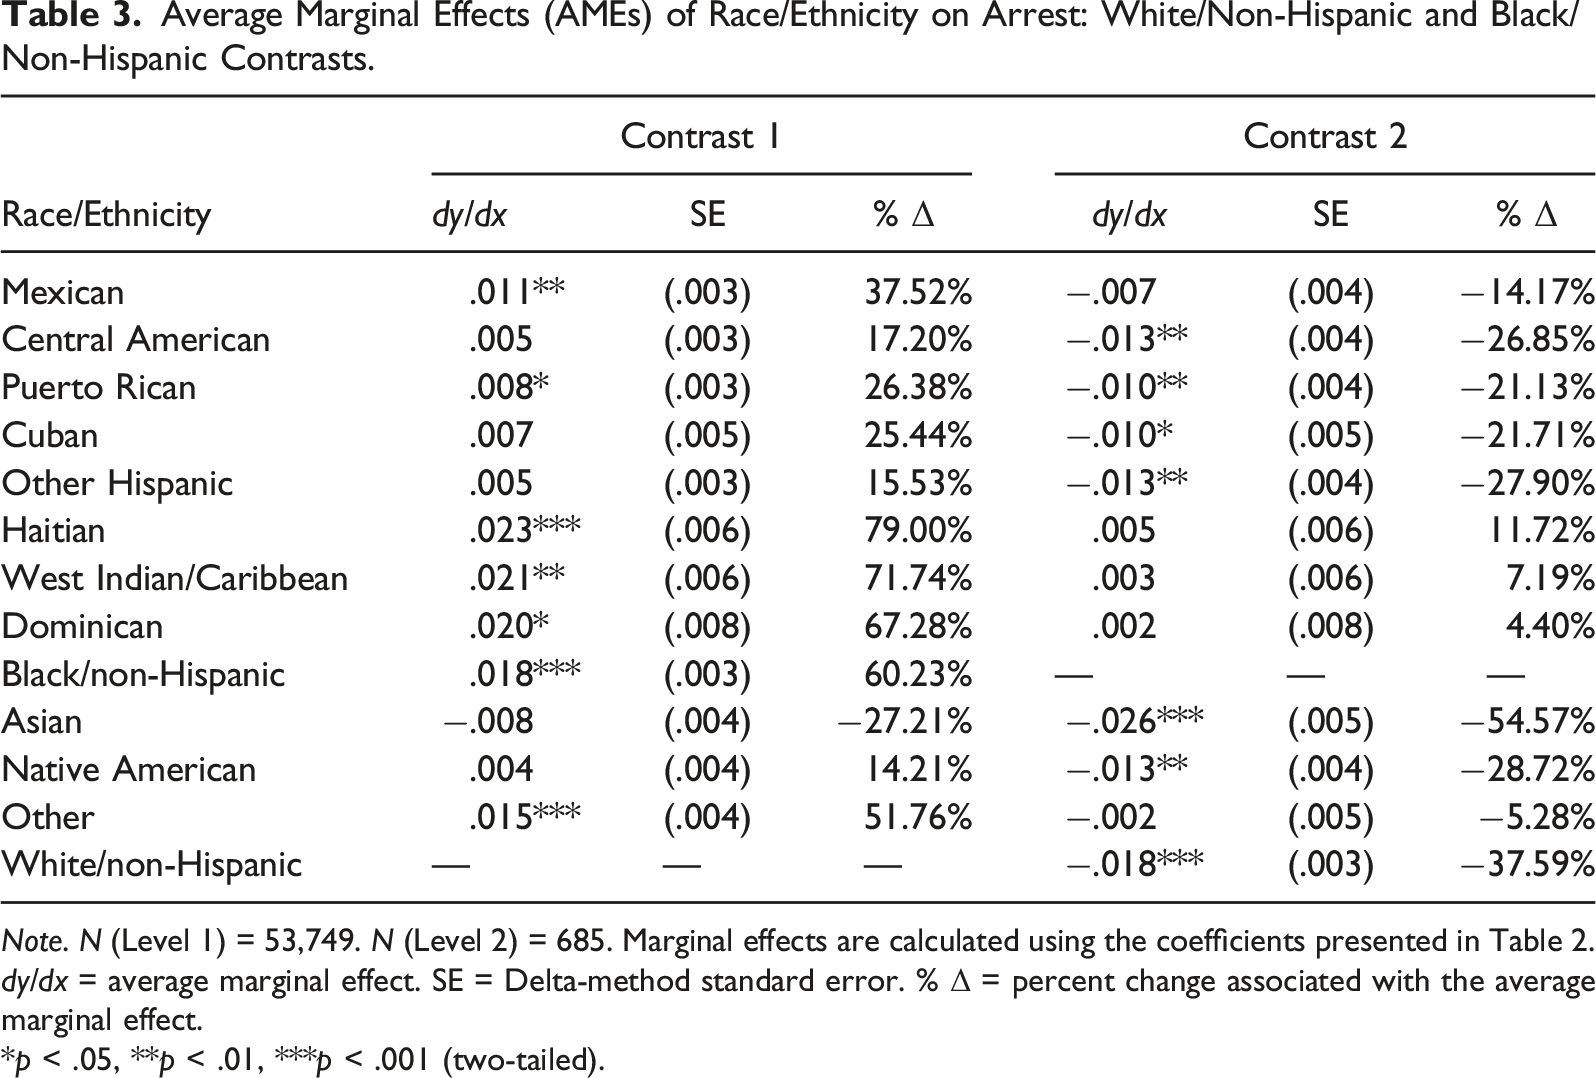
Note. N (Level 1) = 53,749. N (Level 2) = 685. Marginal effects are calculated using the coefficients presented in Table 2. dy/dx = average marginal effect. SE = Delta-method standard error. % Δ = percent change associated with the average marginal effect.
*p < .05, **p < .01, ***p < .001 (two-tailed).
Contrast 2 in Table 3, which uses Black/non-Hispanic as the reference category, reveals that the statistically non-significant AMEs associated with being Haitian, West Indian/Caribbean, and Dominican are substantively small, as each of the differences between the AAPs is less than a percentage point. However, except for the effects associated with the Mexican and “Other” subgroups, all remaining AMEs are statistically significant. Specifically, Puerto Rican youth have a predicted probability of arrest that is 21.1% lower than that of Black/non-Hispanic youth (dy/dx = −.010), while Asians have a probability of arrest that is 54.6% lower than the probability among non-Hispanic Black youth (dy/dx = −.026).
Discussion and Conclusion
Prior scholarship has identified a myriad of negative consequences associated with police contact and arrest for juveniles, even in the absence of formal court adjudication (Bernburg & Krohn, 2003; Brayne, 2014; Jackson et al., 2019; Kirk & Sampson, 2013; Widdowson et al., 2016). However, the probability of experiencing an arrest is not equal across racial/ethnic groups, and decades of research examining police-suspect encounters have revealed that Black and Hispanic youth are more likely than Whites to be arrested (e.g., Brown & Frank, 2006; Crum & Ramey, 2022; Petrocelli et al., 2003; Ridgeway, 2006; Smith & Visher, 1981). Because analyses of administrative records collected on police stops may obscure disparities in arrest, some research instead has investigated these relationships using self-report survey data (e.g., Barnes et al., 2015; Stevens & Morash, 2015; Tapia, 2010, 2011). Advancing this line of inquiry, the present study used data on a large sample of students enrolled in Florida middle and high schools to assess potential heterogeneity in the likelihood of arrest across 13 distinct racial and ethnic identities. Several key findings emerged from our analyses.
Although less than 4% of all adolescents in this sample reported having ever been arrested, the unadjusted and regression-adjusted estimates revealed noteworthy disparities in self-reported arrest relative to non-Hispanic White youth—the subgroup with the second-lowest probability of this outcome. Specifically, youth who self-identified as Haitian, West Indian/Caribbean, Dominican, or Black/non-Hispanic were found to have predicted probabilities of arrest that were between 1.8 and 2.3 percentage points, or between 60% and 80%, greater than that of White/non-Hispanic adolescents. Likewise, youth categorized as Other/non-Hispanic had a more than 50% greater probability of arrest than their non-Hispanic White counterparts. Among the five Hispanic subgroups examined, only Mexican and Puerto Rican youth were found to have a statistically significantly higher likelihood of arrest than White/non-Hispanics, with these disparities representing increases in probability of approximately 38% and 26%, respectively. The likelihood of having been arrested for Cubans, Central Americans, Other Hispanics, Native Americans, and Asians was statistically similar to that of White youth.
To overcome the theoretical and empirical limitations associated with selecting the modal subgroup as the sole reference category for the analyses (Johfre & Freese, 2021), our second set of estimates assessed these same inequalities relative to Black/non-Hispanic adolescents. As previously noted, culturally persistent negative stereotypes surrounding dangerousness and criminal threat are commonly applied to non-Hispanic Black individuals (Russell-Brown, 2009; Smith & Alpert, 2007; Welch, 2007), and much prior research using conventional racial/ethnic classifications has identified members of this group as having a particularly high risk of arrest (e.g., Beckett et al., 2006; Brame et al., 2014; Mitchell & Caudy, 2015, 2017; Tapia, 2011). Accordingly, using this subgroup as the reference, the analyses revealed that the probability of ever having been arrested was statistically similar for Haitian, West Indian/Caribbean, Dominican, Other, and Mexican youth as for Black/non-Hispanic youth. The contrasts with the seven other subgroups were statistically significant, and the proportional decreases in the adjusted probability of arrest relative to non-Hispanic Black adolescents ranged from −21% (for Puerto Rican youth) to nearly −55% (for Asian youth).
These findings have several important theoretical implications. Though some prior scholarship has suggested that Caribbean immigrants in the U.S. are extended “model minority” status and experience various social advantages relative to native Blacks (Grosfoguel, 2004; Hamilton, 2020; Ifatunji, 2016), our results suggest that these benefits do not extend to justice system contact. On the contrary, the findings revealing statistically similar probabilities of arrest for Haitian, West Indian/Caribbean, Dominican, and non-Hispanic Black youth may be interpreted as conforming with Bonilla-Silva’s (2018) thesis that the racial hierarchy in the U.S. is evolving into a “pigmentocracy” similar to those in Latin America. Indeed, rather than reflecting nuanced distinctions between unique subgroups based on culture, heritage, or national identity, arrest experiences may be similar for all dark-skinned individuals, as “color gradations, which have always been important matters of within-group differentiation, will become more salient factors of stratification” (Bonilla-Silva, 2018, p. 185). Thus, our findings appear to align with previous work demonstrating the salience of colorism in social control outcomes, which likewise emphasizes that such experiences are most pronounced among members of the so-called “collective Black” stratum (e.g., Branigan et al., 2017; Finkeldey & Demuth, 2021; King & Johnson, 2016; Monk, 2019). 9
The results from this study also indicate that the effects of Hispanic ethnicity on arrest are not uniform, with Mexican and Puerto Rican adolescents particularly disadvantaged in this regard. These findings correspond closely with theoretical arguments regarding the cultural meanings surrounding Hispanic ethnicity in the U.S., which do vary in accordance with distinct subgroup identities. As some scholars have noted, public sentiments which characterize Latin American immigrants as politically, economically, or criminally threatening are applied most prominently to Mexicans (Inda & Dowling, 2013; Telles & Ortiz, 2008), whereas migrants from Cuba and certain other parts of Latin America are often considered “good immigrants” and deserving of “honorary White” status (Bonilla-Silva, 2018; Chouhy & Madero-Hernandez, 2019; Current, 2008). Relatedly, while some researchers note that Puerto Ricans traditionally have received similar “model minority” benefits (e.g., Loveman & Muniz, 2007), others contend that the island’s colonial history, its persistent struggles with debt, and the mass migration of refugees following Hurricane Maria have compromised Puerto Ricans’ integration into the racial structure of the mainland U.S. as “White” (Godreau & Bonilla, 2021; Silver, 2020). Understood within this framework, arrest may represent a tool of social control that is mobilized in response to a perceived emergent threat from this subgroup (Lehmann & Meldrum, 2023).
Though this study provides a noteworthy contribution to the scholarship on racial/ethnic disparities in arrest, several limitations should be noted. First, the data analyzed in this study are representative only of the uniquely diverse context of Florida, and it is possible that a different pattern of results could emerge elsewhere. Indeed, additional work is needed which replicates these analyses in other jurisdictions, including in areas with populations comprised of other racial/ethnic subgroups. Second, while the analyses account for a wide range of control variables, these data contain no information about youths’ appearance, skin tone, immigrant status, other police encounters, and the details associated with specific arrest incidents (e.g., suspect demeanor, location, origin of contact, offense type, total number of lifetime arrests, officer characteristics, etc.). Third, though we highlight differential deployment and implicit bias as potential mechanisms which might help explain the disparities observed herein, these data do not allow us to differentiate between these and other theoretical alternatives. Finally, because these data do not capture information on youth in correctional facilities and alternative schools, our findings may be subject to survivorship bias. However, the way in which this potential bias might affect the racial/ethnic disparities observed herein is theoretically ambiguous.
Despite these limitations, the current study provides informative insights regarding racial and ethnic inequalities in arrest. Though some variation across distinct identities emerged, the findings provide general support for the conflict framework and the notion that law enforcement mechanisms are applied by superordinate groups with the aim of reifying, protecting, and legitimating existing power relations (Black, 1976; Bobo & Hutchings, 1996; Chambliss & Seidman, 1971; Turk, 1969). Accordingly, given the extensive list of collateral consequences of formal justice system contact which have been documented in prior scholarship (e.g., Lageson, 2016; Liberman et al., 2014; Sugie & Turney, 2017; Sweeten, 2006; Uggen et al., 2014), these disparities may be relevant for understanding long-term patterns of social stratification. As conventional categorizations of race and ethnicity become increasingly disconnected from the rapidly evolving racial landscape of the U.S., how inequalities in social control outcomes may contribute to long-term differential patterns of disadvantage across Hispanic, Caribbean, and other subgroups should represent a priority for future inquiry.
This study has important implications for criminal justice policy. While the data used in this study are not equipped to directly test the differential deployment hypothesis, our findings nonetheless suggest that departments might regularly examine their practices to ensure that surveillance and scrutiny are not deployed in ways that disparately disadvantage communities of color. In addition, while these findings cannot be interpreted as providing proof of implicit bias in officers’ decision-making, this remains a plausible explanation for the noteworthy inequities in youths’ arrest risk observed in this study. Accordingly, efforts to reduce disproportionate minority contact among youth might involve implicit bias training aimed to reduce officers’ reliance on racialized perceptual cues (e.g., skin tone, appearance, language proficiency) to assess dangerousness or threat (Kahn & Martin, 2016; Kovera, 2019; Spencer et al., 2016). Further, given the noteworthy prevalence of school-based arrests nationally as well as in Florida specifically (see, e.g., Na & Gottfredson, 2013; Novak & De Francisco Lopes, 2022), this training also might be useful for school resource officers (SROs). Such interventions may hold promise for mitigating over-policing and preventing the initiation of the long-term negative consequences that can stem from these encounters.
Footnotes
Declaration of Conflicting Interests
The author(s) declared no potential conflicts of interest with respect to the research, authorship, and/or publication of this article.
Funding
The author(s) received no financial support for the research, authorship, and/or publication of this article.
Notes
Appendix
Descriptive Statistics of Study Variables by Arrest. Note. N = 54,611. SD = standard deviation. Statistical significance is determined using t-tests for the equality of means. *p < .05, **p < .01, ***p < .001 (two-tailed).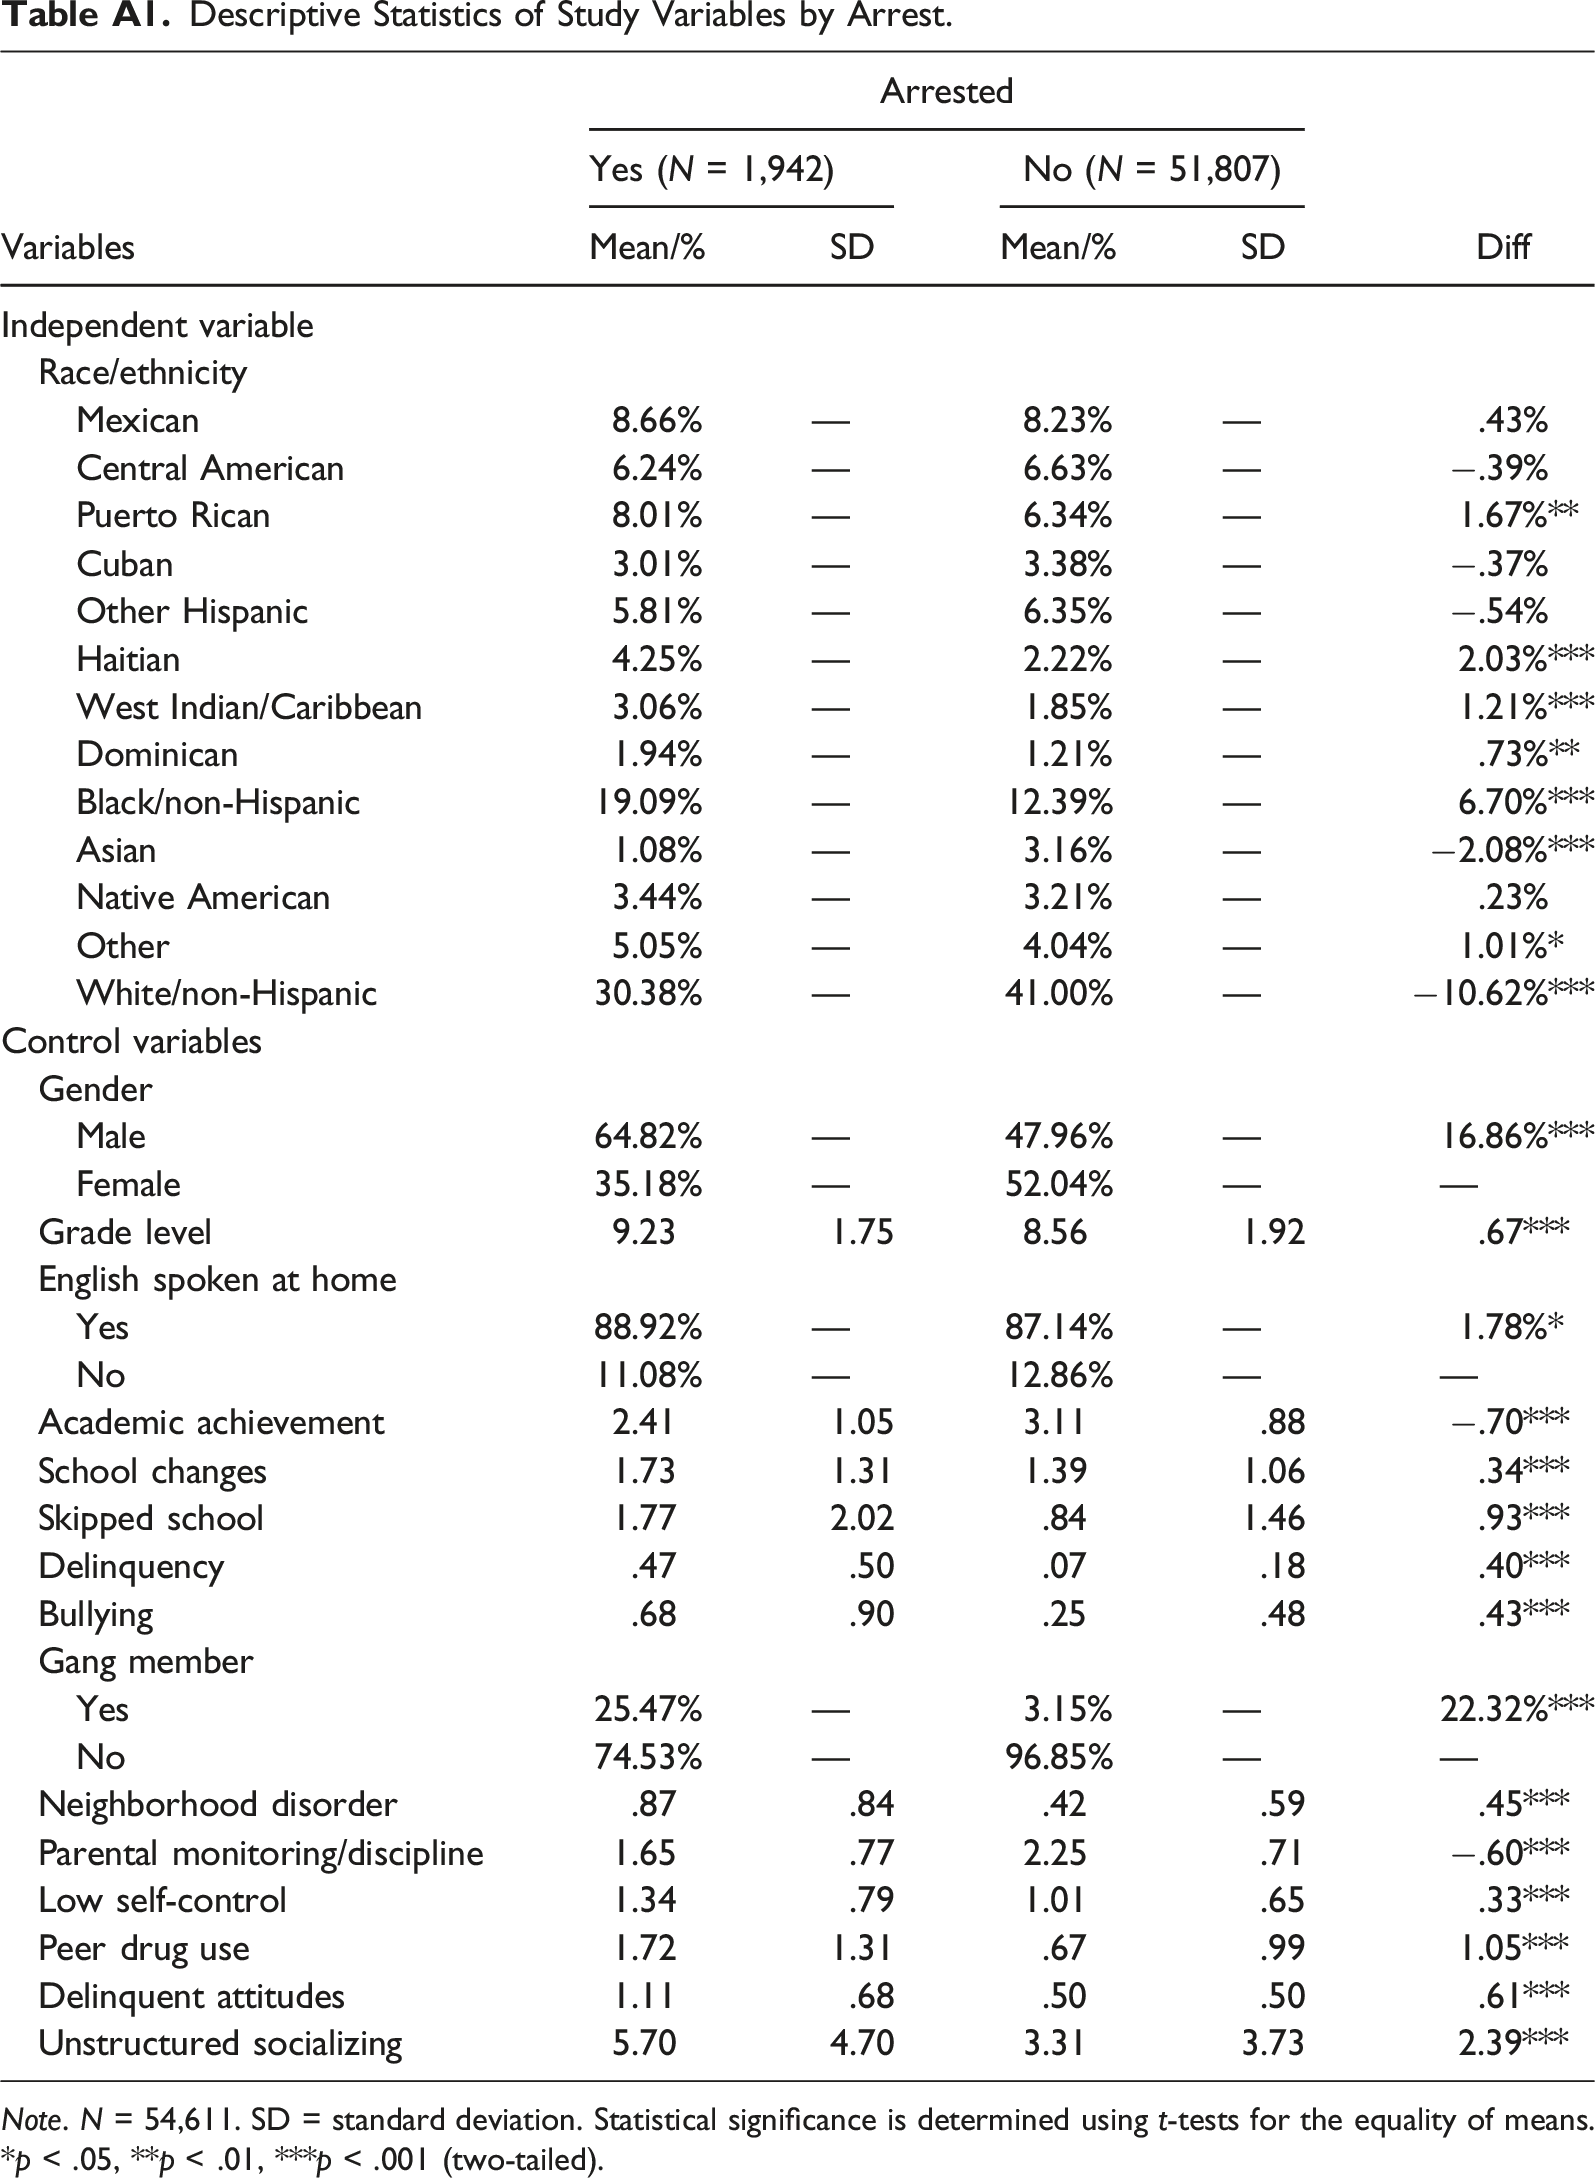
Variables
Arrested
Diff
Yes (N = 1,942)
No (N = 51,807)
Mean/%
SD
Mean/%
SD
Independent variable
Race/ethnicity
Mexican
8.66%
—
8.23%
—
.43%
Central American
6.24%
—
6.63%
—
−.39%
Puerto Rican
8.01%
—
6.34%
—
1.67%**
Cuban
3.01%
—
3.38%
—
−.37%
Other Hispanic
5.81%
—
6.35%
—
−.54%
Haitian
4.25%
—
2.22%
—
2.03%***
West Indian/Caribbean
3.06%
—
1.85%
—
1.21%***
Dominican
1.94%
—
1.21%
—
.73%**
Black/non-Hispanic
19.09%
—
12.39%
—
6.70%***
Asian
1.08%
—
3.16%
—
−2.08%***
Native American
3.44%
—
3.21%
—
.23%
Other
5.05%
—
4.04%
—
1.01%*
White/non-Hispanic
30.38%
—
41.00%
—
−10.62%***
Control variables
Gender
Male
64.82%
—
47.96%
—
16.86%***
Female
35.18%
—
52.04%
—
—
Grade level
9.23
1.75
8.56
1.92
.67***
English spoken at home
Yes
88.92%
—
87.14%
—
1.78%*
No
11.08%
—
12.86%
—
—
Academic achievement
2.41
1.05
3.11
.88
−.70***
School changes
1.73
1.31
1.39
1.06
.34***
Skipped school
1.77
2.02
.84
1.46
.93***
Delinquency
.47
.50
.07
.18
.40***
Bullying
.68
.90
.25
.48
.43***
Gang member
Yes
25.47%
—
3.15%
—
22.32%***
No
74.53%
—
96.85%
—
—
Neighborhood disorder
.87
.84
.42
.59
.45***
Parental monitoring/discipline
1.65
.77
2.25
.71
−.60***
Low self-control
1.34
.79
1.01
.65
.33***
Peer drug use
1.72
1.31
.67
.99
1.05***
Delinquent attitudes
1.11
.68
.50
.50
.61***
Unstructured socializing
5.70
4.70
3.31
3.73
2.39***