
Abstract
The Performance Quality Rating Scale for Somatosensation after Stroke (PQRS-SS) guides observation of survivors of stroke performing client-selected occupations, using common operational definitions. We aimed to determine the inter- and intra-rater reliability, standard error of measurement, and feasibility (via interviews and thematic analysis) of the PQRS-SS version 3. Videos of 22 survivors of stroke with somatosensory impairment completing 38 client-selected occupations on two occasions (76 clips) were viewed by four clinicians twice, 6 weeks apart (PQRS-SS version 3). Intraclass correlation coefficients (ICC), standard error of measurement (SEM), and interview data are reported. For PQRS-SS version 3, inter-rater reliability was moderate to excellent (ICC2,1 = 0.71, ICC2,4 = 0.91) and intra-rater reliability was good (ICC3,1 = 0.76–0.87). Clinician raters reported the PQRS-SS version 3 was easy to use. The PQRS-SS version 3 is ready for use by trained, experienced clinicians and is ready for ongoing psychometric testing.
Plain Language Summary
The Performance Quality Rating Scale for Somatosensation after Stroke (PQRS-SS) is an assessment tool to help clinicians observe survivors of stroke with changes in sensation in their arm and hand perform a valued activity and score their performance. This article reports the modification of the PQRS-SS and associated reliability and feasibility. Seventy-six video clips (of 22 survivors of stroke) were watched by four clinicians, and performance was scored. For PQRS-SS version 3, the consistency of scores between raters was moderate to excellent. The consistency of scores was good when comparing each raters’ scores of the same videos 6 weeks apart. Clinician raters reported the PQRS-SS version 3 was easy to use and is ready for testing in a clinical setting.
Introduction
Assessing observed performance in valued activities for survivors of stroke with somatosensory impairment is beneficial for clinicians to identify how their client’s impairment is affecting their performance in valued activities or occupations (Carey, 2012, 2014) and to inform tailored therapy. Few observation-based tools that use occupations selected by the client have been tested for use with adult survivors of stroke (Barden et al., 2015; Carey et al., 2016; Martini et al., 2015; Wanklyn et al., 2024). Tools that have been tested and reported often focus on assessing the impact of motor impairment (Barden et al., 2015; Martini et al., 2015), and have not been designed to capture distinctive performance features associated with changes in somatosensation in the upper limb (Carey, 2014). This is despite there being a high prevalence of stroke with one in four adults having a stroke globally (Feigin et al., 2018), and around one in two survivors of stroke experiencing somatosensory impairment (Carey, 1995; Carey & Matyas, 2011; Connell et al., 2008; Kim & Smi, 1996; Tyson et al., 2008).
One observation-based assessment tool has been tested with survivors of stroke with somatosensory impairment in client-selected occupations—the Performance Quality Rating Scale for Somatosensation after Stroke (PQRS-SS; Wanklyn et al., 2023). The purpose of the PQRS-SS is to guide clinicians’ observations of clients performing valued occupations selected by the client using the Canadian Occupational Performance Measure (COPM) that they perceive have been impacted by their somatosensory impairment (Wanklyn et al., 2023). The PQRS-SS, a modified version of the original Performance Quality Rating Scale (Martini et al., 2015), can be used specifically with survivors of stroke with somatosensory impairment, to observe and rate performance in client-selected occupations. Descriptions of performance are developed by the researcher or clinician at scores 1, 2, 4, 6, 8, and 10 on the scale from 1 to 10 for each occupation the client selects (Wanklyn et al., 2023). Results indicated the PQRS-SS had good inter-rater reliability (ICC2,1 > 0.80). However, it was highlighted that the tool needed simplification and modification, so that clinicians did not have to operationalize descriptions of performance for every occupation selected, especially when clinicians may not have the knowledge or skill to do so with a somatosensory lens (Wanklyn et al., 2023). The clinician raters suggested defining common descriptors of somatosensory performance that could be used across occupations. Modifying the tool so that it is easy to use is important to provide clinicians with a readily accessible assessment option that guides their observation of client performance in valued occupations. In turn, this should improve clinicians’ ability to identify aspects of performance related to somatosensory impairment and guide targeted client care for this population.
Modification of the PQRS-SS was therefore indicated to determine if common operational definitions of performance features could be used to score performance across occupations while retaining good psychometric properties. An additional step was to simplify the tool further to enhance potential use in clinical practice settings. The researchers intended that modification would continue until the clinician raters’ feedback indicated there were no major issues with the tool, and they perceived the tool had good feasibility. This article reports the iterative, stepwise approach to modifying the PQRS-SS, resulting in the development of this final version, PQRS-SS version 3 (v3). This involved a two-stage development and testing process. The first stage involved the development and testing of an intermediate version, the PQRS-SS version 2 (v2), that had common descriptors for use with any activity, but required further simplification. The second stage involved further refinement and simplification of the common descriptors, leading to the PQRS-SS (v3) and testing of the reliability. The aims were to determine the inter- and intra-rater reliability, SEM, and to collect raters’ feedback, including the feasibility of using this final PQRS-SS (v3). It was hypothesized that the PQRS-SS version 3 would: have good inter-rater and intra-rater reliability, similar to or better than previous versions of the tool; have an acceptable SEM; and raters’ feedback would indicate the tool had good feasibility with no major suggestions for improvement. The manuscript was prepared using the Guidelines for Reporting Reliability and Agreement Studies (Kottner et al., 2011). See Supplement 1 for the reporting checklist.
Method
Study Design and Data
A subset of observational data from a larger randomized controlled trial of the effectiveness of somatosensory rehabilitation, Connecting New Networks for Everyday Contact through Touch (CoNNECT; Carey 2011) was used for further modification and testing of the PQRS-SS. In the CoNNECT study, survivors of stroke were recruited from five metropolitan hospital sites in Australia (Carey 2011). Participants eligible for inclusion had touch discrimination impairment and were at least 3 months poststroke (Carey, 2011). Refer to Carey (2011) for full details of the CoNNECT main study protocol.
Videos of stroke participants performing client-selected occupations were recorded by treating clinicians at varying times across the assessment and treatment phases of the CoNNECT study. The videos were taken to provide feedback to stroke participants during therapy, as well as to assess their performance at different times during the CoNNECT study. The main purpose of this study was to test the psychometric properties of the newly modified version of the PQRS-SS. Videos were used from a range of times across the CoNNECT study that recorded varied performance quality in a range of activities, to ensure a spread of scores was achieved across the PQRS-SS scale. Videos of 22 survivors of stroke completing 38 client-selected valued activities (22 different activities) met the inclusion criteria and were available for analysis of intra-rater, inter-rater reliability, and SEM using the newly modified versions of the PQRS-SS.
Iterative Development and Testing of the PQRS-SS
An iterative approach was taken in the modification of the PQRS-SS. Researchers used feedback from the clinician raters and reliability data to guide the modification process. The following describes the modification process, the methods used, and the findings for the intermediate PQRS-SS (v2) that led to the further modification and development of the final PQRS-SS (v3).
A significant modification of the PQRS-SS was to develop common operational definitions for scores 1, 2, 4, 6, 8, and 10 on the score card that could be used for any activity. Descriptions of common observable features of quality performance were also developed to guide scoring. See Supplement 2 for the score card for PQRS-SS (v2).
Two occupational therapists experienced in assessing and treating survivors of stroke with somatosensory impairment were recruited for testing of the intermediate PQRS-SS (v2). Raters received 1 hour of training, and provided written feedback, and an informal discussion occurred. Two raters analyzed 76 video clips of 22 survivors of stroke performing 38 activities on two occasions using the PQRS-SS (v2).
For data analysis, a scatterplot with a line of best fit was visually inspected to examine the relationship between the two raters’ scores for PQRS-SS (v2). Inter-rater reliability was calculated using an intraclass correlation coefficient two-way random effects model with absolute agreement for single measure (ICC2,1) and average measures (ICC2,2) with a 95% confidence interval (CI) (Portney & Watkins, 2014). For PQRS-SS (v2), written feedback was analyzed by the first author and summarized descriptively.
The following results were obtained. The frequency of scores used across the scale is presented in Supplement 2. On average, 61% of scores were assigned to those with operational definitions, and 39% were assigned to scores without operational definitions. However, more of the scores (six) on the scale had operational definitions, than those without (four). The scatterplot comparing the two raters’ scores is presented in Supplement 2. The intercept of the regression line suggested that there was no systematic variance with the intercept at 0.8 and a slope close to 1 (0.88).
Good inter-rater reliability was reflected in the ICC2,1 score = 0.78 (CI 95%: 0.68–0.86) for a single measure. The SEM was 1.17, 95% CI = 4.87 (mean score) ± 2.28 based on the ICC2,1 inter-rater reliability coefficient. The inter-rater reliability was also good using the average measures ICC2,2 score = 0.88 (CI 95%: 0.81–0.92). The SEM was 0.89, 95% CI = 4.87 (mean score) ± 1.73 based on the ICC2,2 inter-rater reliability coefficient.
Feedback from the raters suggested that the use of common operational definitions for use with any activity were beneficial, with one rater reporting “. . . the ‘observable features of performance quality’ prompt sheet did assist with guiding overall scoring . . .”. In terms of feasibility, one rater reported the “instructions were clear”; “. . . it would be clinically useful . . .”; and “The observable features of performance quality is really useful”. The other rater reported “I feel the level of details used was sufficient for its purpose”. However, one rater reported the tool was “visually overwhelming” suggesting some complexity remained.
The results indicated that the intermediate PQRS-SS (v2) with common operational definitions for use across any activity had good inter-rater reliability, however, raters’ feedback suggested further simplification of the tool was needed. Therefore, further modification occurred, developing the PQRS-SS (v3), described in detail in this article.
Participants
Email invitations were sent to research clinicians associated with the program of sensory research, led by LMC, that included the CoNNECT study. Those who were interested contacted the first author (TW) and sent a signed information and consent form. They provided informed consent to participate as clinician raters.
For the testing of PQRS-SS (v3), four clinician raters were recruited; two raters had occupational therapy backgrounds, and two had physiotherapy backgrounds. All raters had extensive experience working with survivors of stroke, and all participants had attended training in the SENSe approach (Carey 2012). To reduce the risk of rater bias, these raters had no prior exposure to the videos before participating in the study and had not completed the COPM with the participants.
Video recordings from the stroke survivor participants were used in this study when additional consent was obtained in the CoNNECT study trial to be recorded by video. Ethics approval was also obtained from La Trobe University for the current studies (HEC20138). The characteristics of the stroke survivor participants included in the current studies were as follows: the mean age was 54 years (standard deviation [SD] = 13 years); three participants were female and 19 male; 17 experienced an infarct and five had a hemorrhage; the mean time since stroke was 10.6 months (SD = 10.1 months); 13 had the right side and nine had the left side of their body affected; and all 22 participants were right hand dominant.
Sample Size
A power analysis was calculated a priori to ensure that the sample of available videos would be sufficient for the aims of this project. For the reliability analyses, a sample size of 30 was required to detect a moderate correlation equal to or greater than 0.5 with a power of 0.8 (Portney & Watkins, 2014). The sample of 76 video clips was therefore more than sufficient.
Methods for Modifying PQRS-SS Version 3
Methods used for the modification of PQRS-SS version 3 were similar to those reported in Wanklyn et al. (2023) and described above for the intermediate version (PQRS-SS [v2]). The same research team developed all three versions (Wanklyn et al., 2023). The authors had extensive experience in clinical practice as occupational therapists working in stroke rehabilitation (TW, LMC); in test development and psychometrics (KW, LMC); and in development of evidence-based somatosensory assessment (LMC).
Modification and Development of PQRS-SS Version 3
Operational definitions from PQRS-SS (v2) were simplified for scores 1, 2, 4, 6, 8, and 10. Somatosensory performance quality feature descriptors were edited from PQRS-SS (v2) and grouped for simplicity under four headings consistent with a framework described by Carey (2012, 2014): somatosensory performance, somatosensation for action, somatosensation in task context, and compensation related to somatosensation. See Figure 1 for the score card for PQRS-SS (v3).
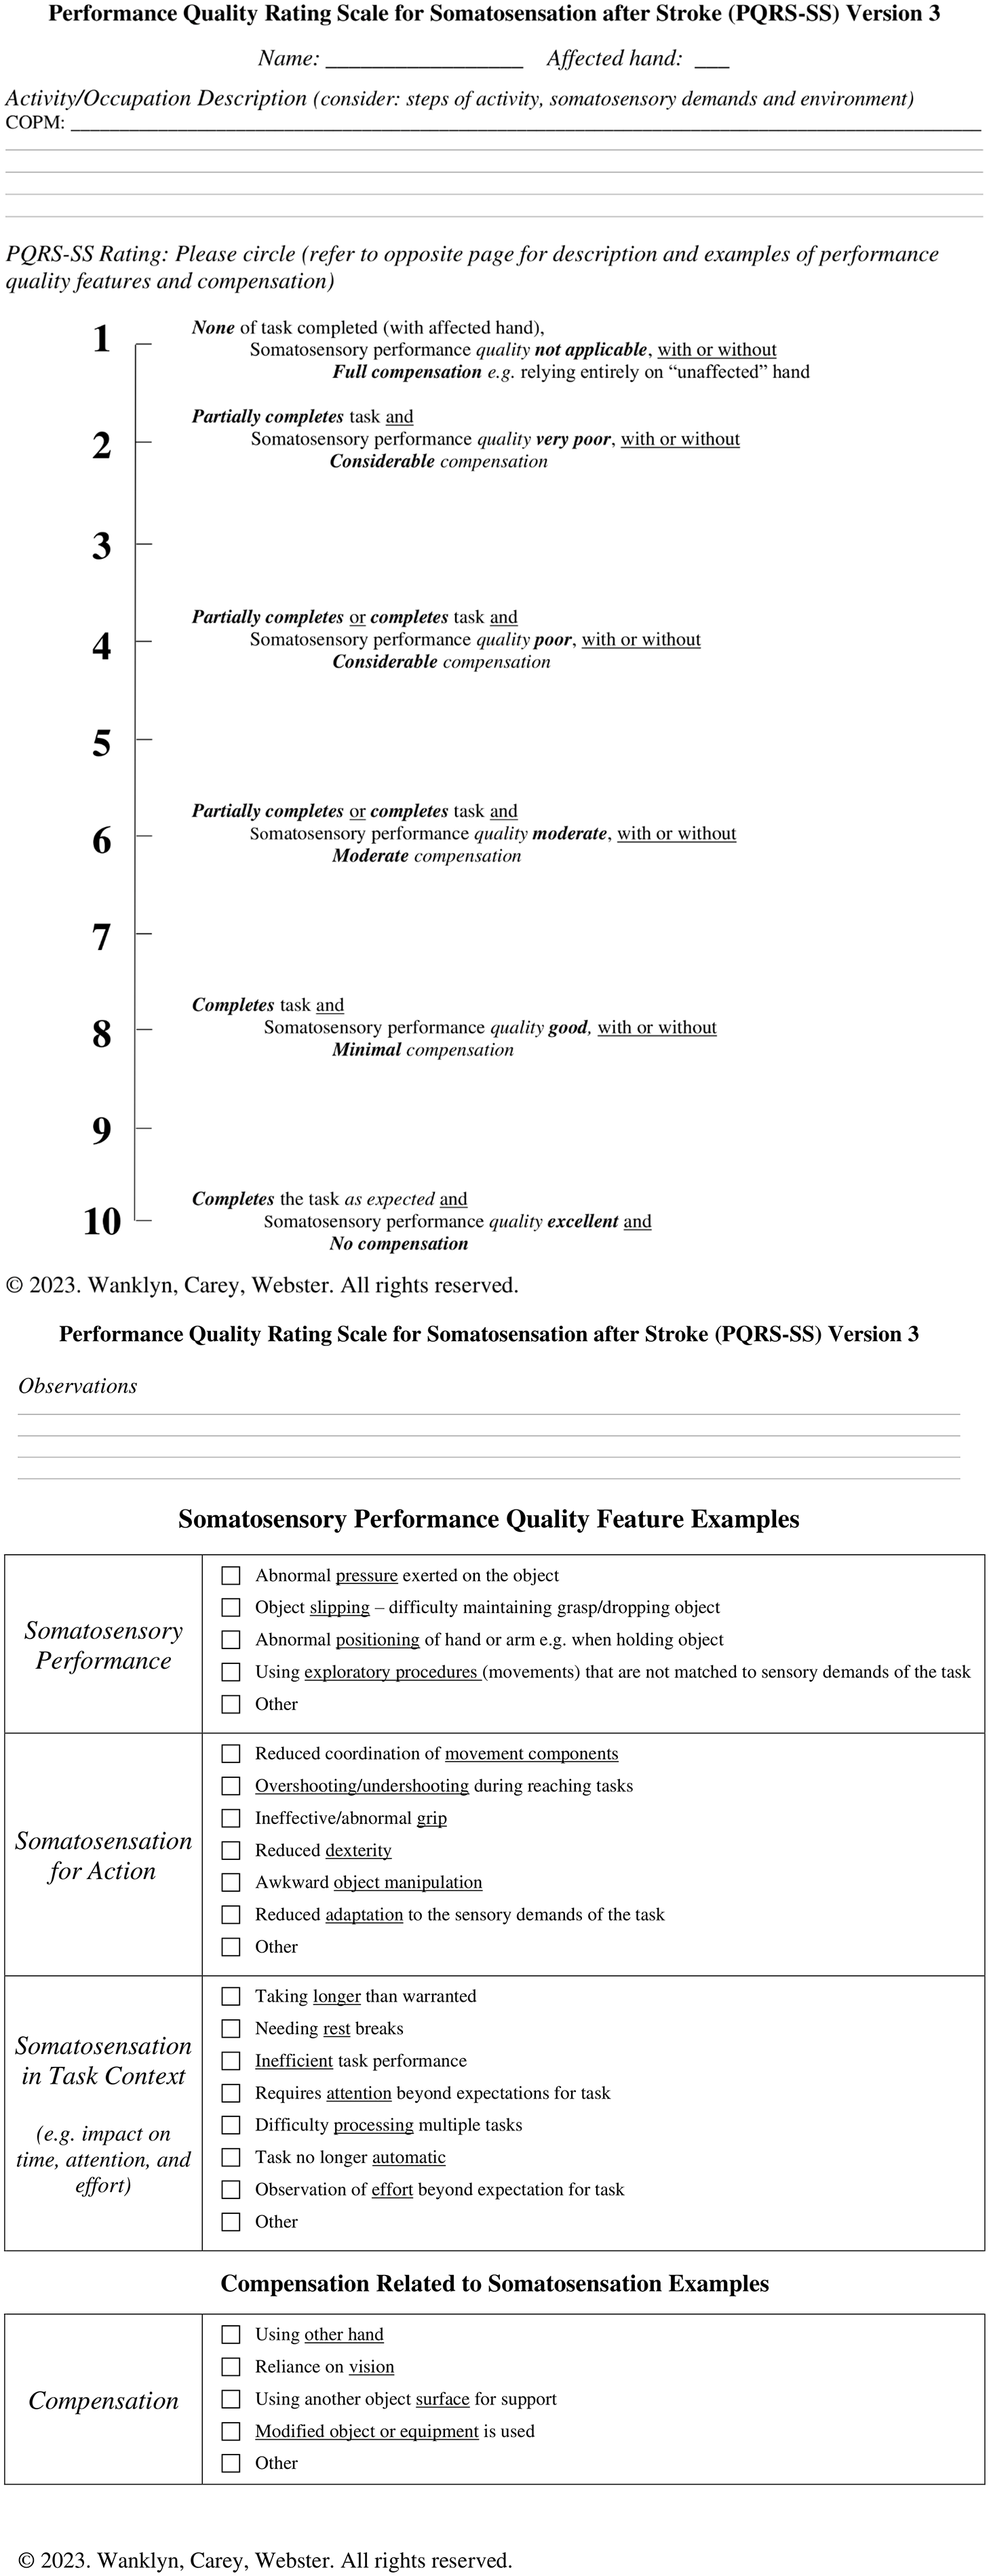
PQRS-SS Version 3 Score Card
Development of the PQRS-SS (v3) went through some additional steps. The tool was discussed with one of the creators of the original PQRS. Consensus rating was also undertaken for the four videos used during training of clinicians to guide consistent ratings and feedback. The authors (TW, LMC), and a physiotherapist with over 25 years’ experience in neurology and experienced in the SENSe approach, conducted the consensus rating. The authors and clinician individually rated each video, discussing decisions between each clip until an agreement was reached about a score for that video. A visual aid summarizing the scoring of the tool was created by the team (see Figure 2). A training manual was also developed, with information about the PQRS-SS (v3) and background information about observable somatosensory performance features (available on request from the first author).
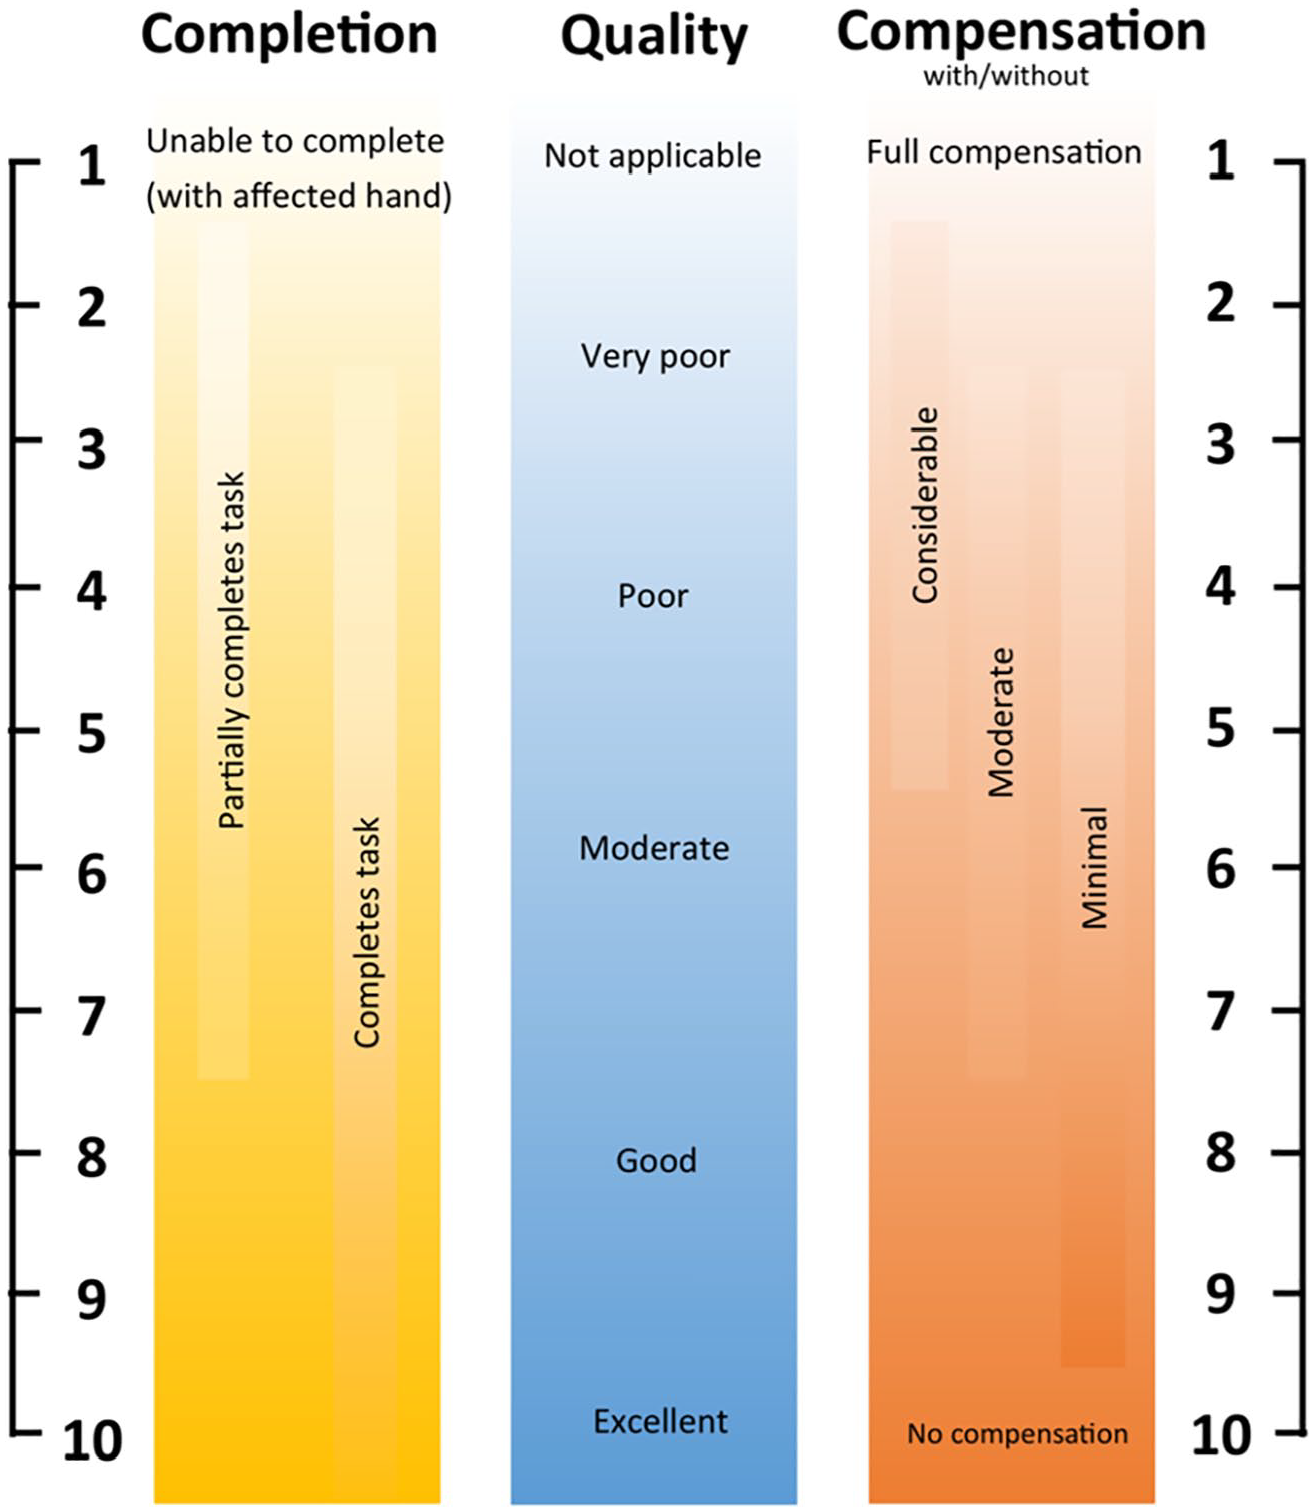
PQRS-SS Version 3 Visual Aid
Video Compilation, Training, and Rating
The same video compilation reported in Wanklyn et al. (2023) was used for testing all three versions of the PQRS-SS. Briefly, video clips of survivors of stroke performing one or two activities at two time points (N = 76 total) were assembled. Video clips were randomized, and raters were blinded to any identifying information, that is, participant codes or video time points. A 2.5-hour long video was compiled.
When testing the PQRS-SS (v3), raters were provided the training manual and the PQRS-SS (v3) testing form with visual aid at least 1 week prior to the first rating session and were asked to read it before attending. Two rating sessions, 6 weeks apart, were planned for each rater independently. At the start of each rating session, training on the PQRS-SS (v3) was conducted, taking 60 minutes for the first session and 30 to 45 minutes for the second session. This training included an explanation of the tool and visual aid. Raters then scored the four consensus rated videos with feedback and discussion between each video clip. Due to COVID-19 restrictions, all training and rating sessions were conducted online via zoom.
For the PQRS-SS (v3), rating sessions took between 4 and 5 hours to score clips. For each of the clips, the raters were informed of the activity or occupation the survivor of stroke had identified using the COPM, the side of the body “affected” by the stroke, and their hand dominance. They had control of the play and pause functions of the video and were encouraged to take breaks as needed.
For PQRS-SS (v3), the clinician raters were asked to provide feedback about their experience using the tool as follows: open questions requesting their feedback about the instructions, if the tool could be used in a clinical setting, if they had any recommendations for how it could be improved, and how easy or difficult it was to use (on a scale from 1 to 10); see Supplement 3 for the interview guide. For the PQRS-SS (v3), a brief interview was conducted at the end of the rating sessions via zoom and was recorded.
Data Analysis
For PQRS-SS (v3), the four raters’ scores for each individual video clip were mapped to visually inspect if there were any apparent trends between raters’ scores. A bar chart reflecting frequencies of scores graphically was used to determine if a full spread of scores was achieved across the whole scale. The average percentage frequency across raters was also calculated for assigning scores on the scale with operational definitions and for assigning scores without.
Inter-rater reliability was calculated using an intraclass correlation coefficient two-way random effects model with absolute agreement for single measure (ICC2,1) and average measures (ICC2,4) with a 95% CI (Portney & Watkins, 2014). An ICC for average measures was reported, as well as the single measure ICC because the tool could be used not only in a clinical or research setting by single clinicians, where the single measure ICC would be more relevant, but also in research settings where the mean value of multiple raters might be used, where the average measures would be more relevant (Koo & Li, 2016). The inter-rater reliability was assessed for the first rating session only. An ICC above 0.90 was considered excellent, between 0.75 and 0.90 good, and between 0.50 and 0.75 moderate, with an ICC score of 0.70 set as the minimum acceptable level (Koo & Li, 2016).
The SEM was calculated to estimate the variance in error around the raters’ scores for both versions (Portney & Watkins, 2014). The SEM for inter-rater reliability data was calculated using the formula SEM =
To calculate the intra-rater reliability, an intraclass correlation coefficient (ICC3,1) two-way mixed effects model with absolute agreement for a single measure (95% CI) was calculated to compare scores for all raters, and for the combined average scores across raters between the first and second rating sessions (Koo & Li, 2016). The SEM was also computed for intra-rater reliability to show the likely variance of scores that could be anticipated on retesting for each rater (Portney & Watkins, 2014). The formula used was SEM =
Feedback from raters was collected and an in-depth interview and thematic analysis was conducted. The audio recordings were transcribed, coded, and analyzed by the first author using reflexive thematic analysis (Braun & Clarke, 2006) and the NVivo 12 software. The six phases described in Braun and Clarke (2006) were used to conduct the thematic analysis: “Familiarizing yourself with your data, generating initial codes, searching for themes, reviewing themes, defining and naming themes, [and] producing the report” (p. 87). Themes were identified, defined by the first author, and then reviewed and named in consultation with two co-authors. Disagreements were discussed until a consensus was reached.
Results
PQRS-SS v3 Reliability
Inter-rater and intra-rater reliability results for four raters using the PQRS-SS (v3) are presented below. PQRS-SS (v3) scores for all 76 video clips are mapped with the four raters’ scores for each video clip mapped in Figure 3 for the first rating session.
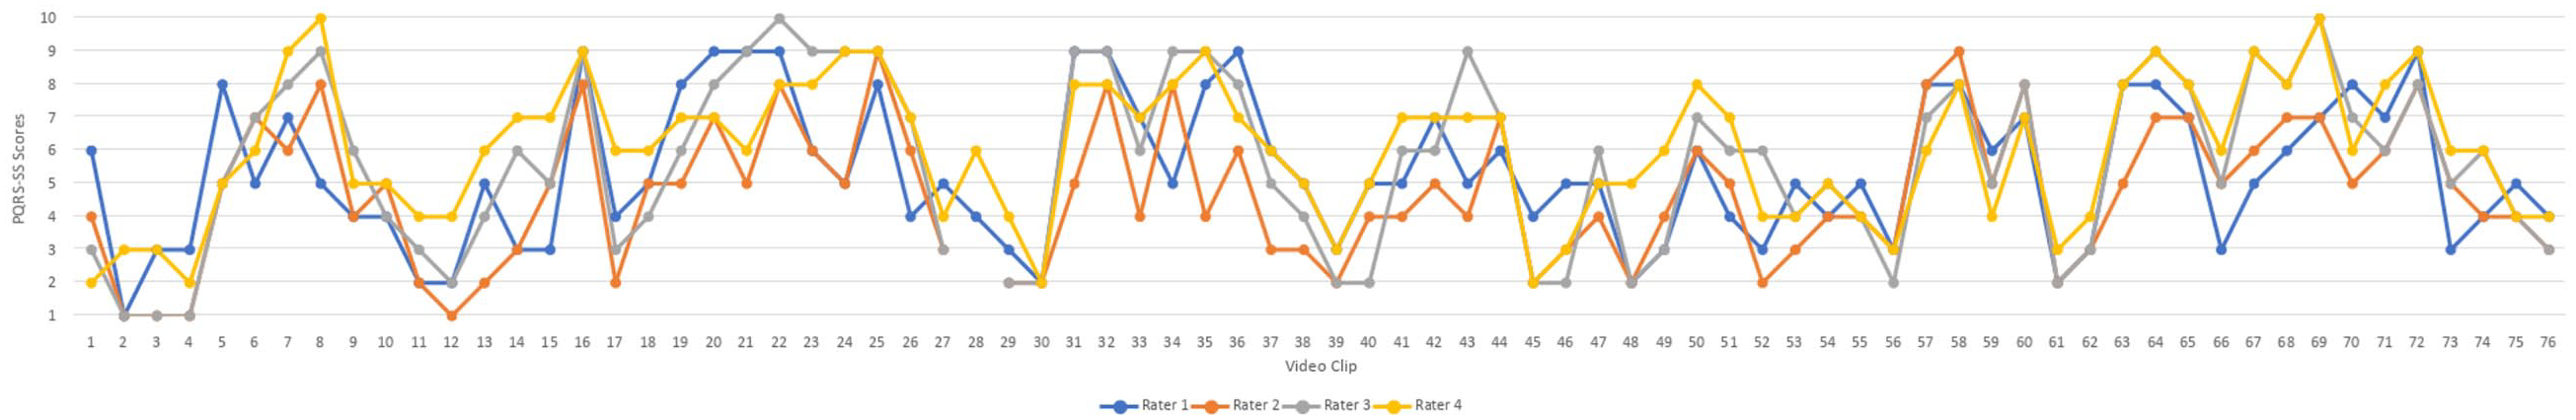
PQRS-SS Version 3 Scores for Four Raters
No rater appeared to consistently rate higher or lower than the other raters based on visual inspection of Figure 3. The spread of scores is also presented in Figure 4, with a bar chart depicting the frequencies of scores across the scale from 1 to 10 for all four raters. Scores were spread across the full range of the scale, however, two of the raters did not assign a score of 10, and one rater did not assign a score of one for any of the video clips. Operational definitions were present for scores 1, 2, 4, 6, 8, and 10. There were no apparent differences in the use of scores with and without operational definitions based on the visual inspection of Figure 4. The average percentage frequency across raters for using a score with operational definitions was 53%, and for using a score without operational definitions was 47%, though, six points on the scale had operational definitions and only four did not. Two raters were unable to score performance on one video clip and reported that the clip was too short. This clip was thus removed from the analysis.
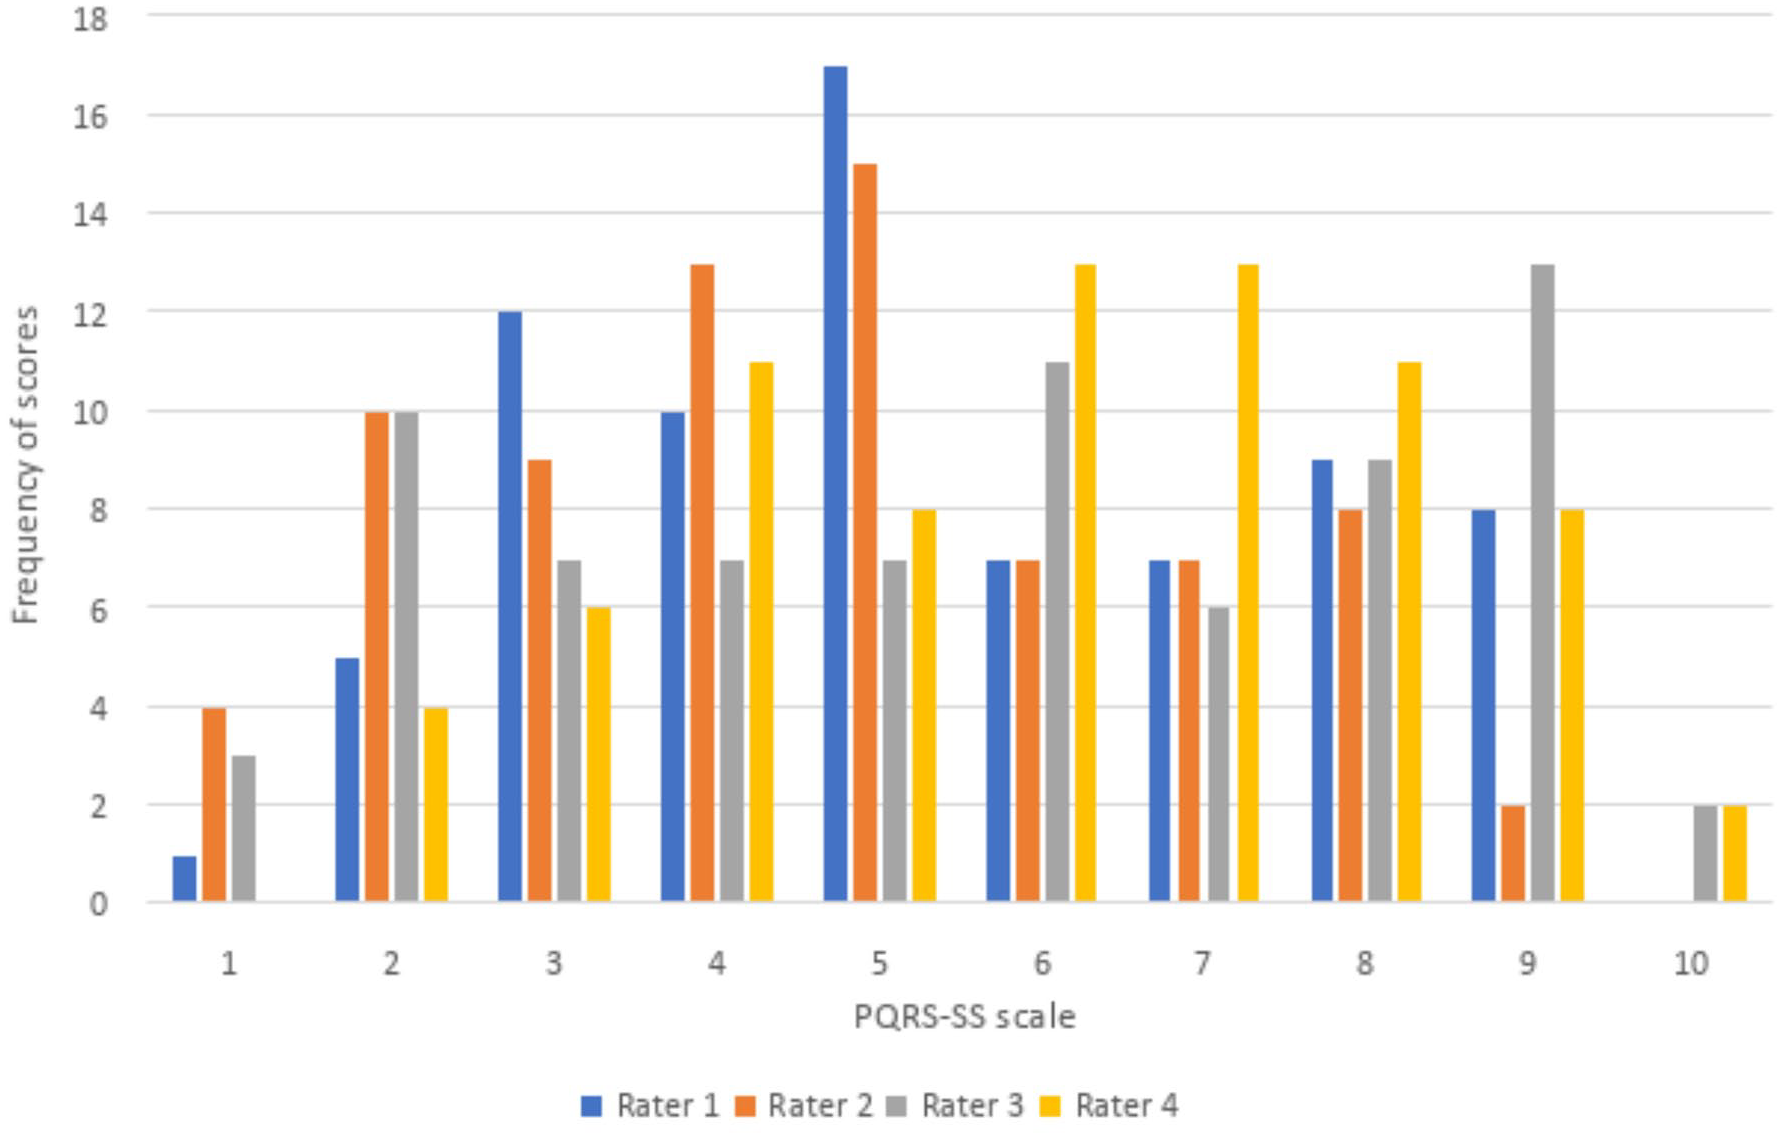
Score Frequency for PQRS-SS Version 3
Inter-rater reliability was moderate for a single measure with an ICC2,1 of 0.71 (95% CI = 0.59–0.80), and was excellent for average measures with an ICC2,4 of 0.91 (95% CI = 0.85–0.94). The SEM was 1.22 using the ICC2,1 single measure inter-rater reliability coefficient. The 95% CI was 5.43 (mean score) ± 2.39. The SEM for the average measures was 0.68 using the ICC2,4 inter-rater reliability coefficient, and the 95% CI was 5.43 (mean score) ± 1.32.
Intra-rater reliability was good for all four raters with ICC3,1 scores ranging from 0.76 to 0.87, and excellent for the average scores across raters with an ICC3,1 of 0.95 (see Table 1). The SEM using the intra-rater reliability ICC3,1 coefficient ranged from 0.76 to 1.21, and was 0.49 for the combined average scores across raters (see Table 1).
Intra-Rater Reliability and Standard Error of Measurement for the PQRS-SS Version 3.
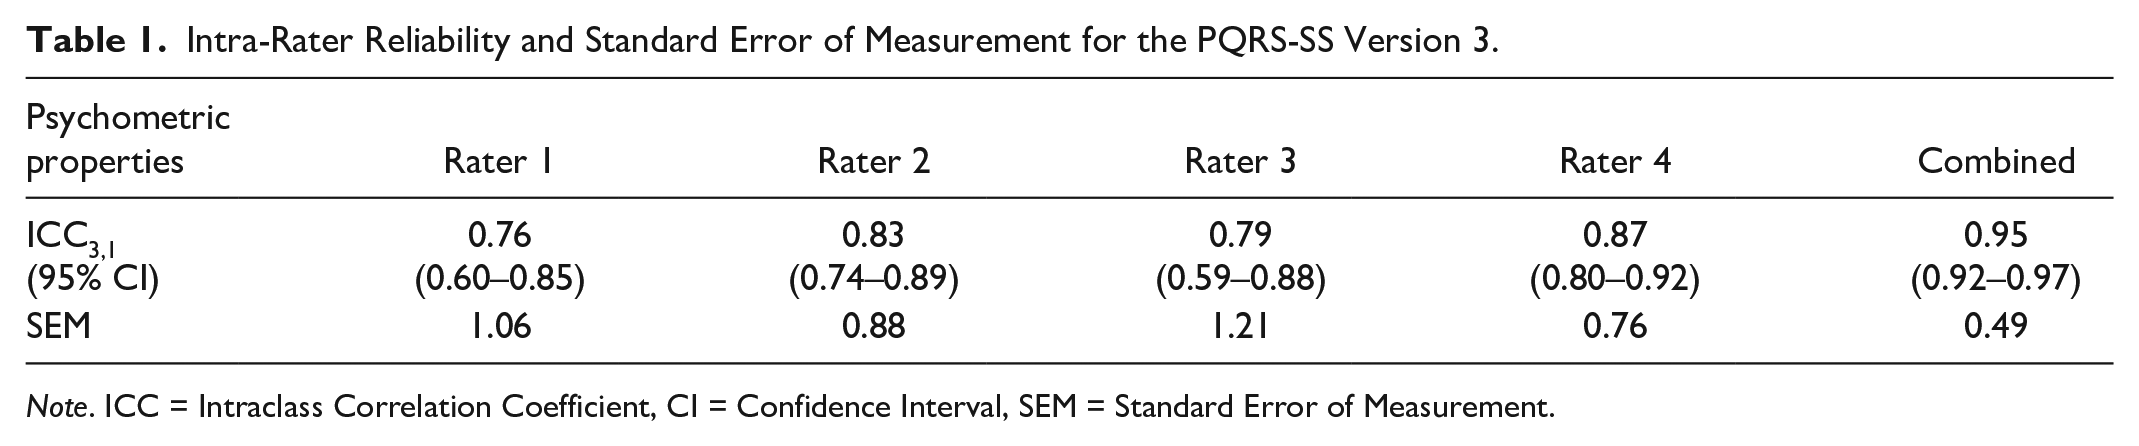
Note. ICC = Intraclass Correlation Coefficient, CI = Confidence Interval, SEM = Standard Error of Measurement.
PQRS-SS v3 Feedback and Feasibility
Four themes were elicited from analyzing the feedback from the interviews with the four raters for PQRS-SS (v3). The themes were: becomes easier with practice, positive attributes of the tool, challenges of rating somatosensation, and recommendations. The theme becomes easier with practice, was identified in all raters’ feedback. One rater stated, “It got easier the more that I did it.”
All raters also had positive reflections about the tool, and these were grouped into the theme positive attributes of the tool. The most common attributes are highlighted as follows. Raters indicated that the tool added value, with one rater stating “I think it does have a bit of a niche in terms of options of outcome measures that are out there. I don’t think any others do this quite the same, so it is valuable.” Raters reported that the tool gave structure to rating somatosensory performance, and one rater stated, “I think it gave a really nice structure to be able to objectively rate somatosensory difficulties within tasks. . . . . I don’t think there’s anything out there that would give that same structure.” Raters believed they received sufficient training both with the written manual and instructional training. They also thought the tool was ready for clinical use, stating “I definitely feel it could be used in the clinical setting.”
For challenges of rating somatosensation, two key challenges surfaced. One was that raters found it challenging focusing on somatosensory performance rather than motor performance. One rater stated, “I needed to challenge myself to think more about the somatosensory and not the motor bits.” Raters also found identifying difficulties with exploratory procedures, (that is, exploring objects for key physical features; Lederman & Klatzky, 1996) was challenging within activities. One rater reported “. . . to really clearly think about exploratory procedures during task performance, I found that the hardest thing to rate.”
Several recommendations were also made about the tool and the accompanying materials, including the manual and training videos. No major recommendations were made in relation to the structure of the tool itself. Suggestions included developing an online version; using videos in training that were less familiar (the training videos were those used during the SENSe approach training and familiar to some of the raters); creating a reference summary sheet of how the performance feature examples might present in activities (that is, making a one-sheet summary of some of the content in the manual); and making the manual headings clearer for easier reference.
Discussion
The purpose of this research project was to investigate the reliability and feasibility of the PQRS-SS. This involved iterative development and testing of the PQRS-SS that led to this satisfactory final version that has good feasibility and strong reliability (PQRS-SS v3). The PQRS-SS (v3) achieved similar strong inter-rater reliability to previous versions, while using the successful common operational definitions across activities, and achieved a simplified format. PQRS-SS (v3), which supersedes PQRS-SS (v2), had good intra-rater and moderate-to-excellent inter-rater reliability with an acceptable variance in error, similar to the original PQRS (Martini et al., 2015). Clinicians reported the PQRS-SS (v3) was valuable, quick, and easy to use, guided their observations of somatosensory performance, and that “. . . it could be used in the clinical setting.” It is acknowledged, however, that further testing would be required with clinicians with a range of experience and in a range of health settings before recommending its use more broadly in routine clinical practice.
While testing psychometric properties is an ongoing process, the good reliability supported that the PQRS-SS (v3) is ready for testing in a clinical setting in its current format. For PQRS-SS (v3), moderate-to-excellent inter-rater reliability was displayed in the ICC2,1 and ICC2,4 values, with excellent inter-rater reliability using average measures (Koo & Li, 2016). This provides confidence in the use of the tool, particularly when the average score for multiple raters is used, most likely in a research setting. It is acknowledged, however, that researchers would still require training in the use of the tool. The ICC2,1 score for a single measure (ICC2,1 = 0.71) was moderate, and is relevant when the score for a single rater would be used, more likely in clinical settings (Koo & Li, 2016). The ICC2,1 and ICC2,4 values both exceeded the value of 0.70 that was set as the minimum standard a priori. These findings support that the PQRS-SS (v3) is ready for further testing in clinical settings and with clinicians with a range of experience, and for a variety of other psychometric properties to be tested in its current format.
Along with testing the reliability of the tool, feedback was collected from raters, helping to determine the feasibility of the tool, and indicated the tool in its current format was ready for further testing in a clinical setting. To determine the feasibility of the tool, feedback was closely considered, particularly in relation to the ease of use, whether raters recommended any structural changes, and whether they thought the tool could be applied in a clinical setting. While structural changes were indicated in feedback for PQRS-SS (v2), for PQRS-SS (v3), raters reported that they found the tool easy to use, and only minor changes were recommended unrelated to the structure of the tool, and they felt the tool could be used in clinical settings, that is, it did not require further modification. This feedback supports the feasibility of the PQRS-SS (v3) for use with survivors of stroke with somatosensory impairment. As with all tools, further testing of the PQRS-SS (v3) psychometric properties would be beneficial, particularly in a clinical setting and with clinicians with a range of experience, confirming the findings reported in this study for other contexts.
While there are other tools that have been tested for assessing observed performance in client-selected occupations with survivors of stroke (Wanklyn et al., 2024), these tools have usually been developed with a focus on motor performance, such as the Upper Limb Performance Assessment, the Performance Quality Rating Scale, and the Functional Arm Activity Behavioural Observation System (Barden et al., 2015; Martini et al., 2015; Uswatte & Hobbs Qadri, 2009). There are other tools such as the Australian Therapy Outcome Measures for Occupational Therapy (Perry et al., 2004) and the Morriston Occupational Therapy Outcome Measure (James & Corr, 2004) where clients are evaluated on performing activities they have selected; however, the tools are outcome measures, and are not specific to performance in relation to somatosensory impairment. The Assessment of Motor and Process Skills is another tool available for assessing observed performance in occupations, however, the occupations are selected by the clinician, and the tool has a focus on motor and perceptual performance in the occupations, rather than somatosensory performance (Ransby et al., 2020). The PQRS-SS (v3) has been developed with a specific emphasis on focusing clinicians’ observations into the observable features of performance in occupations related to somatosensory impairment. The tool has addressed a gap in the literature (Carey, 2014), and with further systematic testing across clinicians and clinical settings, and deliberate knowledge translation activities, has the potential for broad application with this population.
While the tool has addressed a gap and feedback from raters suggested the tool was ready for use in a clinical setting in its current format, there are limitations in the generalizability of these findings. Testing the PQRS-SS (v3) was conducted with four skilled clinicians, with experience working with survivors of stroke with somatosensory impairment. This was intentional, to obtain feedback from those experienced working with this population, and to support future developments if required. However, it is unclear how novice and less experienced clinicians would rate performance using the PQRS-SS. The reported reliability of the tool currently applies to use of the tool by skilled clinicians with training in use of the PQRS-SS and prior clinical and research experience with survivors of stroke with somatosensory impairment and training in the SENSe approach (Carey, 2012). Feedback from these clinician raters suggested the tool is appropriate for use in its current format. However, future studies should test the PQRS-SS (v3) with clinicians with a wide range of expertise, including novice clinicians, to evaluate if it is reliable for use with clinicians generally, regardless of experience.
Conclusion
The PQRS-SS was modified for application across any activity using common operational definitions specific to survivors of stroke with somatosensory impairment and simplified. Results for PQRS-SS (v3) suggested the tool has strong reliability and is feasible for use by trained, experienced clinicians without further modification. The tool is ready for ongoing psychometric testing, with a priority to test it in a clinical setting and with clinicians with a range of experience to ensure it maintains strong psychometric properties in these contexts.
Supplemental Material
sj-docx-1-otj-10.1177_15394492241307636 – Supplemental material for Performance Quality Rating Scale for Somatosensation After Stroke Version 3: Reliability, Feasibility
Supplemental material, sj-docx-1-otj-10.1177_15394492241307636 for Performance Quality Rating Scale for Somatosensation After Stroke Version 3: Reliability, Feasibility by Tamara Wanklyn, Kate E. Webster and Leeanne M. Carey in OTJR: Occupational Therapy Journal of Research
Supplemental Material
sj-docx-2-otj-10.1177_15394492241307636 – Supplemental material for Performance Quality Rating Scale for Somatosensation After Stroke Version 3: Reliability, Feasibility
Supplemental material, sj-docx-2-otj-10.1177_15394492241307636 for Performance Quality Rating Scale for Somatosensation After Stroke Version 3: Reliability, Feasibility by Tamara Wanklyn, Kate E. Webster and Leeanne M. Carey in OTJR: Occupational Therapy Journal of Research
Supplemental Material
sj-docx-3-otj-10.1177_15394492241307636 – Supplemental material for Performance Quality Rating Scale for Somatosensation After Stroke Version 3: Reliability, Feasibility
Supplemental material, sj-docx-3-otj-10.1177_15394492241307636 for Performance Quality Rating Scale for Somatosensation After Stroke Version 3: Reliability, Feasibility by Tamara Wanklyn, Kate E. Webster and Leeanne M. Carey in OTJR: Occupational Therapy Journal of Research
Footnotes
Acknowledgements
The authors acknowledge and thank Prof. Helene Polatajko for her feedback on the tool, and Dr. Brendon Haslam for conducting consensus rating.
Declaration of Conflicting Interests
The author(s) declared no potential conflicts of interest with respect to the research, authorship, and/or publication of this article.
Ethics
Ethics approval for this study was obtained through the human ethics committee of La Trobe University (HEC20138). Ethics approval for the CoNNECT study was through Austin Health (H2013/04915) and La Trobe University.
Funding
The author(s) disclosed receipt of the following financial support for the research, authorship, and/or publication of this article: The authors acknowledge financial support for the conduct of the research from the National Health and Medical Research Council (NHMRC) Projects (grant nos. 1022694, 191214, and 307902); NHMRC Partnership grant (grant no. 1134495); NHMRC Ideas grant (grant no. 2004443); and James S. McDonnell Foundation Collaborative Award (grant no. 220020413). This research is also supported by an Australian Government Research Training Program (RTP) Scholarship and a La Trobe University Postgraduate Research Scholarship awarded to TW.
Supplemental Material
Supplemental material for this article is available online.
References
Supplementary Material
Please find the following supplemental material available below.
For Open Access articles published under a Creative Commons License, all supplemental material carries the same license as the article it is associated with.
For non-Open Access articles published, all supplemental material carries a non-exclusive license, and permission requests for re-use of supplemental material or any part of supplemental material shall be sent directly to the copyright owner as specified in the copyright notice associated with the article.