
Abstract
On-road assessment is optimal for determining medical fitness-to-drive but unreliable if determined by global pass/fail decisions alone. Occupational therapists need standardized, psychometrically sound on-road scoring procedures. Performance Analysis of Driving Ability (P-Drive) is a promising on-road test developed in Sweden, but it has not been standardized for Australasia. We investigated the psychometric properties and concordance with an on-road decision of data gathered with the Australasian version of P-Drive. P-Drive was administered to older and cognitively impaired drivers (N = 134) aged 18 to 91 years (mean age 68) who were referred to 10 driving clinics in Australia and New Zealand to determine driving performance. Rasch analysis provided evidence for construct validity and concordance of the data gathered. An optimal cut-off score of 85 was set, yielding evidence of good sensitivity at 88% and specificity at 88%. The Australasian version of P-Drive produces valid and reliable data regarding on-road driving performance.
Plain Language Summary
P-Drive: A fair and reliable test of fitness-to-drive for medically at-risk drivers in Australasia?
In-car driving assessments, conducted by occupational therapists with specialized training, are best for determining if older drivers or drivers with medical conditions are safe to drive because they are conducted in real traffic. However, researchers advise that on-road assessments are unreliable if pass/fail decisions are made without applying consistent and accurate scoring procedures. Drivers undergoing assessments want tests to be fair and equitable, regardless of the tester or location. Performance Analysis of Driving Ability (P-Drive) is a Swedish, gold-standard test of fitness-to-drive. However, P-Drive has not been examined for drivers in Australia and New Zealand. Therefore, we investigated whether P-Drive was a suitable test for drivers in these regions. P-Drive was given to 134 drivers aged 18 to 91 years who were referred to 10 driving clinics in Australia and New Zealand for fitness-to-drive assessments, due to medical conditions or age-related changes that may impact cognitive function. Results indicated that P-Drive was a valid and reliable test of driving ability for medically at-risk drivers in these regions. Evidence indicates the ideal cut-off score for identifying safe drivers, with 88% accuracy, is 85/100.
Fitness-to-drive on-road assessments, usually conducted by occupational therapists with specialized training, are undertaken in many countries, including the United States, Canada, Australia, and New Zealand, for determining the impact of medical conditions or age-related changes on driving competence and, ultimately, for differentiating between safe and unsafe drivers (Di Stefano & Macdonald, 2012; Kay et al., 2008). On-road (in-car) assessment is generally considered optimal for determining fitness to drive because functional driving performance is assessed in traffic (Barco, Baum, et al., 2015; Classen et al., 2010; Odenheimer et al., 1994; Selander et al., 2011). Therefore, on-road assessment has high acceptability (Barco, Baum, et al., 2015; Kay et al., 2008; Wheatley & Di Stefano, 2008). However, the validity of on-road assessment has been criticized for failure to utilize standardized measures of driving ability with sound psychometric properties, the absence of a theoretical frame of reference, the lack of objective scoring procedures, and the practice of summing multiple constructs into a raw score (Barco, Baum, et al., 2015; Kay et al., 2008; Patomella et al., 2006, 2010; Shechtman et al., 2010).
Examination of the psychometric properties of tests (i.e., the validity and reliability qualities of a set of test scores, including their interpretation and application; Geisinger, 2016) is crucial for researchers and practitioners to ensure tests are: reliable, meaning scores are consistent and valid over repeated administrations; valid, indicating the test accurately measures the underlying theoretical construct it is designed to measure; and fair and equitable, achieved by identifying potential sources of bias, such as gender or cultural bias (Geisinger, 2016). Quality improvement is facilitated by identifying areas where tests require adjustment (e.g., by recognizing items that do not effectively discriminate between individuals). In addition, it is a health care priority for practitioners to demonstrate intervention effectiveness, often to justify funding (Doucet & Gutman, 2013). This can be achieved by utilizing valid measures of function to report service outcomes (Doucet & Gutman, 2013).
Researchers (Catchpole et al., 2019; Classen et al., 2017; Di Stefano & Macdonald, 2006, 2012; Kay et al., 2008) agree that a valid on-road test is one conducted by an extensively trained tester, utilizing a psychometrically sound procedure to score predetermined aspects of behavior on predetermined routes in traffic, in a dual-controlled vehicle. Practitioners can achieve the following important objectives by selecting on-road tests with evidence of robust psychometric properties: (a) assurance tests assess the capacities and skills required for safe and consistent driving; (b) demonstration of best practice to ensure driver and community safety; (c) determination of outcomes that are legally defensible; and (d) provision of consistent results regardless of examiner or testing center (Catchpole et al., 2019; Korner-Bitensky et al., 2006).
However, practitioners often rely on a gestalt decision, based on overall driving performance, to determines outcome (Barco, Baum, et al., 2015; Barco, Carr, et al., 2015; Dickerson, 2013; Shechtman et al., 2010; Vrkljan et al., 2013). Researchers assert that on-road assessment is unreliable if determined by global pass/fail decisions alone, even where testers are very experienced (Di Stefano & Macdonald, 2006; Shechtman et al., 2010). In Australia, significant effort has been made toward standardization of the occupational therapy on-road assessment to maximize validity and reliability (Catchpole et al., 2019; Di Stefano & Macdonald, 2006, 2010, 2012; Kay et al., 2008), particularly in Victoria where fixed, predetermined routes and standardized testing procedures are required for maintenance of an unrestricted license; the assessment is not accepted as a valid license test unless the state-sanctioned on-road assessment protocol is applied (Catchpole et al., 2019). Similar efforts have been made in the United States and Canada, where on-road assessment research has shifted toward analyzing the type of driving errors that occur while driving, applying various scoring procedures, and in some cases, utilizing specified road courses with essential components (Barco, Carr, et al., 2015). Examples include the University of Western Ontario (UWO) on-road assessment (Classen et al., 2017), the Rhode Island Road Test (RIRT; Ott et al., 2012), and the Record of Driving Errors (RODE) on-road test (Barco, Carr, et al., 2015).
Two systematic reviews of on-road tests indicate that the majority do not have sufficient evidence of validity and reliability (Bellagamba et al., 2020; Sawada et al., 2019). Sawada et al. (2019) reviewed 37 studies to determine which on-road tests are most valid and reliable. Only three met most of the study criteria for quality: Washington University Road Test (WURT)/RIRT (Hunt et al., 1997; Ott et al., 2008), Test Ride for Investigating Practical fitness-to-drive (TRIP; De Raedt & Ponjaert-Kristoffersen, 2001), and Performance Analysis of Driving Ability (P-Drive; Patomella et al., 2010). WURT/RIRT had the highest quality items with regard to reliability, and P-Drive had the highest quality items with regard to validity (Sawada et al., 2019). Bellagamba et al. (2020) agreed that WURT/RIRT, TRIP, and P-Drive were among the five best performers in terms of quality of evidence. Both systematic reviews identified P-Drive as a potential “gold-standard” test because: data collected with it have been shown to be valid and reliable; it allows trichotomization via upper and lower cut-off scores; it targets a broader clinical population; it is the most studied among the reviewed on-road tests; and there is opportunity for training (Bellagamba et al., 2020; Sawada et al., 2019). Previous P-Drive research provided evidence of person response validity, internal validity and reliability, unidimensionality, construct validity, predictive validity (Patomella & Bundy, 2015; Patomella et al., 2006, 2010; Selander et al., 2011; Vaucher et al., 2015), validity in relation to theory (Patomella et al., 2006, 2010), and inter-rater reliability (Vaucher et al., 2015). Two different cut-off scores have been proposed in two Scandinavian studies: 81 (sensitivity 93%; specificity 92%; Patomella & Bundy, 2015) and 85 (sensitivity 88% and specificity 88%; Selander et al., 2011).
P-Drive was developed in Sweden. Road conditions vary between Australasia and Sweden: drivers drive on opposite sides of the road and some road rules differ (e.g., regarding yielding at some intersections). Swedish drivers encounter significant challenges due to winter snow and ice not encountered in most regions of Australasia. Higher temperatures and desert conditions are encountered in some areas of Australia. Traffic density also differs between countries. Therefore, we sought to standardize P-Drive for Australasia. The aims of this study are to: (a) investigate the psychometric properties of data gathered with the Australasian version of P-Drive; (b) determine the concordance of P-Drive scores in relation to a summed pass–fail decision regarding fitness to drive; and (c) establish cut-off scores for discriminating between fit and unfit drivers in Australia and New Zealand.
Method
The University of Sydney Human Research Ethics Committee Human Research Ethics Committee (HREC; Project Number: 2012/2812) provided approval for this study. The St Vincent’s Hospital Sydney Human Research Ethics Committee HREC (Project Number: HREC/13/SVH/294) provided ethics approval for the hospital sites. Informed consent procedures were followed: all participants were informed of the study risks and benefits and that their participation was voluntary. Data were de-identified and securely managed and stored according to the HREC-approved procedures.
Participants
This prospective study was conducted in 10 driving clinics in Australia and New Zealand. Hospital and community-based driving clinics were eligible for inclusion if they provided medical fitness-to-drive assessments conducted by occupational therapists who were certified driving assessors (practitioners). Of the 12 clinics approached, 10 agreed to participate. These were in Melbourne, Sydney, Perth, Auckland, Wellington, and Hamilton: P-Drive was administered by practitioners in each clinic (n = 16).
The sample consisted of 134 participants aged 18 to 91 (mean age 68), referred for a fitness-to-drive assessment (power analysis (Cohen, 1988) indicated the smallest sample size for the required statistical power and effect size was 130). Participants were included if English was their first language and vision met license authority standards. Completion of at least 1-year of secondary school was required to ensure reduced literacy was not a confounding factor in the results of cognitive-capacity screening. Participants were excluded if they had a psychiatric illness, aphasia, or developmental delay as these may be confounding factors.
P-Drive was developed for the evaluation of drivers with cognitive impairment (Patomella et al., 2010). Therefore, participants aged 18 to 65 were included in the study if they had a diagnosis that potentially impacted cognitive capacity for driving (e.g., stroke). All participants aged 65+ (n = 89) were included with any diagnosis due to the potential for age-related cognitive impairment and increased crash risk for this group (Baldock et al., 2016). The older driver group included drivers with physical deficits alone (n = 7) and drivers referred due to unsafe driving without a formal diagnosis (n = 9). Participants completed the Mini-Mental State Examination-2 Standard Version (MMSE-2:SV; Folstein et al., 2010), a 30-point standardized assessment of cognitive status, to describe cognitive status. A cut-off score of ≤24 (Piersma et al., 2018; Versijpt et al., 2017) indicated 34 participants (25%) had cognitive impairment (range, 11–24; SD = 3.49). Six participants declined to participate. Of the 142 who agreed, five did not meet the study criteria and one withdrew after failing the assessment. The final sample (40 females and 94 males) is described in Table 1.
Participant Diagnoses.
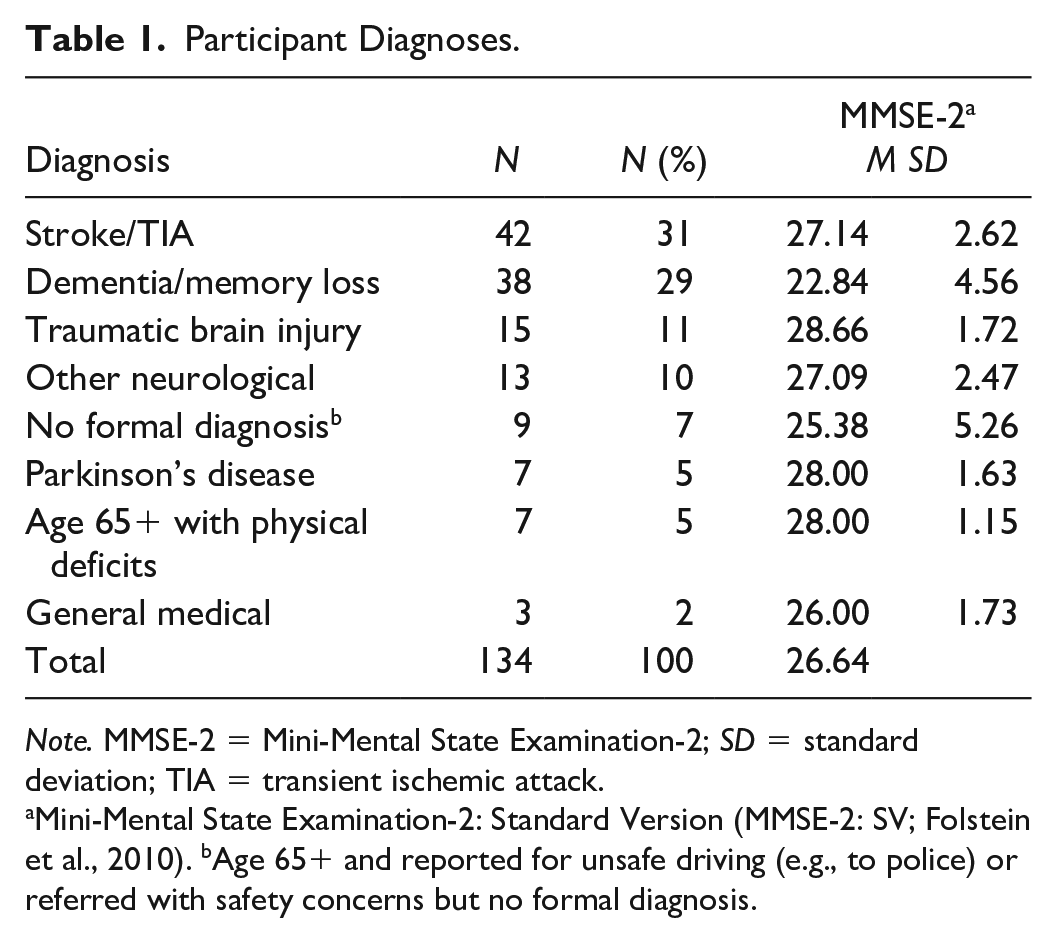
Note. MMSE-2 = Mini-Mental State Examination-2; SD = standard deviation; TIA = transient ischemic attack.
Mini-Mental State Examination-2: Standard Version (MMSE-2: SV; Folstein et al., 2010). bAge 65+ and reported for unsafe driving (e.g., to police) or referred with safety concerns but no formal diagnosis.
Instrument
P-Drive (Patomella et al., 2006, 2010) is a standardized observational assessment that provides equal-interval measures of driving ability developed for technologically advanced driving simulators and on-road assessment. P-Drive’s theoretical base is situated in occupational therapy theory (Taylor, 2017). A top-down approach is taken for measuring performance in actions that reflect driving performance based on activity analysis, rather than underlying capacities (Patomella et al., 2006). The hierarchical order of items is based on Michon’s (1985) psychological theory about decision-making on-road and driving-related theories of attention and information processing (Lundqvist et al., 2000). The test assumption is that items requiring attention and rapid information processing are more challenging than items requiring maneuvering, and items demanding tactical decisions are more demanding than items requiring operational decisions (Patomella et al., 2006). The P-Drive item hierarchy complies with this hierarchical model of driver behavior in previous research, indicating evidence of construct validity (Patomella et al., 2010).
The Swedish version of P-Drive was modified by the third author for the Australian and New Zealand context: two items were removed due to road law differences. The remaining 25 items comprise four categories: Follows regulations, Maneuvers, Orients, and Attends and Acts (Patomella et al., 2010). Items are rated on a 4-point ordinal scale to measure the safety and quality of performance during the on-road test (4 = competent and safe, 3 = questionable performance, 2 = problematic, and 1 = incompetent and unsafe performance). Administrators score the worst driving performance observed for each item. For example, for the item “Obeying stop signs and traffic lights,” if three of four stop signs are obeyed, the one failure to stop is scored. Scoring takes place following the completion of the on-road assessment. The summed maximum raw score is 100.
Procedure
Each participant attended a clinical assessment and a 60-min on-road assessment conducted by the same practitioner consecutively on the same day; 1 clinic conducted these assessments 1 week apart (n = 22 participants). Participants completed MMSE-2:SV (Folstein et al., 2010). Vision and physical function were also tested to ensure drivers complied with licensing criteria and to determine if vehicle modifications were required. On-road assessments were conducted in dual-controlled vehicles with a qualified driving instructor in the front to provide route instructions and monitor safety, and a practitioner in the rear recording performance. Assessments commenced in light traffic to allow drivers to become familiar with the vehicle and test conditions, then progressed to complex traffic after approximately 10 min. Feedback on driving performance was provided (if required) after approximately 20 min. Where vehicle modifications were required, the assessment remained in light to medium traffic. Final fitness-to-drive determinations were based on practitioner judgment, taking into consideration overall driving performance, the need for driving instructor intervention, driver awareness, and the number and severity of errors.
The following pass–fail definitions were applied: “Pass” (criteria met for safe and legal driving with no intervention), “Conditional Pass” (criteria met for safe and legal driving without intervention but license restrictions required), “Intervention Required” (e.g., driving lessons), and “Fail” (criteria not met for safe and legal driving with driving cessation advised). Data for the pass and conditional pass groups were collapsed for the analysis because both groups achieved the criterion for safe driving, resulting in final “pass,” “fail,” and “further testing” categories. Consistent with clinical practice in Australia and New Zealand (Catchpole & Di Stefano, 2018; Kay et al., 2008; Occupational Therapy Board of New Zealand, 2022), the assessment outcome was determined collaboratively with the driving instructor and communicated to the participant immediately following the assessment, (prior to P-Drive scoring for this study).
Training and Route Design
The authors provided practitioners with training in research protocols and P-Drive administration, and provided support during the data collection period, to ensure consistency of P-Drive scoring. This included training in standardization of on-road assessment procedures and route design based on professional guidelines and recommendations made by researchers (Catchpole & Di Stefano, 2018; Di Stefano & Macdonald, 2010, 2012; Fields et al., 2018; Kay et al., 2008). Practitioners were required to design routes that met the compulsory and desirable route inclusions outlined by Di Stefano and Macdonald (2012). These guidelines specify road features, intersection contexts, driving tasks, and environmental conditions (Di Stefano & Macdonald, 2012). Practitioners designed a set-driving route in consultation with the driving instructors (n = 21), who rated the challenges of each participant route to describe the location, complexity, traffic conditions, road surfaces, and special challenges (e.g., road works). Practitioners in four clinics conducted assessments over varying routes. Compliance of route design was ensured via a review of the practitioner driver assessment report, a map of set routes, and the driving instructor route rating scales, so comparisons could be made across centers. The first author reviewed all data gathered to ensure participants met the study criteria, routes were sufficiently complex (i.e., met the route inclusions), and the assessment procedures were conducted according to study protocols.
Statistical Analysis
We applied Rasch analysis to examine the evidence for construct validity of data gathered using the program Winsteps Version 5.1.0 (Linacre, 2021). Because it generates true interval measures, Rasch overcomes the problem that test items are unlikely to be of equal difficulty and the relative distance between levels of raw (ordinal) data unlikely to be equal, precluding the ability to simply add points. Rasch allows researchers to order persons according to their ability and items according to their difficulty, along the same linear scale (Bond, 2003; Bond et al., 2021; Boone, 2016). Raw test scores are converted into log odds ratios along the real number line by estimating item difficulty and person ability parameters (Bond et al., 2021).
The Rasch model assumes simply that (a) participants with greater ability have a greater likelihood of passing difficult items and (b) easy items are easy for all people (Bond et al., 2021; Boone, 2016). Rasch analysis tests the degree to which these assumptions are met, in part, through the generation of person and item infit and outfit goodness-of-fit statistics. Fit statistics are expressed in mean square (MnSq) and standardized values (ZStd) and provide evidence of unidimensionality of the construct (i.e., construct validity; Bond et al., 2021). MnSq values of ≤1.5 combined with a ZStd between –2 and +2 for both infit and outfit values were considered an acceptable fit to the model (Smith, 1996; Wright & Linacre, 1994).
Winsteps also generates a principal components analysis (PCA) of standardized residuals to evaluate the strength of any additional dimensions in the data, further investigating unidimensionality (Bond et al., 2021). We considered that evidence of unidimensionality was strong if in the first contrast items and persons explained at least 60% of the variance, the unexplained variance was <5%, and the eigenvalue was ≤3 (Linacre, 2014).
We examined internal reliability, including the ability of a test to separate participants into levels of ability, via strata calculated using the Rasch-generated separation index using the following formula: H = (4G + 1)/3 where G = the separation index. We calculated strata rather than reporting only the separation index because our sample had a number of people with relatively low ability (Fisher, 1992). Because of the potentially severe consequences of the loss of a driver’s license, we sought three strata as the minimum acceptable number. More strata indicate that an assessment tool can distinguish more levels of ability.
We calculated a Pearson correlation coefficient to investigate the relationship between Rasch-analysis-derived interval measures and raw ordinal scores. A high correlation (≥.7) suggests that the raw scores could be used to summarize the data retrieved from P-Drive (Fisher, 1992).
We used receiver operating characteristic (ROC) curves to investigate the predictive validity of data gathered with P-Drive and to set the cut-off scores, calculated for both raw and interval level P-Drive scores using IBM SPSS Statistics Version 20 (IBM Corporation, Armonk, NY). The diagnostic accuracy of the scores is indicated by the area under the curve (AUC). An AUC close to 1.0 indicates that P-Drive can reliably distinguish between the pass and fail groups (Zou et al., 2007). An AUC of 0.50 indicates that P-Drive is no better than chance. Before calculating the ROC curves, we dichotomized the outcomes of the practical on-road test to pass or fail; drivers with a conditional pass were deemed safe because they met the criteria for safe and legal driving. Drivers referred for driving lessons failed.
Results
Of the 134 participants, 49% passed the driving assessment, 11% required further testing (including 5 participants prescribed vehicle modifications) and intervention, and 40% failed.
Construct Validity
We examined goodness-of-fit statistics to determine how well data from each item and participant conformed to the Rasch model assumptions. The Rasch analysis of the 134 P-Drive protocols showed that data from 95% of the practitioners were within the acceptable range for goodness of fit, showing evidence of person response validity. We examined strata to determine how reliably the test identified statistically distinguishable groups (Fisher, 2007). We identified more than four levels of driving ability (strata = 4.43). Outfit data from two items (Item 1 “Steering” and Item 3 “Using pedals”) did not meet the desired criterion for goodness of fit, indicating too great a discrepancy between expected and observed scores (see Table 2).
Goodness-of-Fit Statistics, Item Measures (IM), and Standard Error (SE) for P-Drive Items.
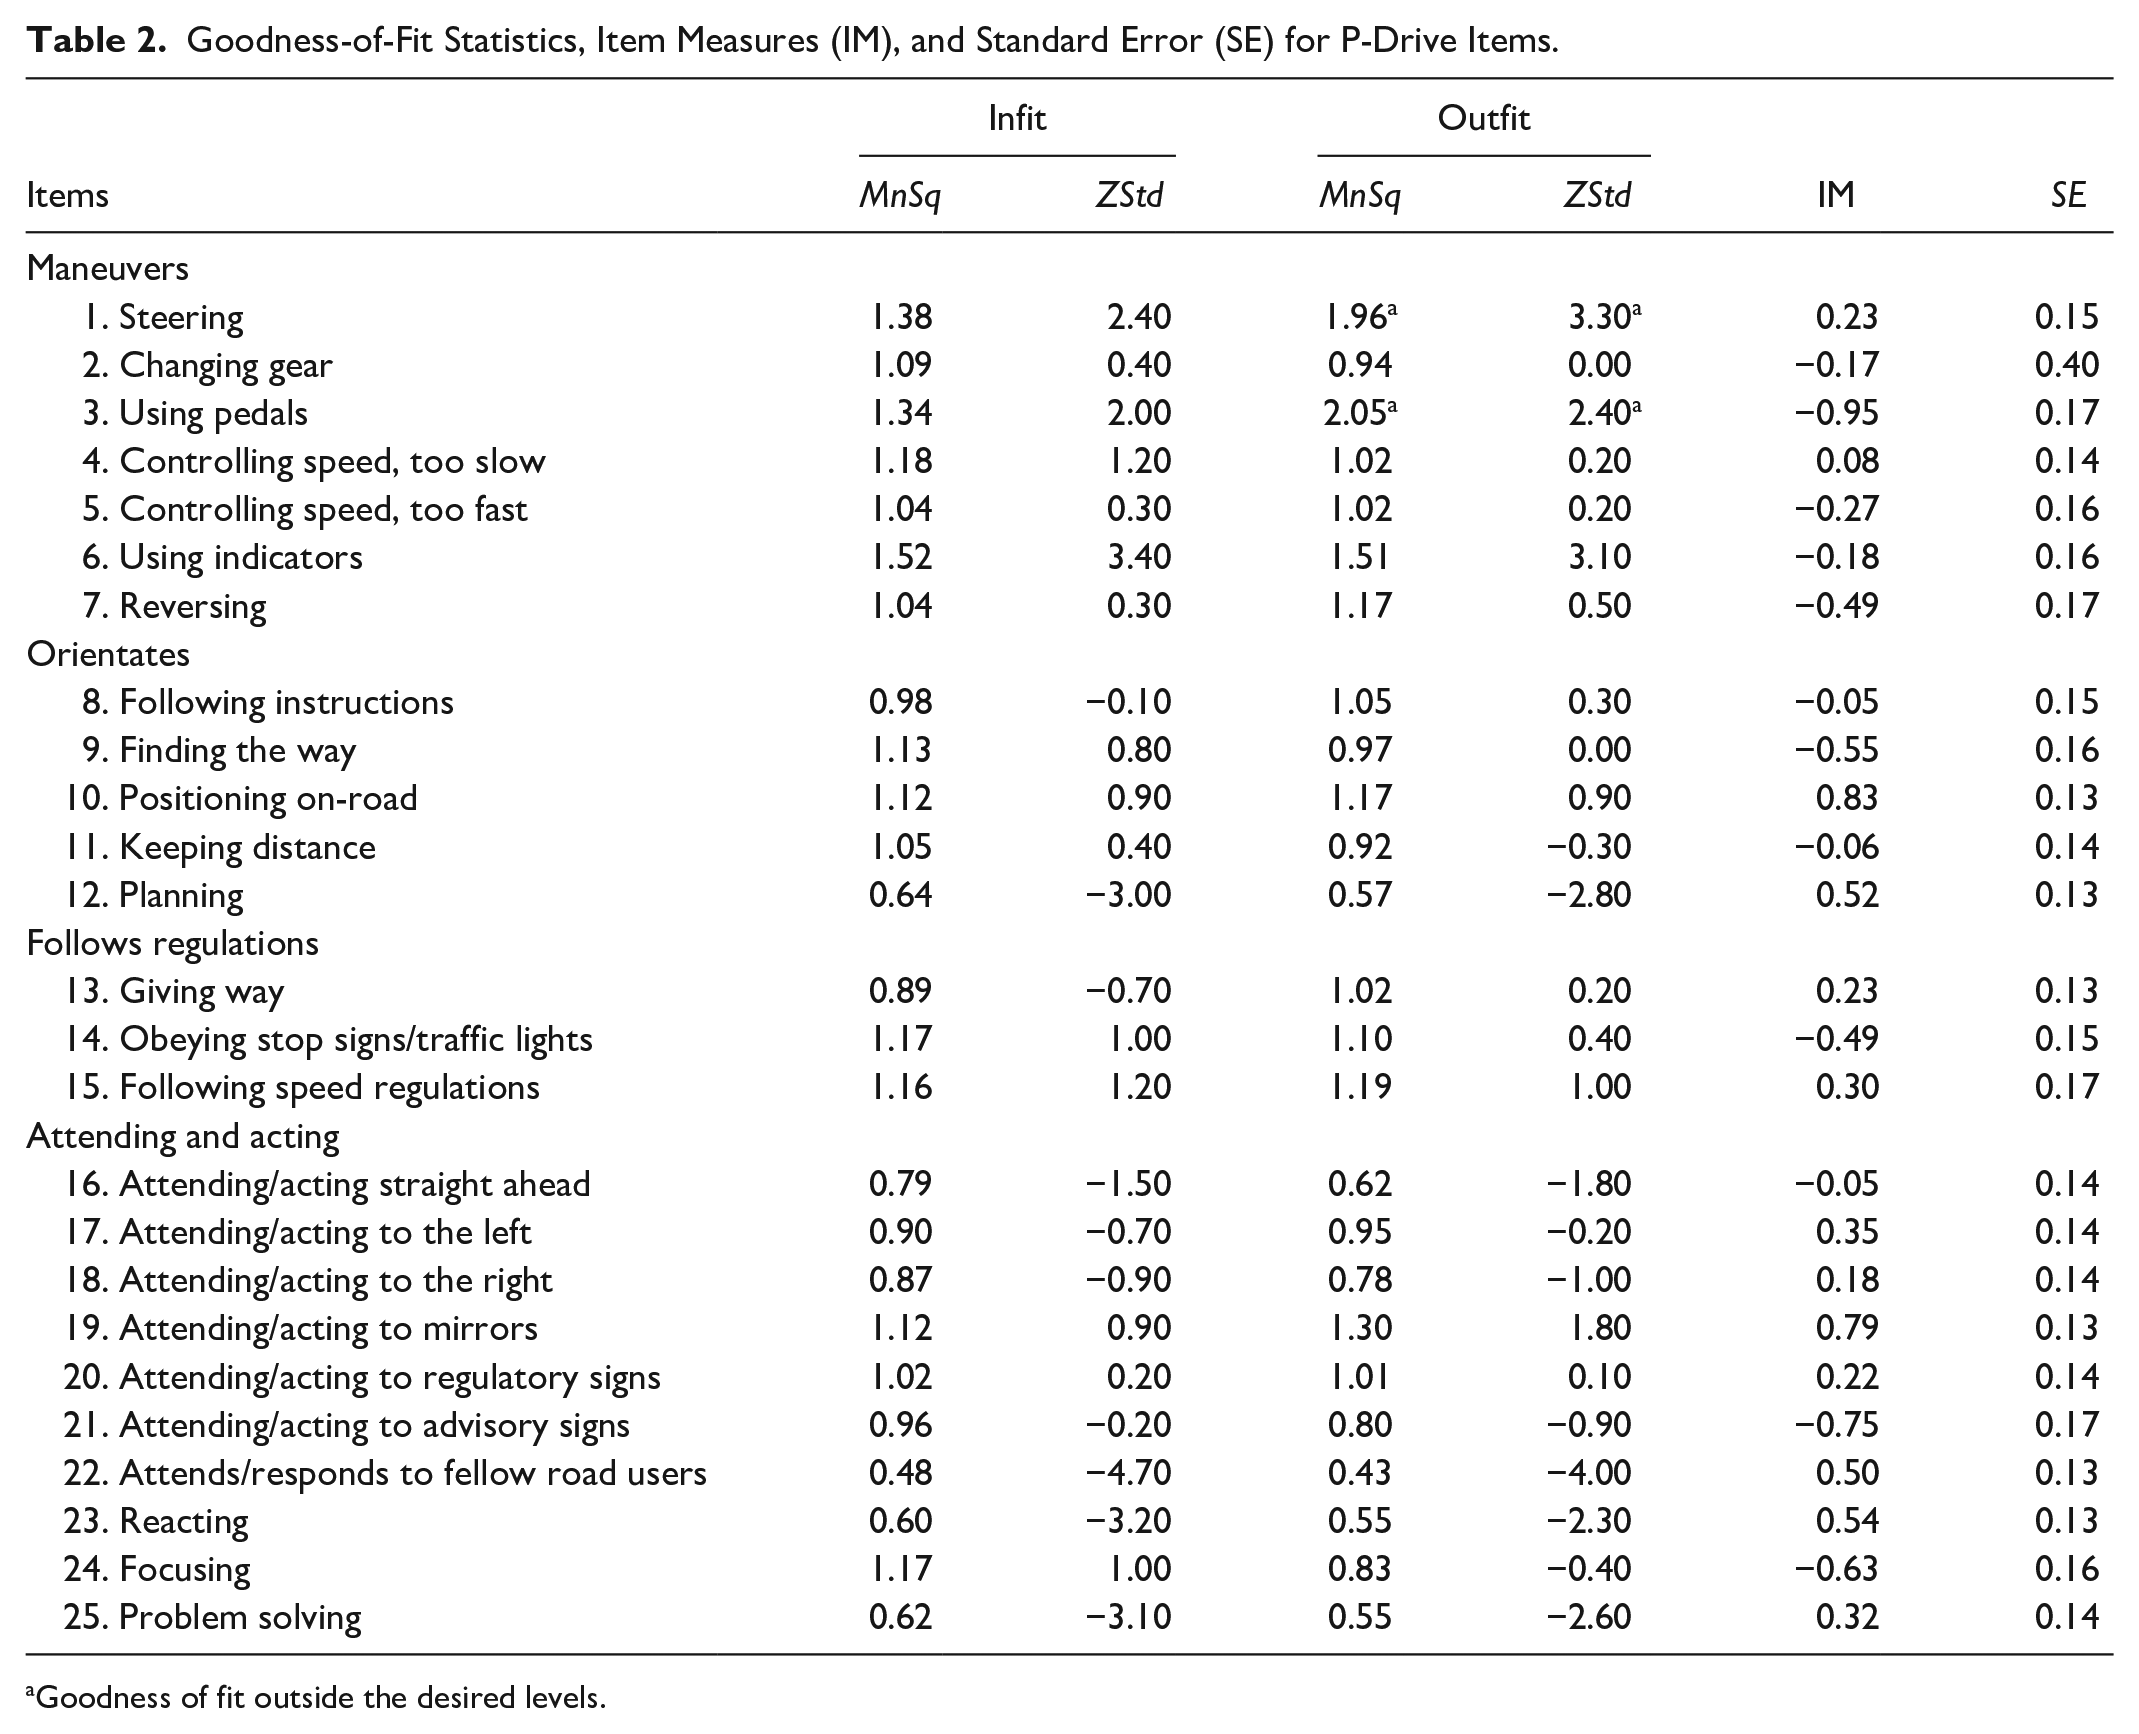
Goodness of fit outside the desired levels.
We examined the PCA to investigate the unidimensionality of the data. The PCA revealed that items and persons explained 76.2% of the variance of the residuals; the unexplained variance explained by the first contrast was 2.8% and the associated eigenvalue was 2.9, all within acceptable range. The correlation between the P-Drive raw scores and the interval measure scores yielded by Winsteps was r = .91, indicating that raw scores and interval scores from P-Drive are strongly related. The mean P-Drive raw score for clients who passed the on-road assessment was 92.4 of 100 (SD = 6.51); for those who failed, the mean was 67.7 (SD = 15.18).
We examined item hierarchy to determine the extent to which the overall spread of items matched participant ability. Figure 1 comprises a Wright map that shows the hierarchy of P-Drive items and compares item difficulty with driver ability.
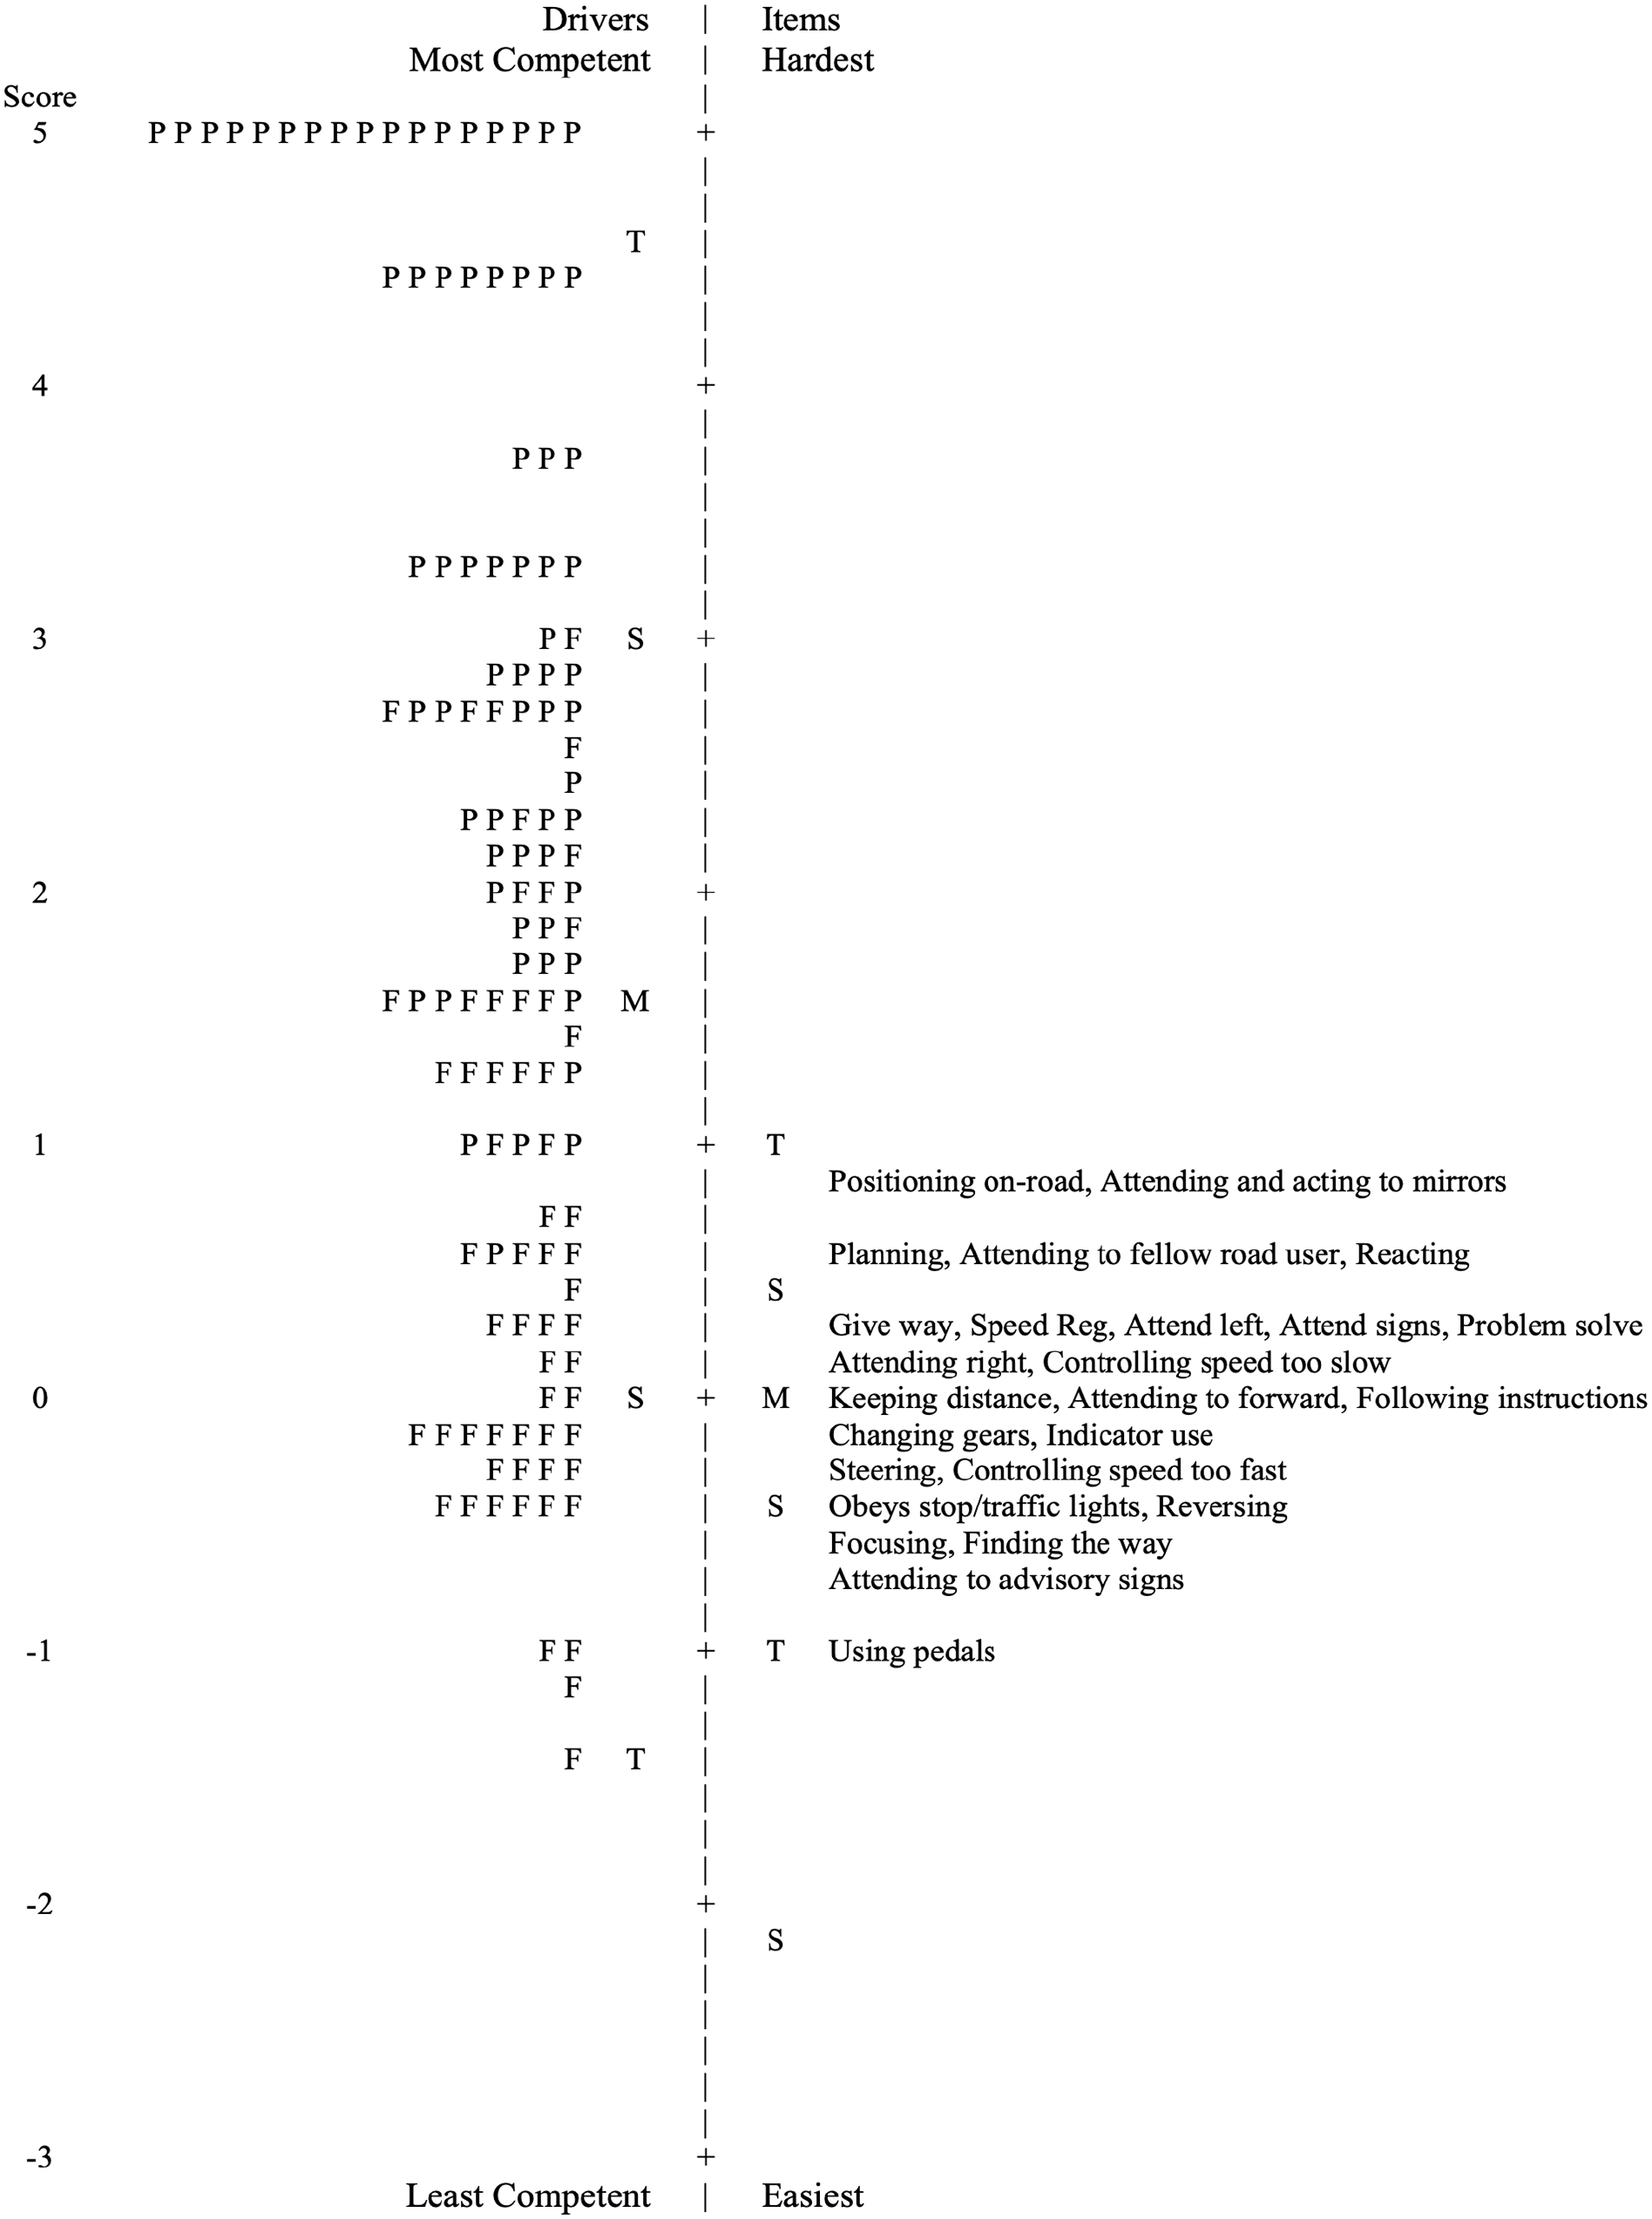
Wright Map of Driver Ability and Item Difficulty for P-Drive
Concordance
We examined evidence of the concordance of P-Drive data with overall assessment pass/fail rates by establishing optimal cut-off scores via ROC curves. When inspecting the AUC in the ROC analysis, the P-Drive raw score and the Rasch-generated interval measures were almost identical (0.98 and 0.97, respectively) and very close to 1, showing evidence of the ability of P-Drive scores to distinguish between those who pass and those who fail. Analysis of sensitivity and specificity showed that a cut-off raw score of 85 was optimal, yielding sensitivity of 0.88 (i.e., 88% of drivers expected to fail did fail) and specificity of 0.88 (i.e., 88% of drivers expected to pass did pass).
Discussion
The purpose of this study was to investigate the evidence for construct validity of data gathered with the Australasian version of P-Drive, to determine the concordance of P-Drive scores in relation to a summed pass–fail decision, and to establish cut-off scores for this region. Our data yielded evidence for internal and external construct validity and regional cut-off scores were established. Fit statistics were within acceptable ranges for 23 of 25 items. The outfit statistics for two items (5%), “Steering” and “Using pedals,” failed to conform to Rasch model assumptions. These items are about operating car controls in a competent and secure manner; they are relatively easy items on the P-Drive item hierarchy but represent skills that are critical for safe driving. Thus, we retained these items. Importantly, outfit statistics are unweighted and sensitive to outliers. The larger-than-desired outfit statistics for these easy items were caused by relatively skilled drivers who received lower-than-expected scores on these items. Examination of the data revealed that a few raters awarded scores of “3” on these items when a “4” rating was expected. This suggests that the P-Drive manual description should be clarified to prevent raters from scoring too severely on these items.
The Wright map of items and drivers indicates that P-Drive differentiates only less competent drivers. That is, the item difficulty most closely matched the ability of drivers who failed the on-road assessment. This is not problematic because the purpose of the test is to identify drivers who are safe. Measurement precision is unnecessary to discriminate between “good” and “excellent” drivers. Consistent with previous research (Patomella et al., 2006, 2010), items that required anticipating and fast decision-making were more challenging than those related to the operation of vehicle controls.
We set the raw cut-off score for the Australasian version of P-Drive at 85, similar to the cut-off proposed in the two Scandinavian studies (81 and 85; Patomella & Bundy, 2015; Selander et al., 2011). The Australasian version has two fewer items than the Scandinavian version, yielding a total score of 100 compared with 108. While we might have used 81 as the cut-off, researchers (Bellagamba et al., 2020; Patomella & Bundy, 2015) proposed that, rather than using a single cut-off score, a “gray zone” between 81 and 85 should be considered as a range in which practitioner judgment is particularly critical: in-depth clinical analysis and reflection is advised before deciding. A gray zone may encourage the practitioner to make a more in-depth clinical analysis before making a decision (Bellagamba et al. 2020). This zone may also be utilized as a gateway for interventions that aim to maintain driving capacity or facilitate cessation of driving (Bellagamba et al., 2020; Laycock, 2011; Molnar et al., 2006). Further research is required to confirm the proposed cut-off scores for Australia and New Zealand. Nonetheless, any cut-off score should be applied in the context of practitioners’ judgment and other clinical indicators.
P-Drive allows meaningful comparison between individuals and items because function can be measured on an interval scale. For example, if person A has a raw score of 72 and person B has a raw score of 82, it can be inferred that person B is located higher on the ability scale than person A, and the difference of 10 points has a consistent meaning among participants. P-Drive also assists practitioners in analyzing and describing the quality of driver performance and impact on the activity (Patomella et al., 2010), so outcome decisions can be consistently justified and explained to clients. Bellagamba et al. (2020) and Sawada et al. (2019) reported none of the reviewed on-road tests examined measurement error, which is important for verifying that score change is due to the intervention rather than research error. The advantage of Rasch analysis is that a standard error is generated for each person, which does in fact enable measurement error to be examined for P-Drive (see Table 2 and prior studies; Patomella et al., 2006, 2010).
Test routes need to be sufficiently complex to unmask at-risk driving behaviors (Di Stefano & Macdonald, 2012; Kay et al., 2008), so it is important that practitioners apply route-design practice guidelines appropriate for their region in conjunction with P-Drive. The exclusion of participants with physical deficits alone under age 65 likely resulted in lower numbers of participants requiring vehicle modifications in this study (n = 35). Initial assessment of novice drivers and drivers requiring vehicle modifications is conducted in light to medium traffic to avoid over-challenging the driver, and intervention will be required. Nevertheless, P-Drive provides a useful baseline assessment for this group because performance gaps can be identified to address in interventions, and post-intervention improvement and competence can be measured. The ability of P-Drive to differentiate performance among drivers at the lower end of the performance spectrum indicates its potential application in evaluating intervention efficacy. P-Drive test–retest reliability has not been examined to date; this is an important area for future research (Bellagamba et al., 2020).
Occupational therapists in this study determined fitness to drive based on a gestalt decision, using pass–fail criteria provided in conjunction with P-Drive scoring. The extent to which P-Drive contributed to the practitioner’s final pass–fail determinations is unclear. Furthermore, although practitioners received training in P-Drive administration, none had previously used standardized scoring procedures for determining assessment outcomes. Due to financial and practical limitations, only one assessor rated on-road performance for each participant. The use of two raters, including one who was unaware of P-drive results and who utilized an alternative on-road scoring procedure for comparison, would have increased the evidence for the reliability of the findings. This is recommended for future P-Drive research. On-road assessments were conducted in diverse locations. While all research sites were based in cities and route design followed professional standards and researcher recommendations, conditions would likely have differed, potentially affecting validity.
Conclusion
P-Drive offers practitioners a valid and reliable way to measure driving performance on-road in conjunction with their own clinical judgment and other clinical indicators. The test has been modified for the Australasian context and cut-off scores proposed for this region. P-Drive should be used by occupational therapy driving assessors who have attended formal training to ensure the occupational therapist is consistent with the Rasch model expectations of item and person fit. Training is available via https://driverhealth.com.au/ldcourses/performance-analysis-of-driving-ability-p-drive-online-certification-course/
Footnotes
Acknowledgements
The material in this paper was presented at the Occupational Therapy Australia 30th National Conference and Exhibition, held from June 21 to 23, 2023, at the Cairns Convention Centre, Queensland, Australia.
Declaration of Conflicting Interests
The author(s) declared the following potential conflicts of interest with respect to the research, authorship, and/or publication of this article: The third author (Ann-Helen Patomella) is the P-Drive author. P-Drive is not for sale although training courses are offered. The first author’s (Beth Cheal) company, Institute of Drive Health, conducts online training in P-Drive administration in conjunction with the third author.
Funding
The author(s) received no financial support for the research, authorship, and/or publication of this article.
Research Ethics Section and Patient Consent
The University of Sydney Human Research Ethics Committee (Project Number: 2012/2812) provided approval for this study. The St Vincent’s Hospital Sydney Human Research Ethics Committee (Project Number: HREC/13/SVH/294) provided ethics approval for the hospital sites. The procedures followed in this study were in accordance with the ethical standards of the approving Human Research Ethics Committees and the revised (2000) Helsinki Declaration.