



Abstract

What to do if an xtitle() is wanted but not allowed?
With some
The
A double rule applies to most of the subcommands in this second group.
This rule flouts long-standing mathematical conventions: a vertical axis is often denoted by y, and a horizontal axis is often denoted by x. But the point is to make it easier to flip in Stata between
That said, this double rule raises the question: what do you do if you want a title to go where the x-axis title would have been, given that the
The documentation does give many examples with standard options
The main point of this tip is different. The standard title options also include
If you wish to confirm your understanding of the possibilities, add these options to any

Note that the text
These options were available in Stata’s graphics before it was massively rewritten for Stata 8, and they are still available.
The remainder of this tip gives some simple concrete examples. Note that these options are also available for
Examples with graph bar, graph hbar, and graph dot
The


Simple bar chart of mean miles per gallon for various categories of repair record. The point of interest is the use of
We could draw a horizontal equivalent of figure 1 using
Let us explore a different way to show the same results using


The results of figure 1 shown differently using a (vertical) dot chart
The main attraction of a dot chart is allowing focus on a comparison of results with each other. Evidently, a bar chart like figure 1 uses 0 as the baseline: statistical results are all shown by bar heights with 0 as the reference base. (By the way, it is often stated as dogma that bars on a bar chart should start at 0, but bars may defensibly start at any relevant base, such as 1 whenever parity is a reference level, 100 for values at a base date of some indexed time series, freezing temperature 32° Fahrenheit, or the mean or another level of some outcome.)
In the case of figure 1, bars start at 0, which matches a common convention. The chart produced may even be the display that researchers or their readers want or expect. But the design wastes space and distracts attention from what is likely to be the question of most statistical and scientific interest: comparison of each group’s result with that of other groups.
A further merit of dot charts is that they can be used with scales such as logarithmic or reciprocal scales on which 0 is not plottable. There might be a case to use 1 or 100 (say) as the reference level, but otherwise, dot charts may work better with such scales.
Such dot charts are often called Cleveland dot plots, which honors the advocacy of William S. Cleveland (1984, 1993, 1994). As often, even an innovative design rarely lacks precedents. See, for example, Snedecor (1937) and later editions until Snedecor and Cochran (1967). For more discussion and examples of dot charts in a Stata context, see Cox (2008, 2024).
Naming these dot charts for Cleveland also serves a purpose of distinguishing them from dot plots that are pointillist displays of frequency distributions and are, in turn, often called Wilkinson dot plots. Stata’s own
Figure 3 is a box plot for the same variables. A box plot shows median and quartiles of an outcome variable. Beyond the quartiles, many different conventions exist, but

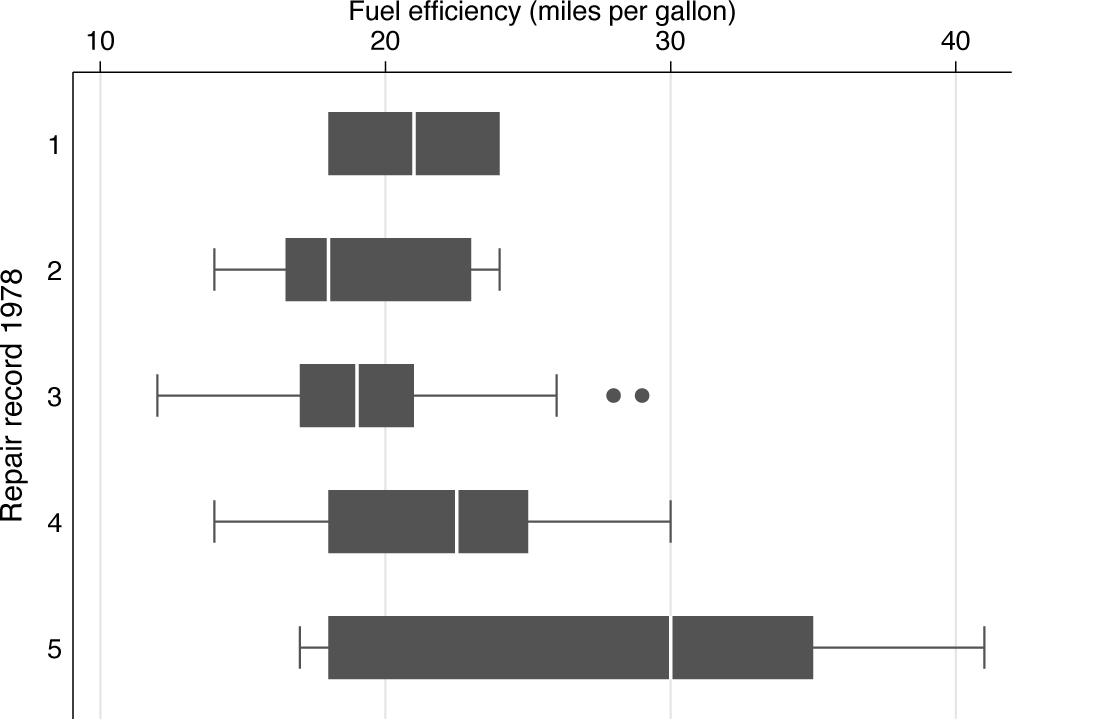
Box plots for miles per gallon given repair record. The point of interest is the use of
The detail arising from this tip should now be familiar. A call to
A further (entirely optional) twist is that the y axis has been shifted to the top of the graph. That can sometimes look better for graphs with some table flavor. Just as with tables, it is customary to explain columns in headers (Cox 2012).
An extra comment about the data here: The display for repair record 1 may seem puzzling. Drilling down to the data resolves the puzzle. There were just two data points for that category. The precise rules imply that those two data points are reported as the quartiles; the median is reported as halfway between them. There were no other data points to be reported as beyond the quartiles either as individual data points or as implied by whiskers. The scope for box plots to be puzzling is even greater than this, but that really is another story.
If you wanted to use vertical box plots, the difference is essentially that the categorical variable may be explained in a title at the bottom of the graph. Here is command syntax, which you may wish to apply yourself.

This tip is a reminder of four pairs of options for placing marginal titles at the top, left, bottom, and right of any graph. Such options may be used generally, but they offer direct solutions to a specific problem. With commands like
Examples to make that concrete have been used to underline other points.
Dot charts can often work as well or better than bar charts, particularly if we focus on comparing values with each other rather than comparing values with some reference base, usually 0, or if logarithmic or reciprocal scales make bar charts problematic.
Such dot charts may be vertical and may explicitly exclude showing 0 if that lies some way outside the observed range.
Charts that have table flavor may look better with horizontal axis material at the top.
Supplemental Material
sj-txt-1-stj-10.1177_1536867X251398633 - Supplemental material for Stata tip 165: Marginal titles for graph bar, graph dot, graph box, and beyond
Supplemental material, sj-txt-1-stj-10.1177_1536867X251398633 for Stata tip 165: Marginal titles for graph bar, graph dot, graph box, and beyond by Nicholas J. Cox in The Stata Journal
References
Supplementary Material
Please find the following supplemental material available below.
For Open Access articles published under a Creative Commons License, all supplemental material carries the same license as the article it is associated with.
For non-Open Access articles published, all supplemental material carries a non-exclusive license, and permission requests for re-use of supplemental material or any part of supplemental material shall be sent directly to the copyright owner as specified in the copyright notice associated with the article.
