
Abstract
In this article, we describe
Keywords
Introduction
The need to assess the level of agreement between paired ordinal data arises in many validity and reliability studies. For example, one may be interested in comparing the ratings of two doctors who independently classify the illness severity of a group of patients into five categories (very mild, mild, moderate, severe, and very severe). Disagreement between the two raters may occur because they interpret the categories differently or because one of them tends to systematically rate higher or lower than the other. It may also arise from random error such as, for example, an occasional departure from the measurement protocol or a momentary distraction.
Popular methods in this context are the kappa statistic (κ) and its weighted version
Svensson’s method
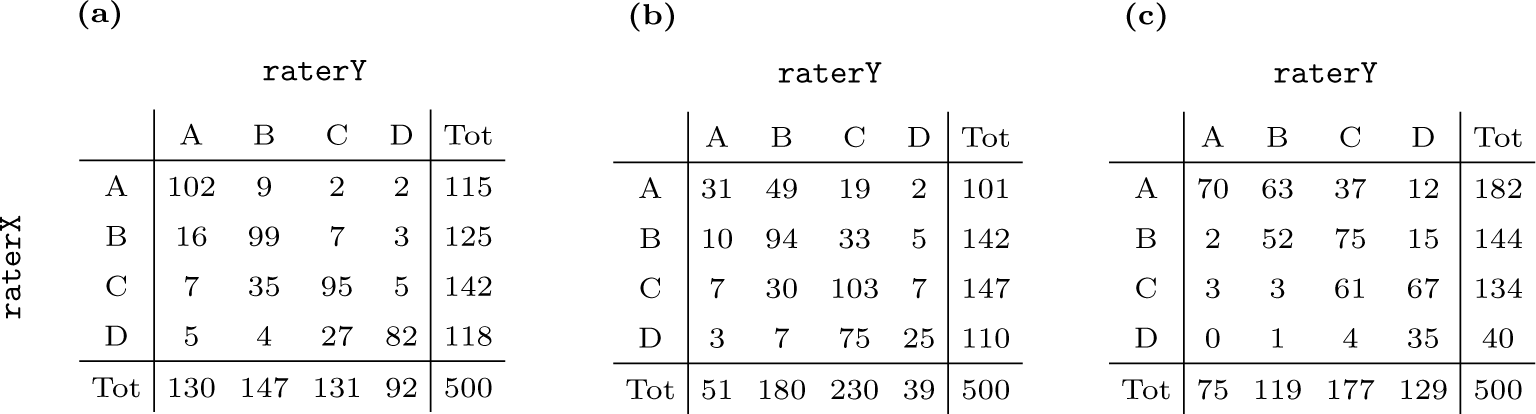
Let X and Y be two variables measured on n independent statistical units and defined on the same m-category ordinal scale, here encoded by the integers 1,…,m for simplicity. The frequency distributions of X and Y can easily be displayed via a contingency table [figure 1(a)]. Svensson (1993) uses a simple alternative representation [figure 1(b)] where the main diagonal of the contingency table is orientated as the main diagonal of a scatterplot, that is, from the lower-left to the upper-right corner. In this way, the table becomes a sort of discrete-version alternative to a scatterplot. Of course, the spacing between categories is artificial, the similarity being the diagonal line of equality. In practice, the output from
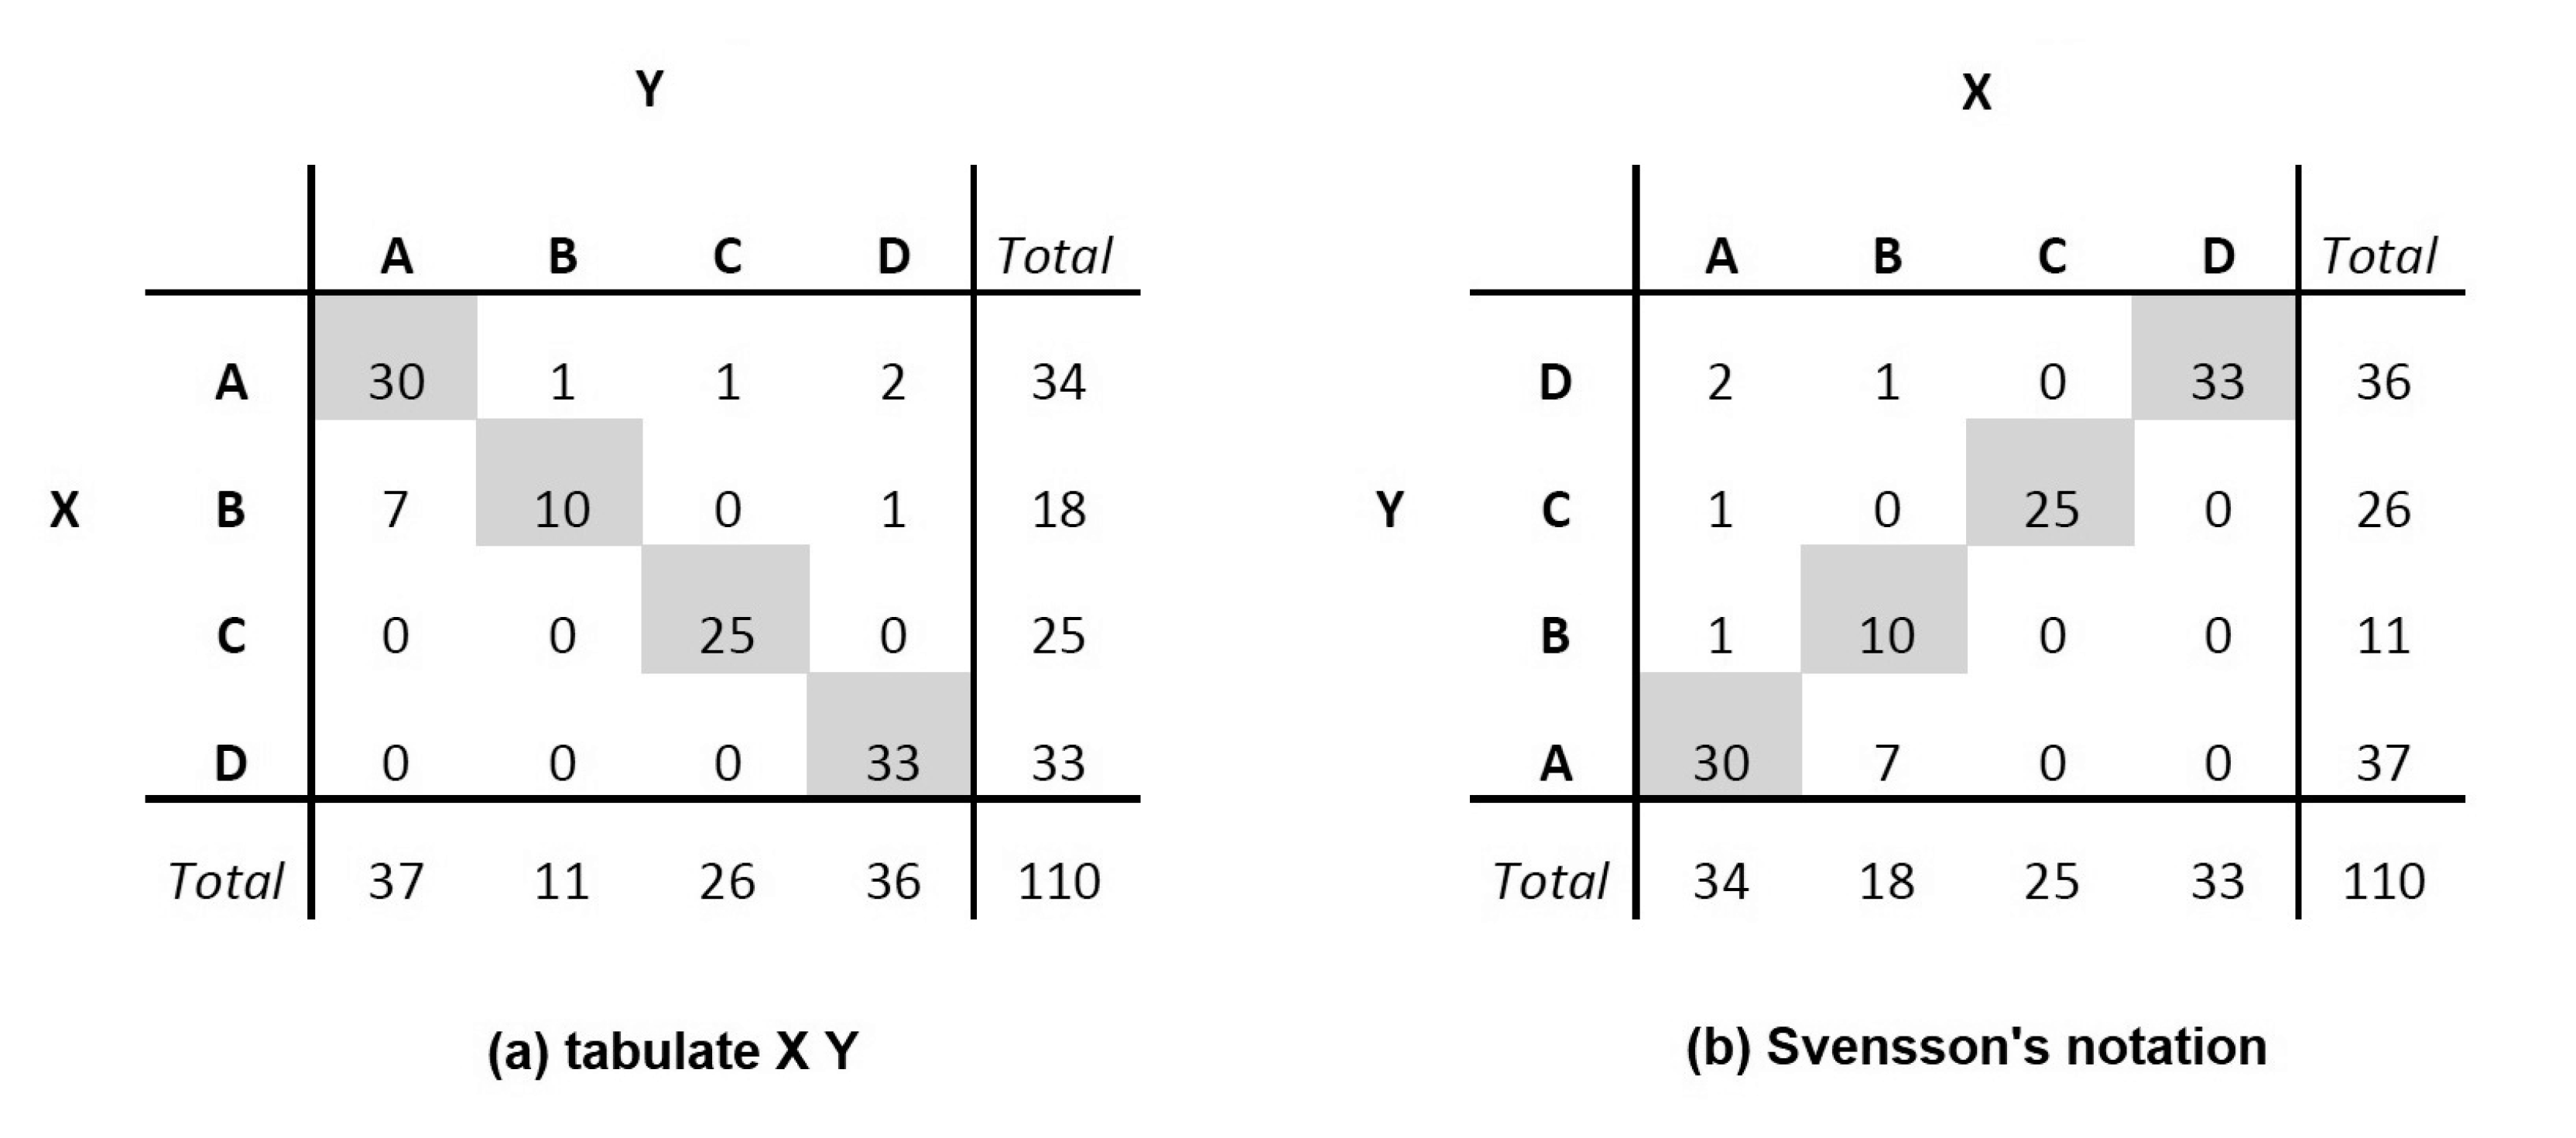
Example of a contingency table obtained with (a)
ROC curve created by
Let nij be the frequency of the pair (X = i,Y = j), where i and j ∈ {1,…, m} and
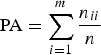
For the contingency table in figure 1(a), we have PA = (30 + 10 + 25 + 33)/110 = 89%, meaning that the values of X and Y coincide 89 out of 100 times.
The presence of systematic disagreement between X and Y leads to differences in the marginal distributions of the two variables. Svensson (1993) proposed two measures to quantify this type of disagreement: the relative position (RP) and the relative concentration (BC). RP represents the difference between p0 = P(X < Y), the probability of X taking lower categories than Y, and p1 = P(X > Y), the probability of X taking higher categories than Y. Therefore, it scan be defined as

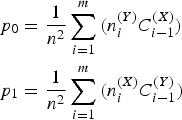
Possible values for RP range between —1 and 1, with positive values corresponding to situations in which X < Y is more likely to occur than X > Y (higher-scale categories are systematically more frequently used in Y than in X). Equivalently, RP can be written in terms of individual observations as
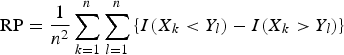
where I(⸳) is an indicator function such that I(A) = 1 if the condition A is satisfied and 0 otherwise. Interestingly, as we will show later, RP can also be seen as a special case of Somers’s D.
RC measures whether the marginal distribution of Y is systematically more concentrated toward central categories than the marginal distribution of X. It is defined as
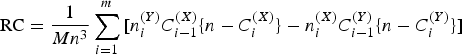
where M is a normalizing constant equal to min
The relative-rank variance
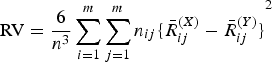

The higher the value of RV, the more dispersion there is in the observations. Values below 0.1 are generally considered as an indication of negligible individual variation.
Previous simulation studies have shown that RP and RC are approximately normally distributed even for small sample sizes (Kendall 1945). However, Svensson (1993) reported that both exact and asymptotic estimations of the standard errors of RP, RC, and RV are very cumbersome and recommended using bootstrap or jackknife methods (Efron 1981).
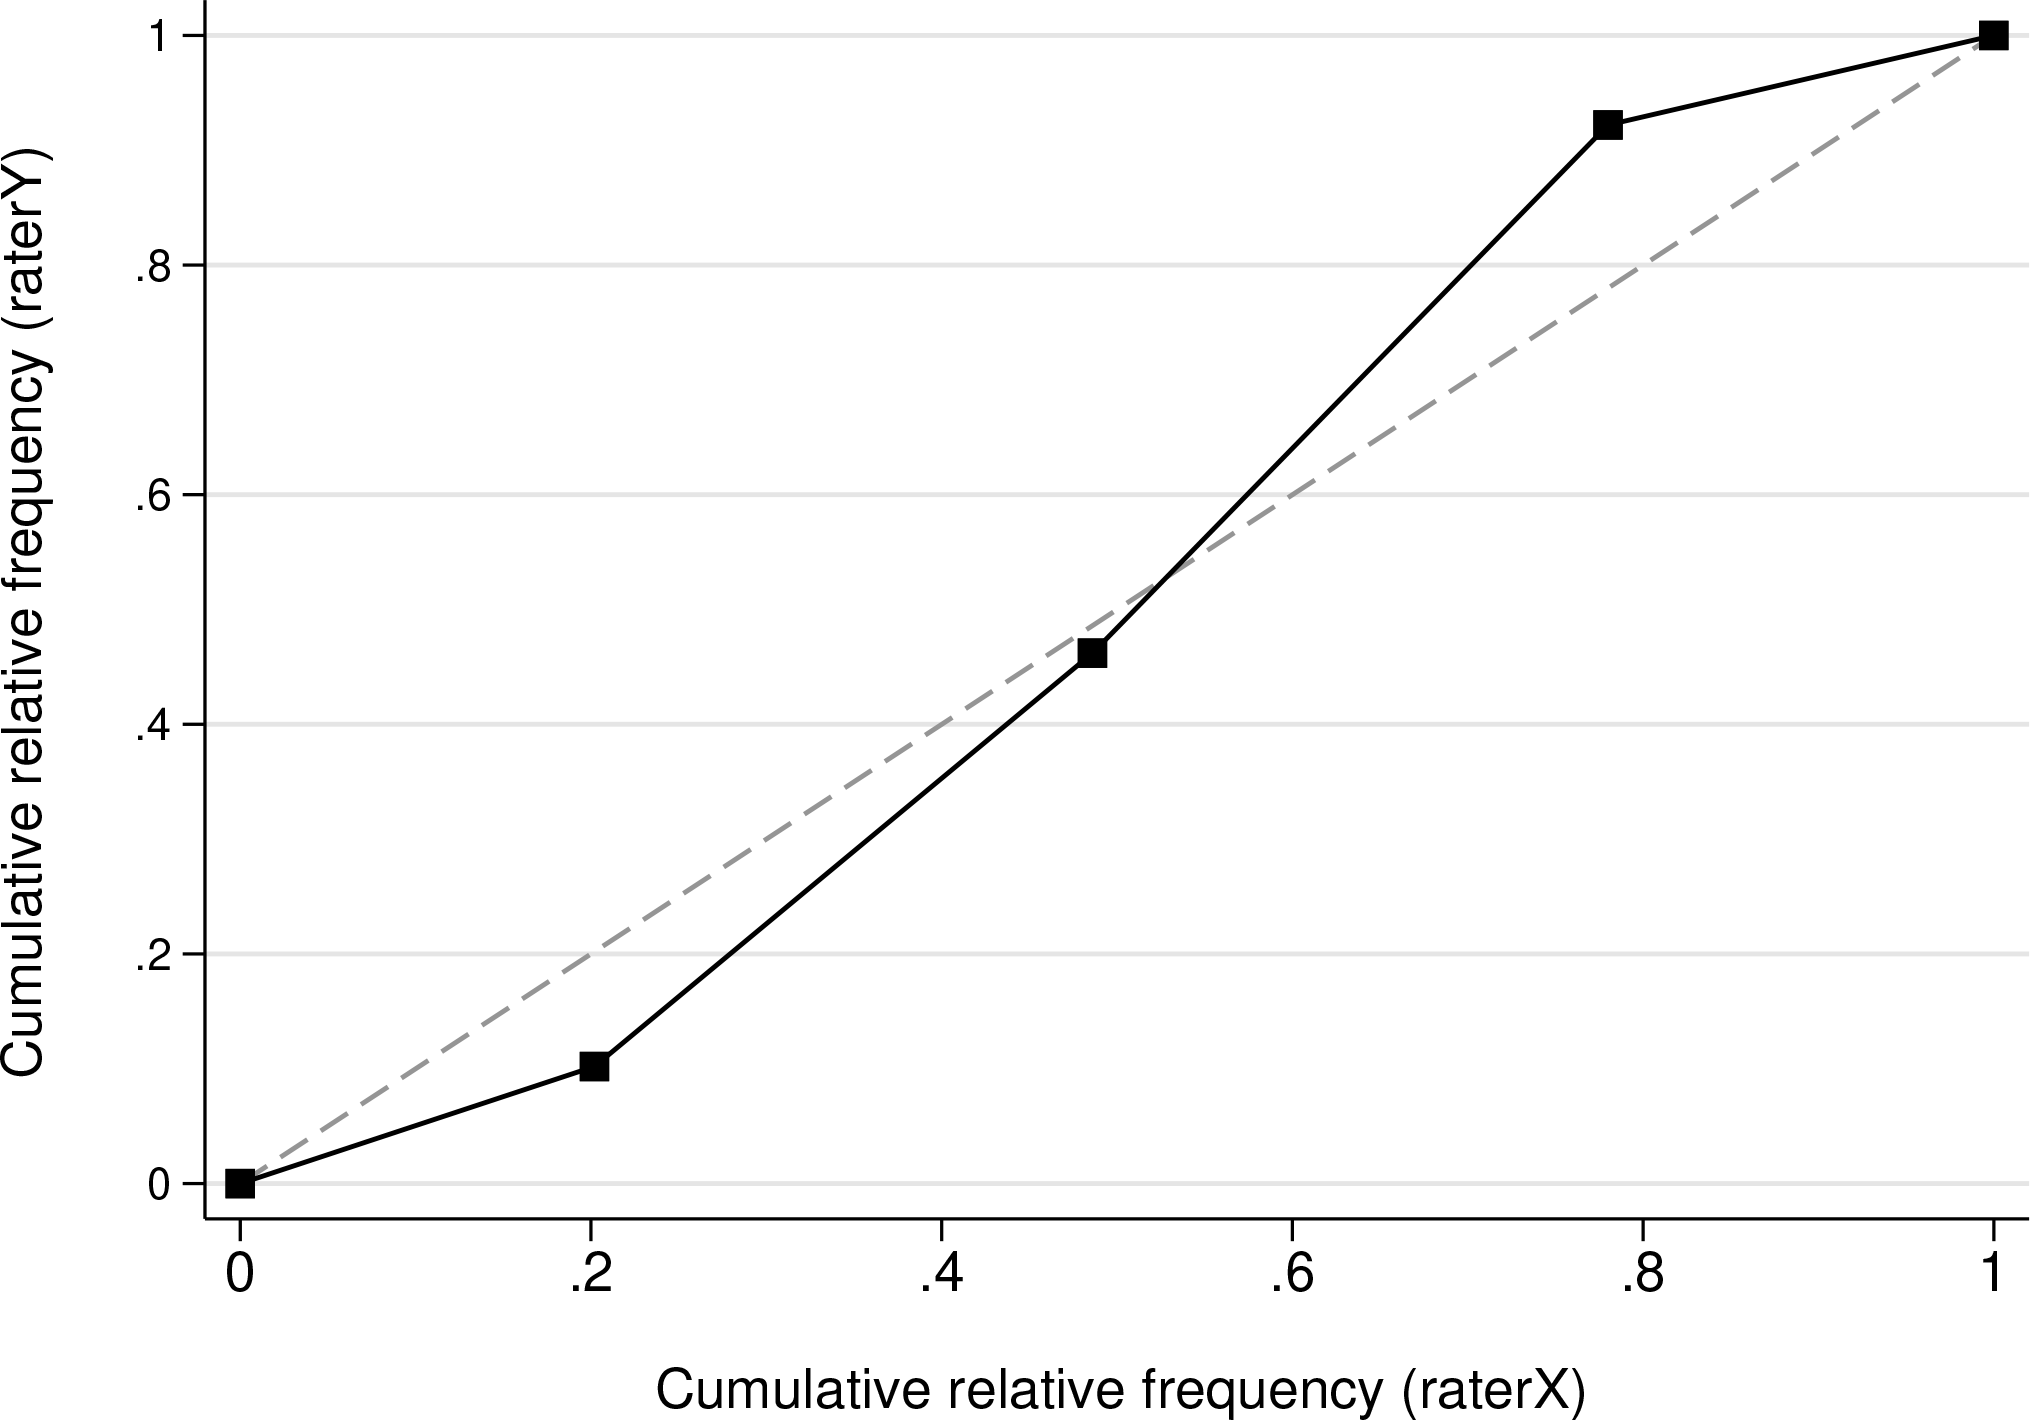
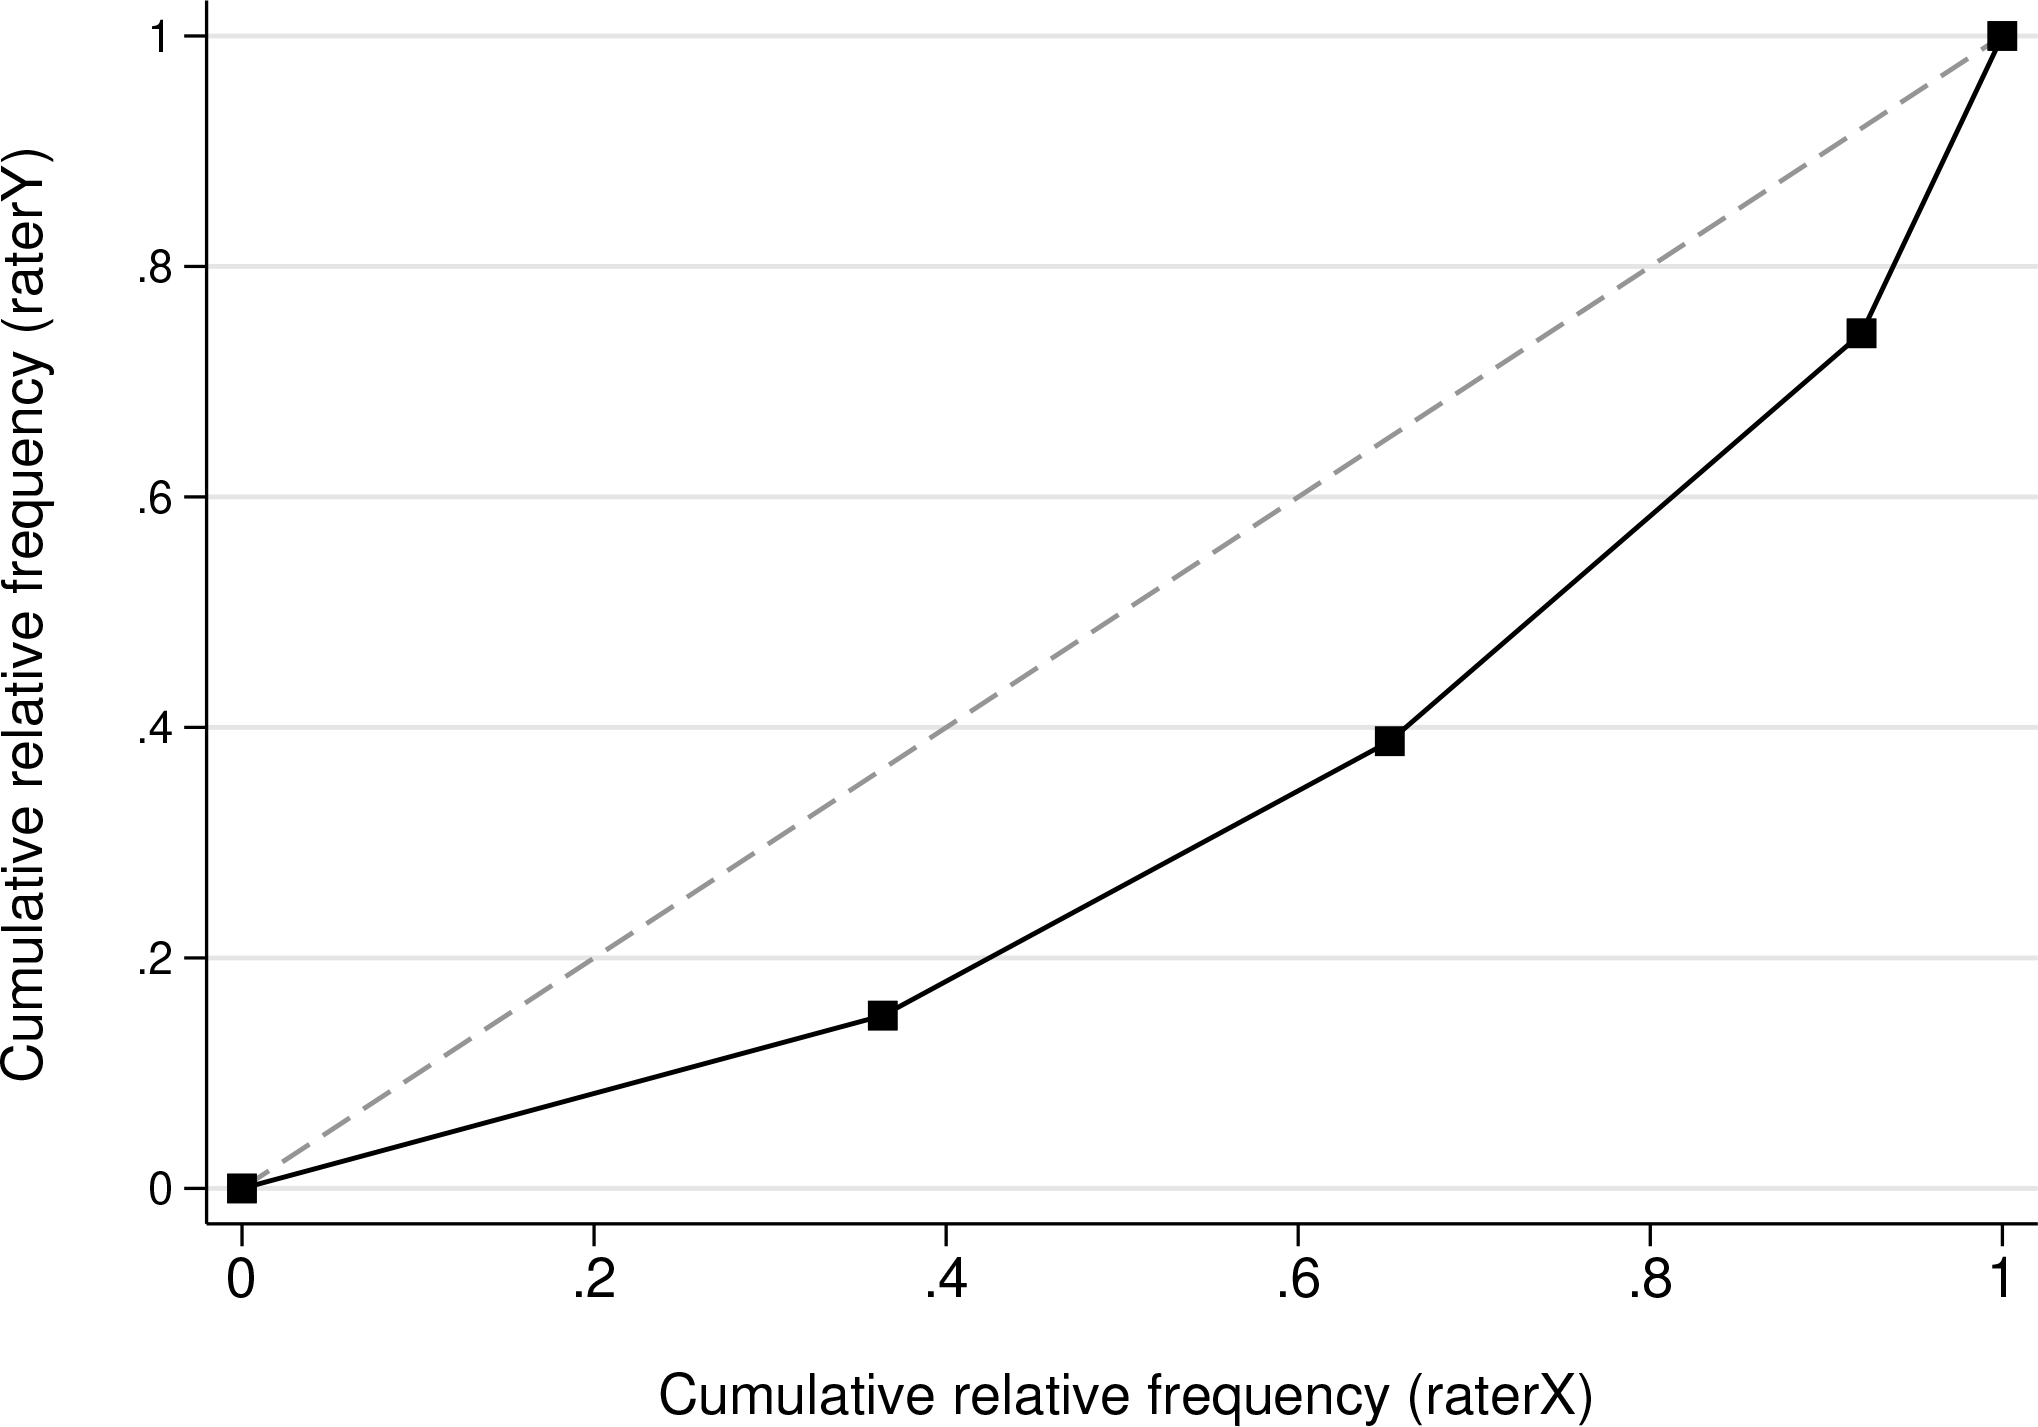
The cumulative relative frequencies of the marginal distributions of X and Y can be plotted against each other along with the (0,0) point to get some sort of relative operating characteristic (ROC) curve; see Svensson (1993) for more details. Note that this use of ROC curves is different from its common application in diagnostic test procedures (for example, Taube [1986]). In this context, the shape of the ROC curve indicates the extent of systematic disagreement. When there is total agreement between X and Y, the ROC curve reduces to the diagonal line from (0, 0) to (1,1). The curve is S-shaped when there is a systematic difference in concentration, whereas a concave or convex shape is a sign of a systematic shift in position.
The nonparametric measures described in this article have been applied, for example, in studies of change (Svensson 1998; Svensson and Starmark 2002), reliability (Svensson et al. 1996; Allvin et al. 2009), and validity (Lund et al. 2005). For further reading on this topic, see, for example, Svensson and Holm (1994) and Svensson (1997, 1998, 2012).
Syntax
Only
Options
Stored results
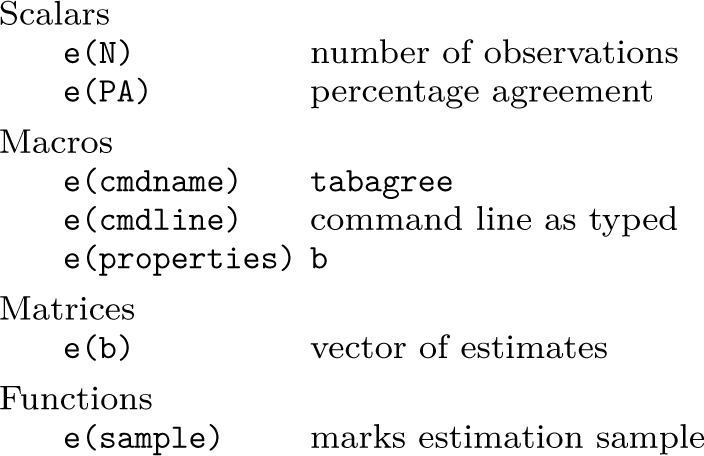
If the user requests bootstrapped confidence intervals, then
Examples
We illustrate the use of
Scenario (a)
Let’s assume that the dataset is structured as one record per person. If we just want to get the point estimates of Svensson’s measures, we can simply type
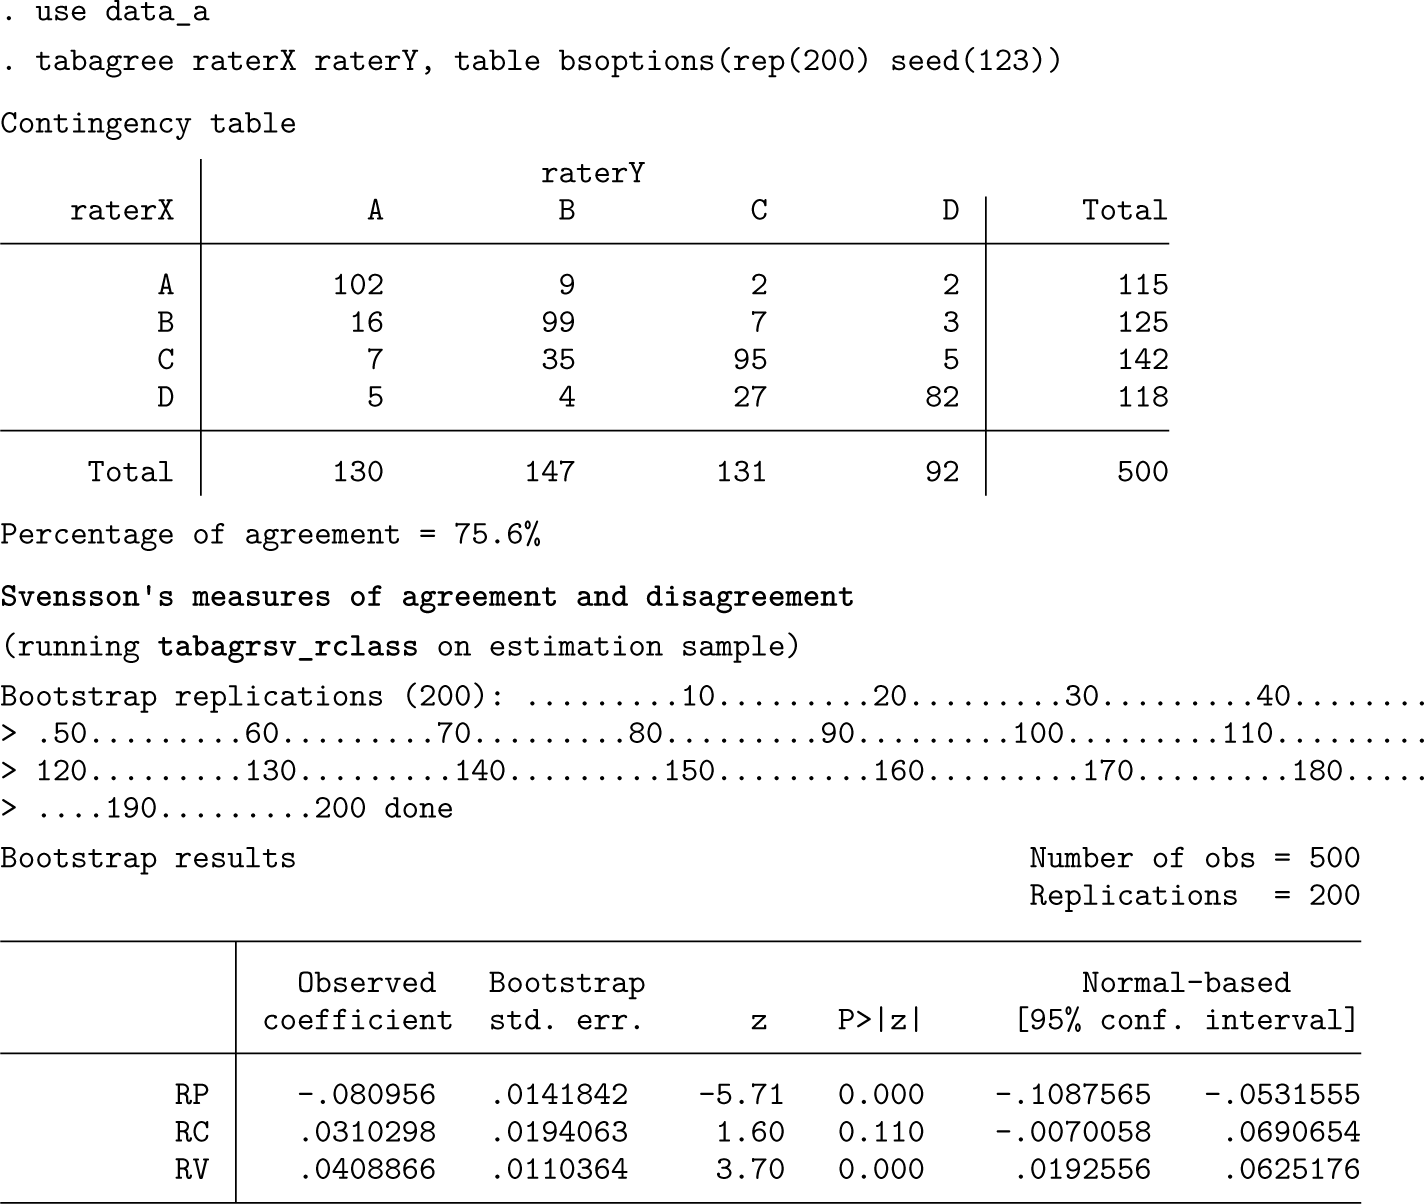
In this example, the two raters agreed 75.6% of the time. The disagreement between them was mainly due to differences in how they interpreted the scale categories,
Scenario (b)
Suppose now that the data for this scenario are available only in aggregated form and that in addition to the assessments of
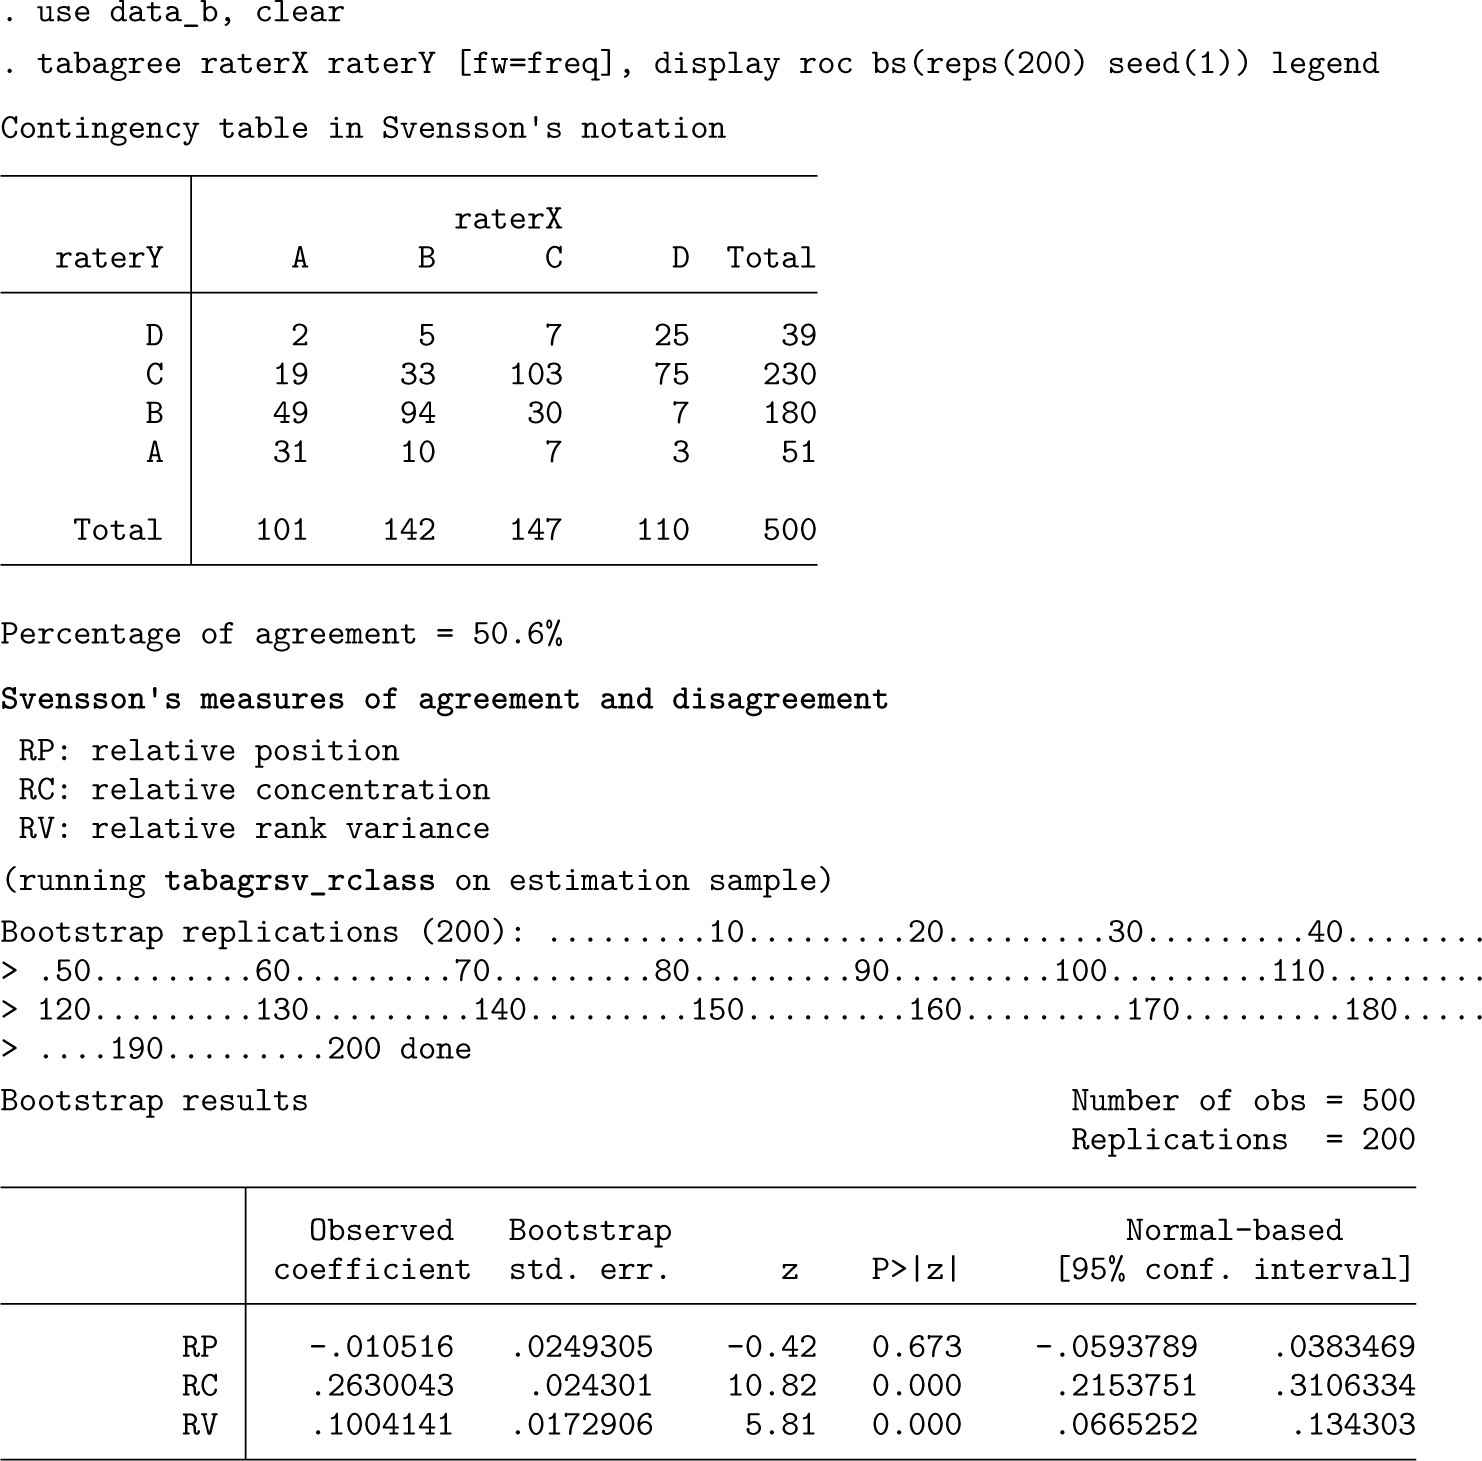
The estimated measure of relative concentration (RC = 0.263, 95% CI: [0.215 to 0.311]) and the S-shaped ROC curve show evidence of systematic differences in concentration. It is more likely that
Scenario (c)
We now assume that the contingency table is directly entered or imported into Stata and the data look as follows:
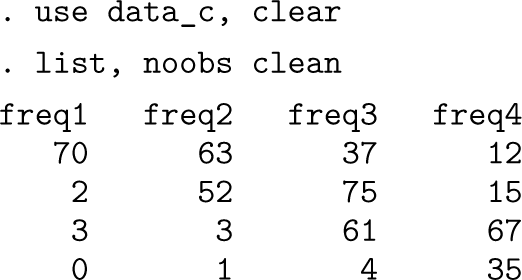
Before using
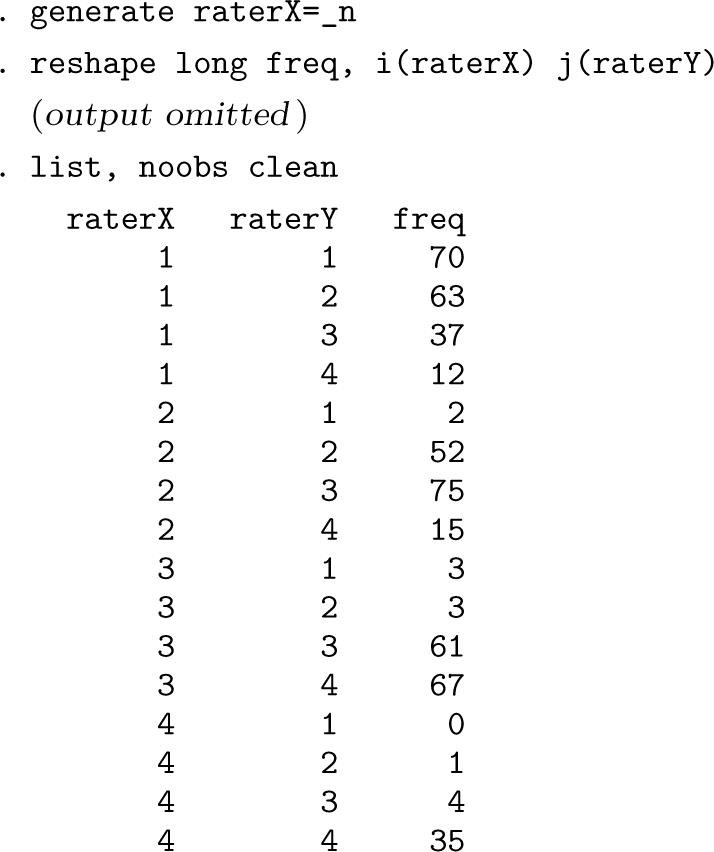
The variables
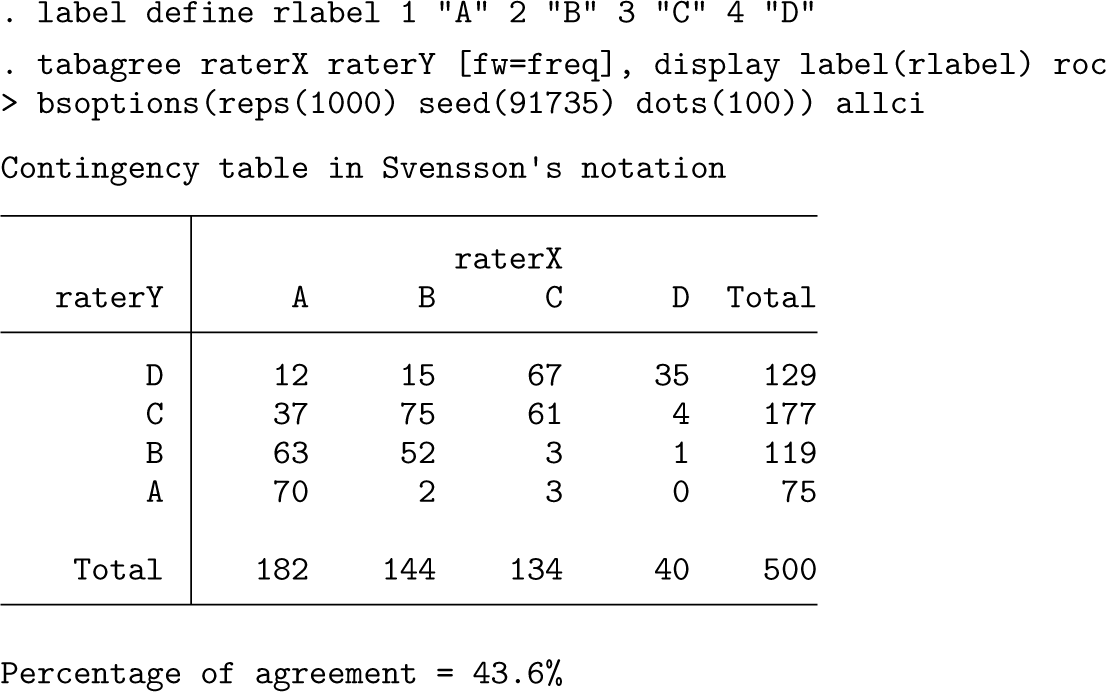
ROC curve created by
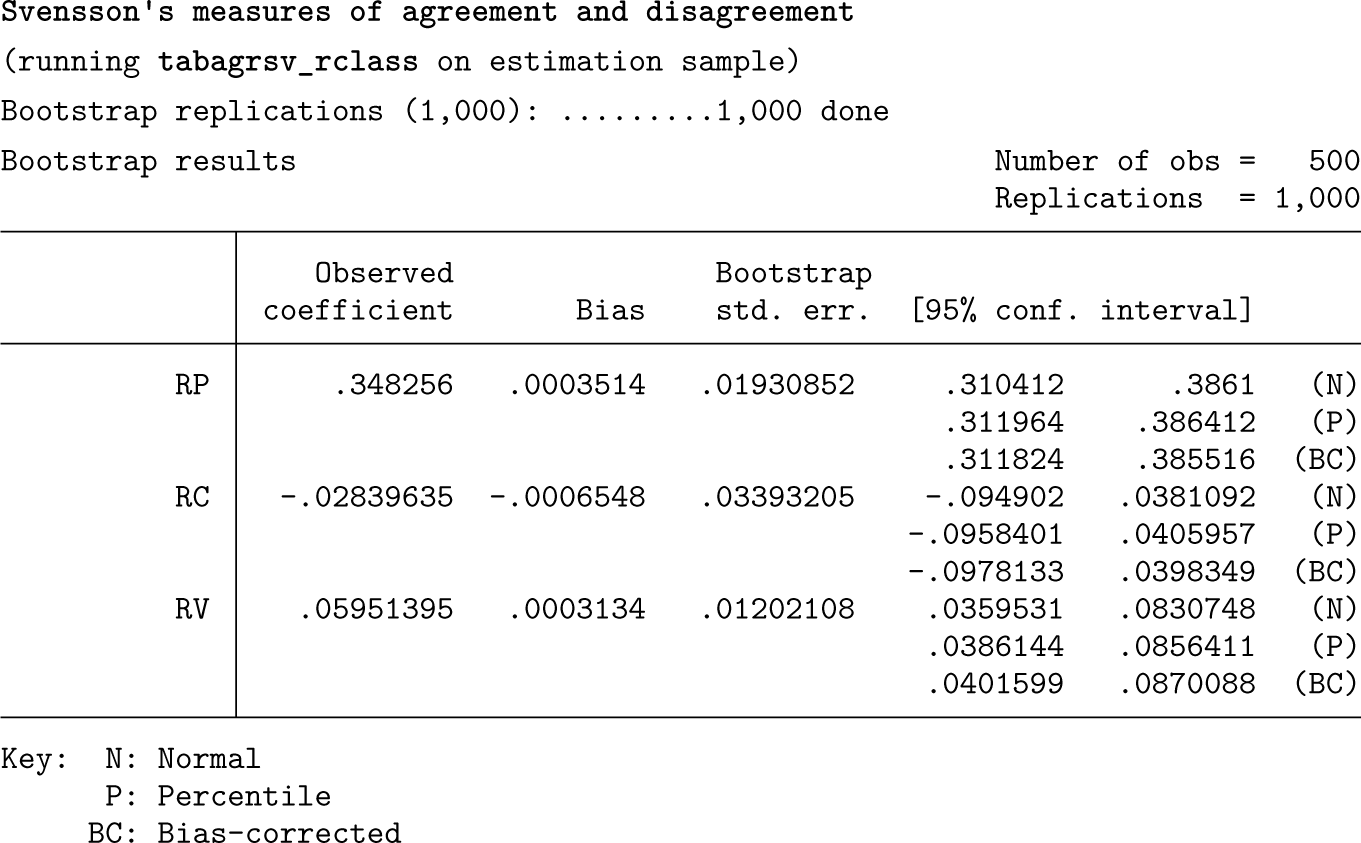
The two marginal distributions differ, which is a sign of systematic discrepancies between the raters. From our table of results, we can infer that the discordance between the raters is mainly due to a systematic disagreement in position (RP = 0.35, 95% CI: [0.31 to 0.39]). Indeed, the ROC curve falls into the right triangle area below the main diagonal, indicating that
One may wonder how the results from
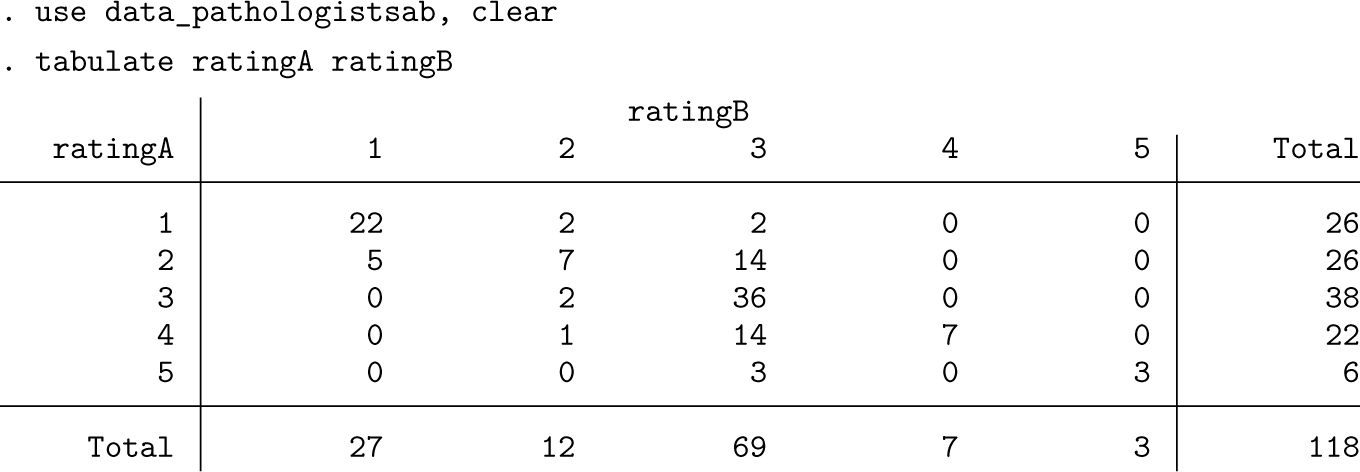
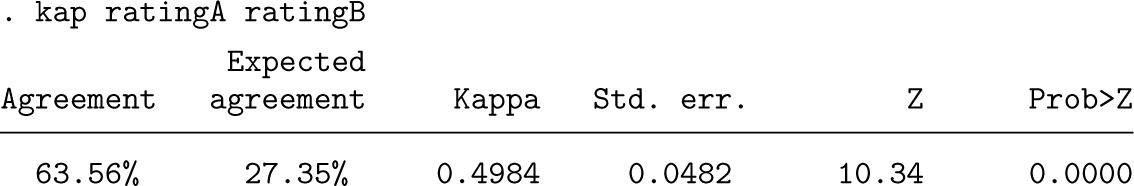
The kappa statistics of interrater agreement are then derived as
Weighted kappa can be estimated by adding the
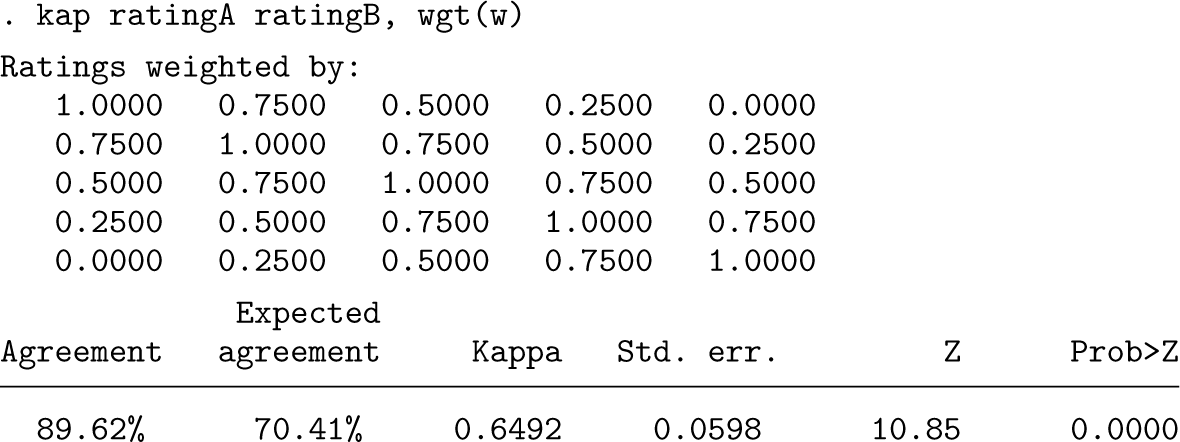
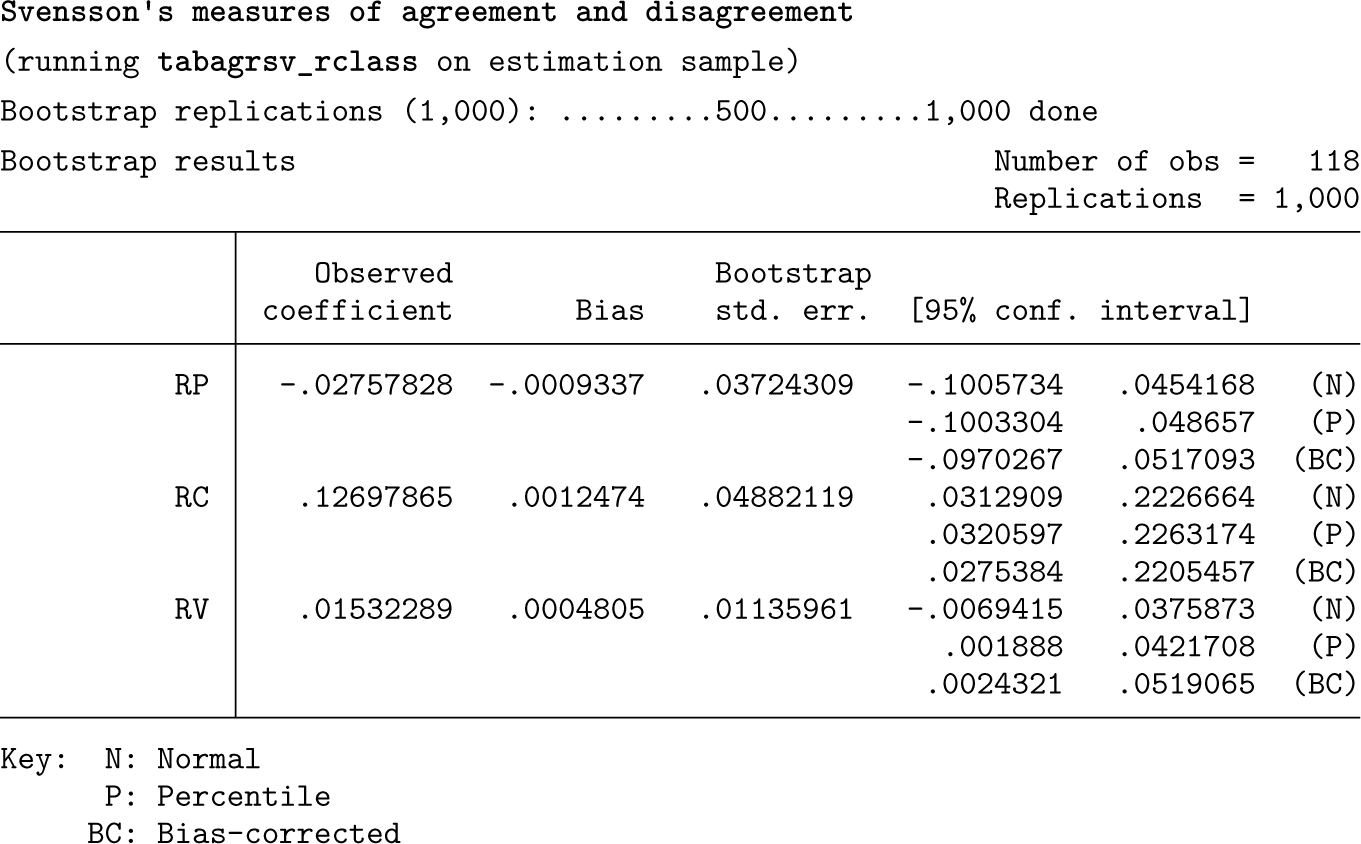
These estimates of kappa and weighted kappa indicate some disagreement between the pathologists, but they do not provide any indication of why the disagreement arises. Indeed, kappa and weighted kappa do not allow us to distinguish between different sources of disagreement. On the other hand, with Svensson’s method, we can get deeper insights and evaluate both the systematic component of interrater differences in terms of RP and RC and the random component as measured by RV:
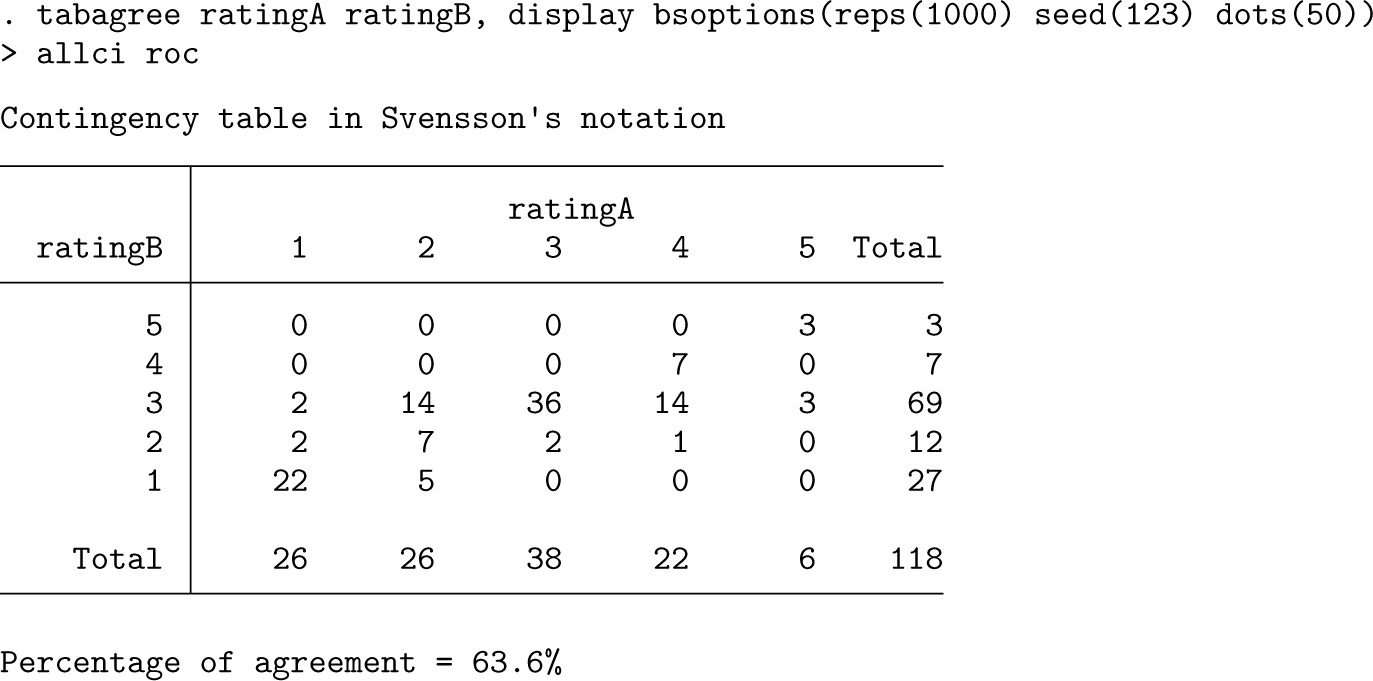
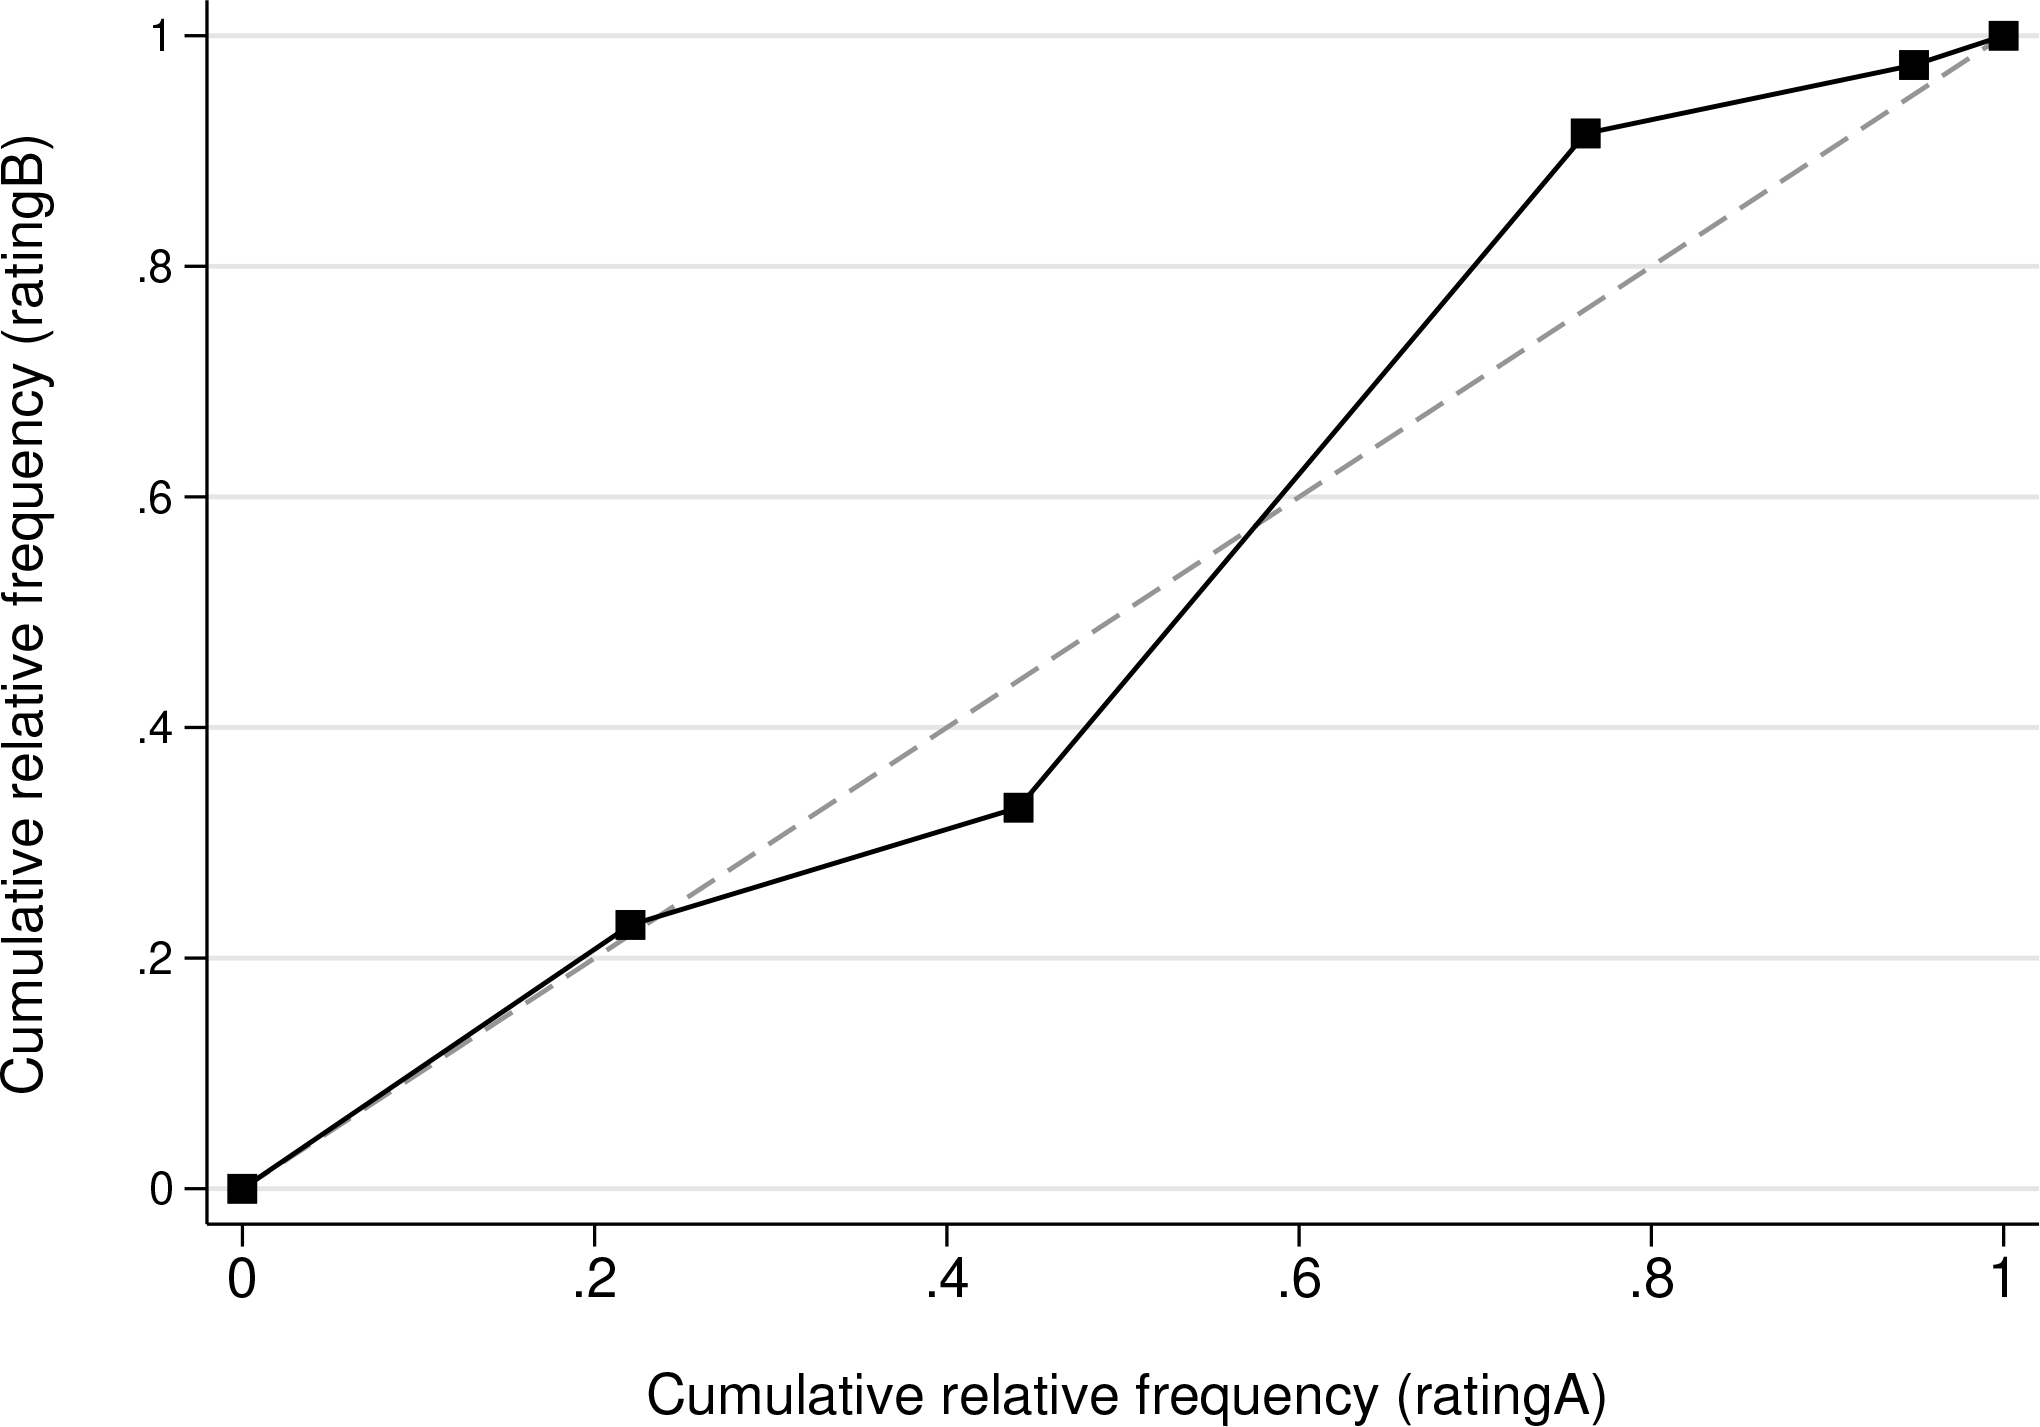
ROC curve created by
These results show that there is a systematic disagreement between the raters. In particular, it is 12.7 (95% bias-corrected CI: [2.8 to 22.1]) percentage points more likely that pathologist B rather than pathologist A uses the central categories more frequently than vice versa. Both pathologists evidently had different opinions about the categories in the middle of the rating scale. Holm and Svensson (1991) argued that “the items in the measuring instrument of the histological classification of carcinoma may be ambiguously described”. There is some random variation (RV = 0.015, 95% bias-corrected CI: [0.002 to 0.052]), but it is negligible.
Another nonparametric measure of agreement for paired ordinal variables is Somers’s D statistic (Somers 1962), which is implemented in the somersd package (Newson 2006). Somers’s D has many versions for different variables or sampling schemes, but in our case, it is equal to P(Y > X) — P(Y < X), where X is a random rating by pathologist A and Y is a random rating by pathologist B. These ratings may be for the same subject or for different subjects or for either, depending on the version of Somers’s D specified.
To use the
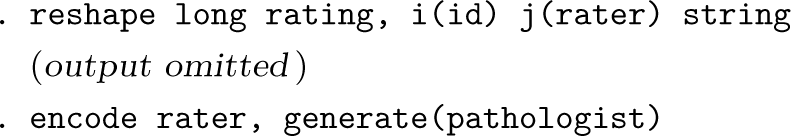
We can then specify
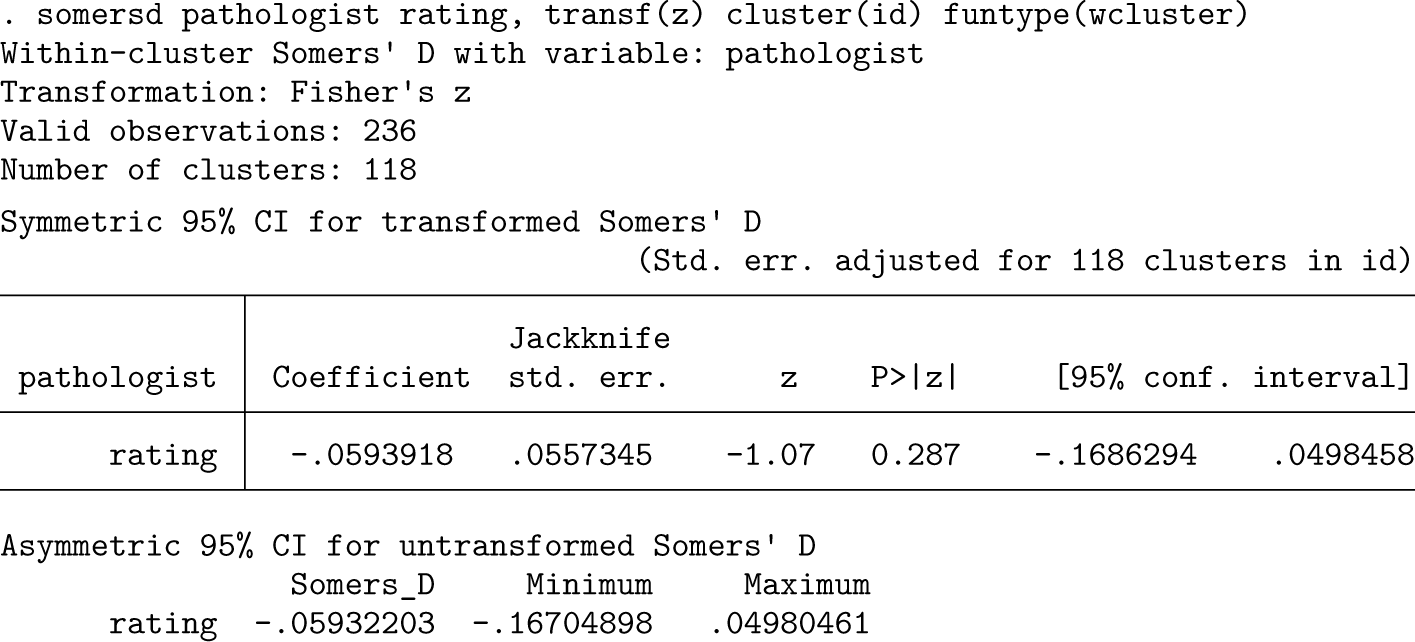
The estimated mean sign of the B-A pathologist difference in rating is —0.059 (95% CI: [—0.169 to 0.050]), so it is 5.9 percentage points less likely that pathologist B scores the same subject higher than pathologist A than vice versa.
We then estimate a Von Mises Somers’s D, including between-rater comparisons both between subjects and within subjects. This parameter corresponds to a Mann- Whitney or Wilcoxon test comparing all ratings from pathologist B with all ratings from pathologist A, but the confidence limits and p-values are adjusted to allow for clustering by subject. This version of Somers’s D is equivalent to Svensson’s RP.
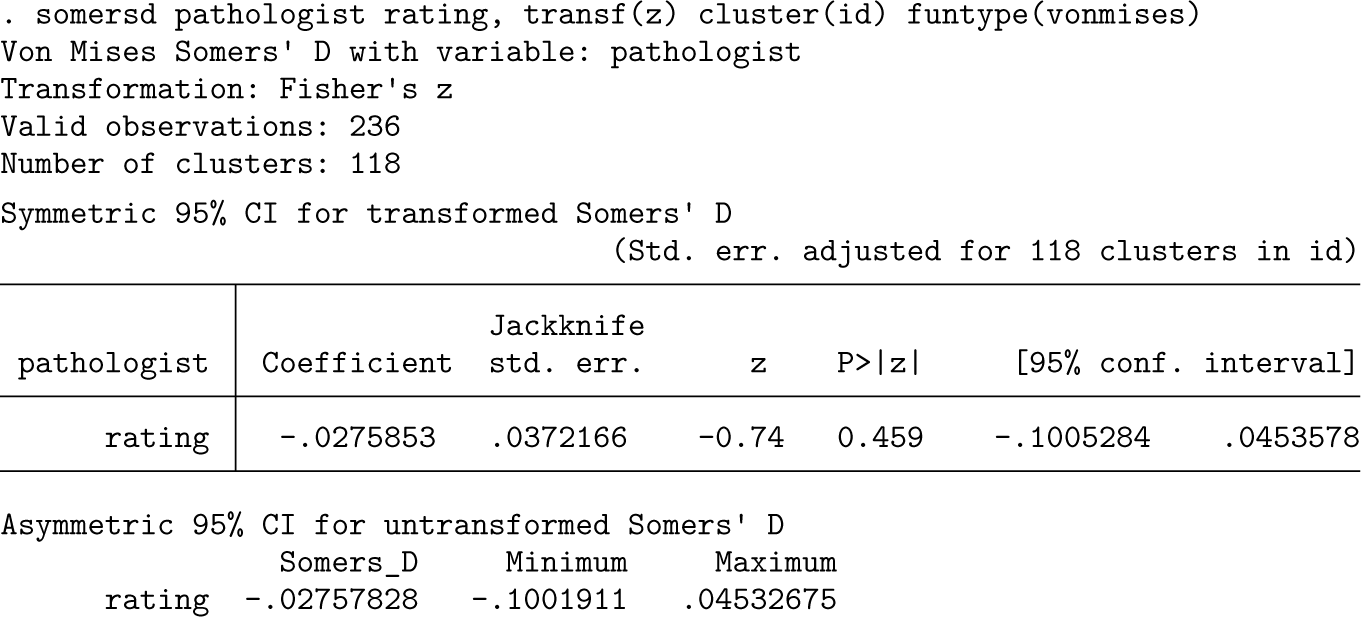
From this, we can conclude that in a random pair of subjects sampled with replacement it is 2.8 (95% CI: [-4.5 to 10.1]) percentage points less likely that pathologist B scores the first subject more highly than pathologist A scores the second subject rather than the opposite.
Note that in both
The
Assessing the level of agreement between ordinal paired variables via a single summary index is appealing but usually problematic. The weighted and unweighted kappa statistics, which are the most commonly used measures of agreement in such contexts, have severe limitations because they depend heavily on the marginal distributions and do not distinguish between different sources of disagreement. The weighted kappa offers the advantage of accounting for the ordinal nature of the data but is sensitive to the choice of the weights and, as argued by, for example, Graham and Jackson (1993), it is more a measure of association than of agreement. Somers’s D (which includes the sign test statistic and Svensson’s RP as special cases) can be used to assess the tendency of one variable to have higher ratings than another, but it does not evaluate the extent of systematic differences in concentration.
In this article, we have described a new command,
Acknowledgments
This work was supported by Cancer Research UK (grant number: C8162/A27047). We are very grateful to Dr. Tim Morris (MRC Clinical Trials Unit at University College London, UK) for comments on an early draft. We also thank a reviewer and the editor for helping us to improve this manuscript.
Programs and supplemental material
To install the software files as they existed at the time of publication of this article, type

Supplemental Material
sj-dta-1-stj-10.1177_1536867X251365495 - Supplemental material for tabagree: Nonparametric measures of agreement and disagreement in paired ordinal data
Supplemental material, sj-dta-1-stj-10.1177_1536867X251365495 for tabagree: Nonparametric measures of agreement and disagreement in paired ordinal data by Milena Falcaro and Roger B. Newson in The Stata Journal
Supplemental Material
sj-dta-2-stj-10.1177_1536867X251365495 - Supplemental material for tabagree: Nonparametric measures of agreement and disagreement in paired ordinal data
Supplemental material, sj-dta-2-stj-10.1177_1536867X251365495 for tabagree: Nonparametric measures of agreement and disagreement in paired ordinal data by Milena Falcaro and Roger B. Newson in The Stata Journal
Supplemental Material
sj-dta-3-stj-10.1177_1536867X251365495 - Supplemental material for tabagree: Nonparametric measures of agreement and disagreement in paired ordinal data
Supplemental material, sj-dta-3-stj-10.1177_1536867X251365495 for tabagree: Nonparametric measures of agreement and disagreement in paired ordinal data by Milena Falcaro and Roger B. Newson in The Stata Journal
Supplemental Material
sj-dta-4-stj-10.1177_1536867X251365495 - Supplemental material for tabagree: Nonparametric measures of agreement and disagreement in paired ordinal data
Supplemental material, sj-dta-4-stj-10.1177_1536867X251365495 for tabagree: Nonparametric measures of agreement and disagreement in paired ordinal data by Milena Falcaro and Roger B. Newson in The Stata Journal
Supplemental Material
sj-txt-1-stj-10.1177_1536867X251365495 - Supplemental material for tabagree: Nonparametric measures of agreement and disagreement in paired ordinal data
Supplemental material, sj-txt-1-stj-10.1177_1536867X251365495 for tabagree: Nonparametric measures of agreement and disagreement in paired ordinal data by Milena Falcaro and Roger B. Newson in The Stata Journal
Footnotes
About the authors
Milena Falcaro is a senior statistician at Queen Mary University of London (UK). Her main research interests are in survival analysis, methods for missing values, and cancer epidemiology.
Roger B. Newson is a senior statistician at Queen Mary University of London (UK), working principally in cancer research. He has written over 120 Statistical Software Components packages (including somersd), some of which have been described in detail in articles in the Stata Journal.
References
Supplementary Material
Please find the following supplemental material available below.
For Open Access articles published under a Creative Commons License, all supplemental material carries the same license as the article it is associated with.
For non-Open Access articles published, all supplemental material carries a non-exclusive license, and permission requests for re-use of supplemental material or any part of supplemental material shall be sent directly to the copyright owner as specified in the copyright notice associated with the article.