



Abstract

Introduction: Present, nonmissing, missing, and absent
The simple word present may be applied to whatever data are in any Stata dataset we are using. The data present can have missing values; otherwise, they have nonmissing values. Stata has precise rules about what is regarded as missing. There are special codes . and
We sometimes need an extra term for a further category: whatever values might have been included in the data but, in practice, are not present in our data right now. The word absent seems good for this purpose.
For example, the following tabulation shows that in

Once again, note the difference between
So far, this is mostly about terminology. Some users might report that values of 1 and 2 on repair record for foreign cars are missing from the data, but I recommend the term absent as more appropriate.
In this tip, I consider handling of absent values with a focus on graphics, showing how to plot absent values. We will not go beyond what is possible with official commands and functions.
Plotting absent values
Sometimes, people want to plot absent values in Stata; that is, they want to plot the values but show that the values are absent. You could be producing a series of graphs that you want to have a consistent format, both for instances in which sometimes absent values really are present and for instances in which sometimes absent values really are absent.
Absence is simple on one level. It means zero for counts or frequencies, for proportions or fractions, for percentages, and (if relevant) for probability densities.
Sometimes, the question is trivial, even to the extent of never being asked. If you have ever started an axis at zero to underline that a variable is positive or extended any axis to show possible values, you have solved the problem. This is generally possible in any application of
If needed, you can extend any axis in a
Plotting absent categories: The problem
Let’s now get to the nub of a problem that may bite. With

Bar chart showing frequencies of repair record grades for foreign cars. Note that grades 1 and 2 are not shown.

Stata examines the data specified and shows frequencies for the categories of repair record present for foreign cars. As the table in section 1 already showed, these are just grades 3, 4, and 5. Grades 1 and 2 do not appear in the graph. The idea of changing the
Remarks in section 2 already pointed to a solution. You can switch to an appropriate

Histogram showing frequencies of repair record grades for foreign cars. Note that grades 1 and 2 are shown by request but without bars (or equivalently with bars of height zero). Foreign cars with such grades are absent from the dataset, but we can still request that the corresponding axis labels be shown.

The reason for showing axis labels at 1 and 2 is that we want to underline that such values occur in the rest of the data. But as far as Stata is concerned, we could ask for any labels we want. To continue the little fantasy introduced earlier, we could also ask for labels at 0 and 6 if those values were possible in principle but absent in practice
Here is another technique that is sometimes useful. We construct a frequency variable ourselves and then call up
The results are not shown here, because they are similar to the previous figure Incidentally, because
would have worked just as well. The expression
Suppose that we want a bar chart with joint frequencies of two or more variables. Stata makes plotting of absent categories much easier in that case. Commands like
leave holes without (visible) bars precisely where you might want them. So that result is equivalent to the result of
Figure 3 shows the second of those graphs. Showing the horizontal variant rather than the more common vertical variant is intended as a small reminder that it often does better at displaying categorical labels readably.
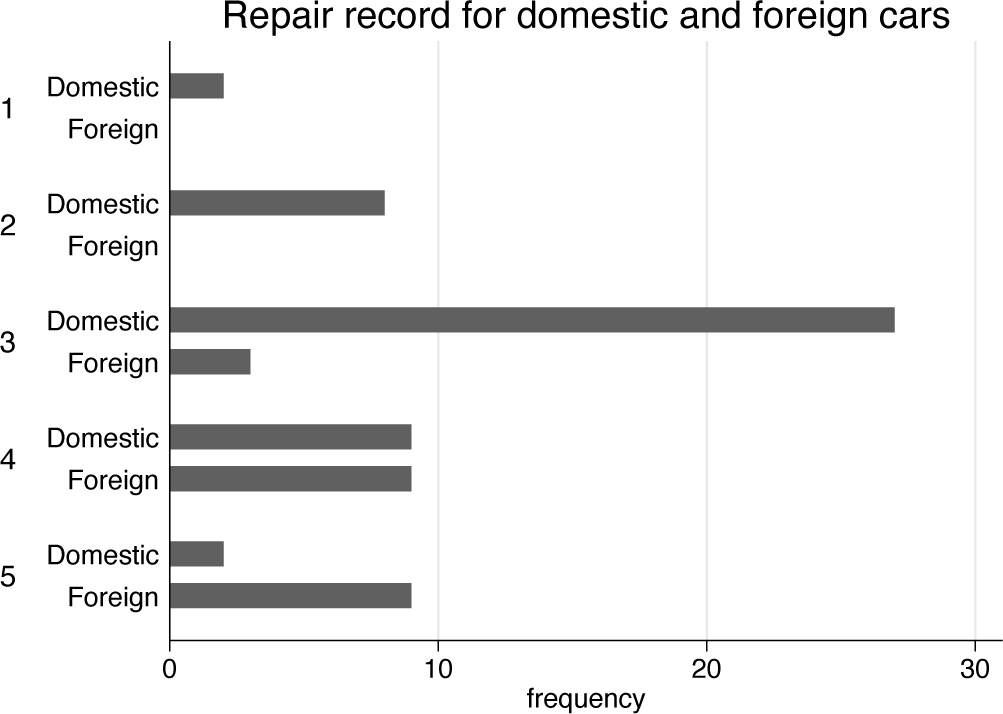
Bar chart showing frequencies of repair record for foreign and domestic cars. By default, absent categories are just holes without visible bars.
Other way round, if you do not want that behavior, then you need to override the default with an extra
If this seems too easy now, let’s revisit (for the final time) the fantasy about further absent categories 0 and 6 for repair record. Suppose we want to extend figure 3 by also showing those fantastical categories.
It is not elegant, but it may be practical just to create a small dataset for the purpose. Below is the code followed by commentary
The idea is that
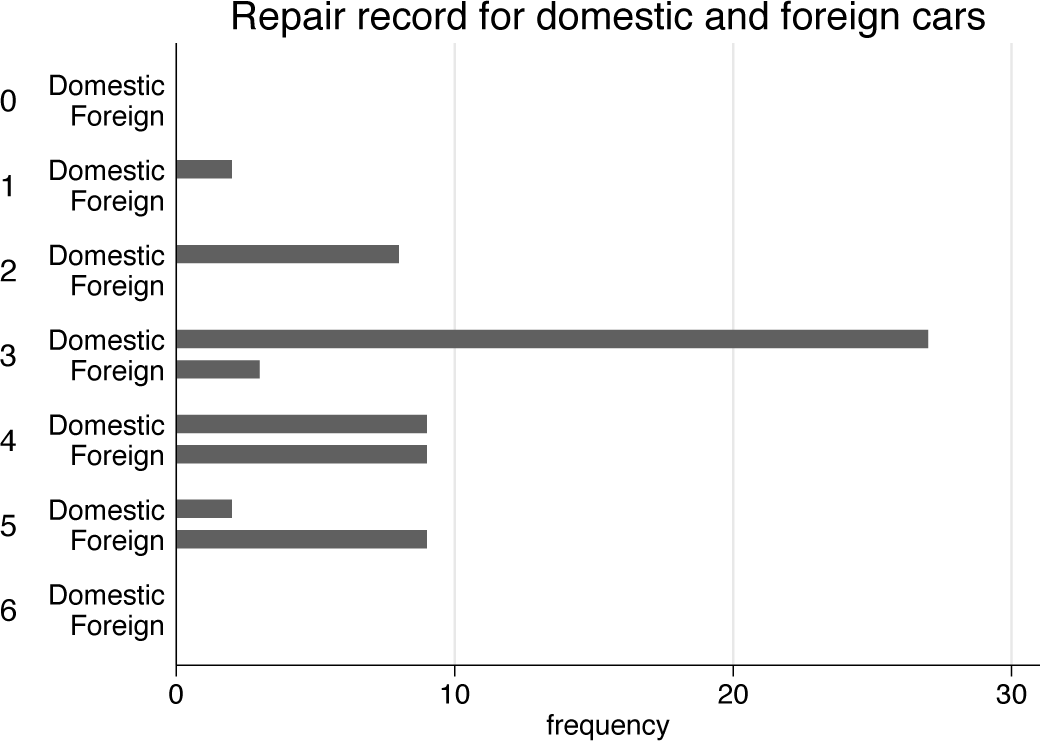
Bar chart showing frequencies of repair record for foreign and domestic cars. The fantastical categories of repair records 0 and 6 are added to show technique as further holes without visible bars.

Fastidious readers may recoil at such a programming style. It is very specific to the example data and the particular problem. Still, getting the job done quickly and easily occasionally overrides any preference of style. As Good (1965, 56) remarked, “real life is both complicated and short, and we make no mockery of honest adhockery”.
Once we have a quick and dirty solution, however, a second look may suggest a more general approach. The example problem is concocted. If you have a problem with sometimes absent categories, it may well be more complicated and capricious. Occasional or rare categories may appear and disappear from dataset to dataset.
The need is to fill in absent categories with observations in a transient dataset with zero frequencies. But why not flip the problem around? Set up a template dataset with all possible categories and zero frequencies. Then combine that with real data, using a rule that positive frequencies override zero frequencies. Here is how that might work.
First,set up a template
In your real problem, the template might well be more elaborate. Often, categories are best presented with value labels.
Now go back to the original dataset. Get the frequencies we need and combine them with the template.

The resulting graph is not shown here. It is identical to figure 4.
The code just given is still a sketch. The approach could be developed or varied in several ways. You would typically want to save the graph for later use. Users familia1 with frames might prefer to use frames. If such a need is a common problem for you, setting up a do-file might be the next step.