



Abstract

Introduction: Why use tsset or xtset ?
Many researchers deal with data that are single or multiple time series, either for a single entity or for several entities. Data for several entities are often called panel data or longitudinal data, particularly in economic, social, and health or medical sciences, where the entities may be employees, companies, countries, patients, or pigs (for example, Diggle et al. [2002]; Wooldridge [2010]). Many datasets in other sciences have the same form even if neither emphasized term is used alongside them. In meteorology or hydrology, we might have temperature, precipitation, or river discharge data for multiple stations.
Declaring your Stata dataset as time-series or panel or longitudinal data with a
There is a kind of symmetry between
You may use
Either
Behind the problems discussed here lie the complications of the calendar and of time- of-day recording. Many will have been familiar to you since childhood. The details, often bizarre or recondite, may variously fascinate or frustrate, depending on whether you are reading for pleasure or wrestling a dataset into a shape that matches their quirks and is fit for later analysis. Informative references include Richards (1998), Blackburn and Holford-Strevens (1999), Holford-Strevens (2005), and Reingold and Dershowitz (2018).
An option that may be essential
The point of this tip is to underline that the
Dealing with regularly spaced data: delta() may help
It is quite common to have data regularly, meaning equally, spaced in time, yet the interval concerned is not 1 in the time units you are using. Stata does not inspect your data to determine the typical or still less the correct spacing that should obtain. The responsibility is yours: as the researcher, you should know about your data and about how your data should be treated.
If you do not specify the
To make the point concrete, here are some common examples.
Data for years but multiple years apart
Olympic years or US presidential election years are typically 4 years apart. National population censuses are often once every 10 years. Typically, an option call such as
Consider what happens if you specify
Data for months or quarters but indexed by daily dates
Ideally, under this heading, the daily dates are already Stata numeric daily dates counted from 0 as 1 January 1960 so that later daily dates are indexed by positive integers and earlier daily dates by negative integers. If your daily dates do not match this form,
In this case,
Consider some daily dates, first input as strings:

A quick glance shows monthly data indexed by the last day of each month, but Stata cannot work that out by itself. To make progress, we first use
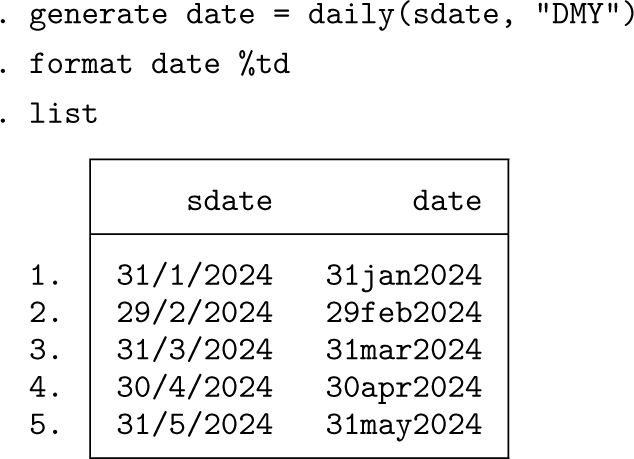
If we now

The solution is to work in terms of a monthly date variable, which we need to
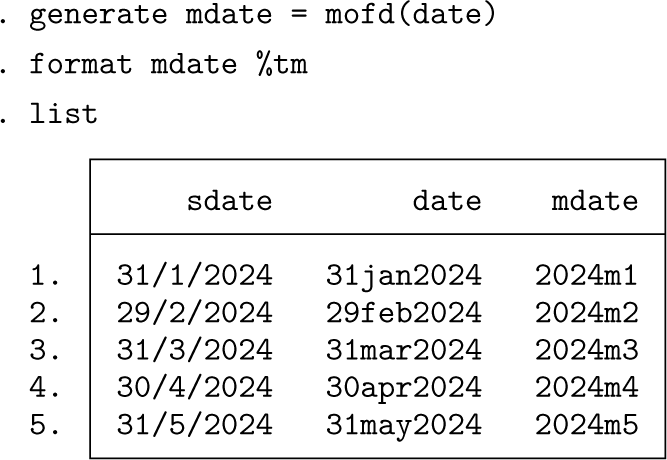
Now the problem is soluble: use

Essentially, the same kind of solution solves a similar problem with quarterly data. Imagine that we had quarterly data indexed by daily dates such as 31 March, 30 June, 30 September, and 31 December or 1 January, 1 April, 1 July, and 1 October. The need is first to map to a quarterly date using the function
In either case, if you have a panel or some other identifier as well, then specify that too as needed.
Data for weeks but indexed by daily dates
Again, ideally the daily dates are already Stata numeric daily dates. In this case, I do not recommend that you try to make use of Stata’s weekly dates. For why not, here is the gist, but see, for example, Cox (2010) for more discussion if needed. For yet more advice on handling weeks in Stata if your problem is not explained here, see Cox (2012a,b, 2019, 2022a,b).
Weeks are easy for people to understand informally but often awkward to use in statistically-based research. Essentially, there are several definitions of weeks in use, and almost never do weeks nest neatly into months, quarters, half-years, or years.
Stata’s own definition of weeks is idiosyncratic. Week 1 always starts on 1 January of any year, week 2 on 8 January, and so on. Week 52 always finishes on 31 December and is thus 9 or 8 days long, depending on whether the year is or is not leap: in a leap year, there are 29 days in February and 366 days in total; otherwise, there are 28 days in February and 365 days in total. With Stata’s definition, there is never a week 53 in any year. With this definition, Stata weeks always nest within years, which is tidy in itself. Unfortunately, weekly data usually arrive using some other definition.
There are two common versions of the problem of weeks being indexed by daily dates. In the simpler version, observations are typically once per week. For this case, my suggestion is that daily dates will work well to index each week.
As an example with real data, I downloaded data on financial stress from https://fred.stlouisfed.org/series/STLFSI4/ on 23 June 2024 and got 1,990 observations. Here are the last 5 for the St. Louis Fed Financial Stress Index.
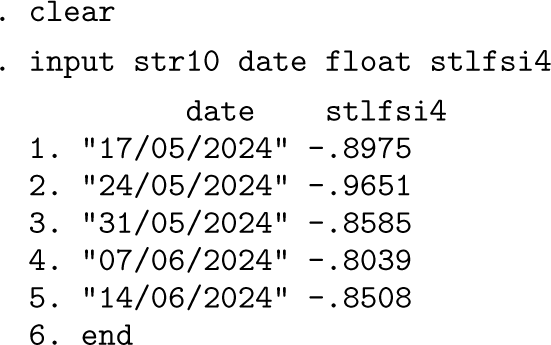
So each week is indexed by a daily date, Friday, in each week. All we need to do is to use that daily date to index each week. The only twist is the need to declare
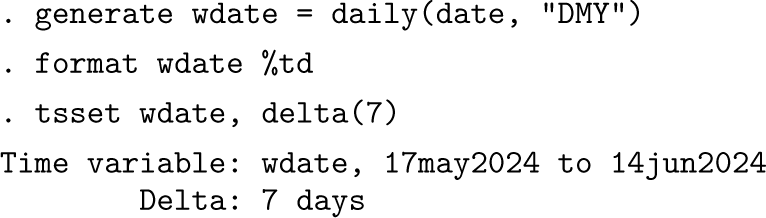
With this solution, graphical and tabular output can make direct use of dates that should make sense to both researchers and readers.
In the more challenging version, observations may be for two or more days of each week, say, Mondays to Fridays. We seek reduction of those data to weeks in some fashion, say, to weekly totals or means. The easiest reduction starts with declaring that weeks start on Sundays. In the last week of the previous example, these days are Monday to Friday:
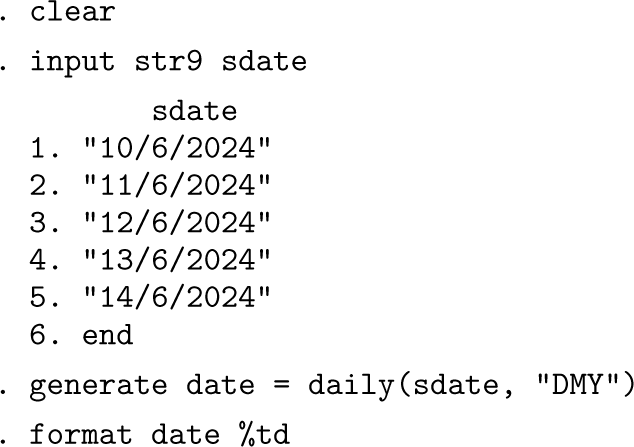
The function
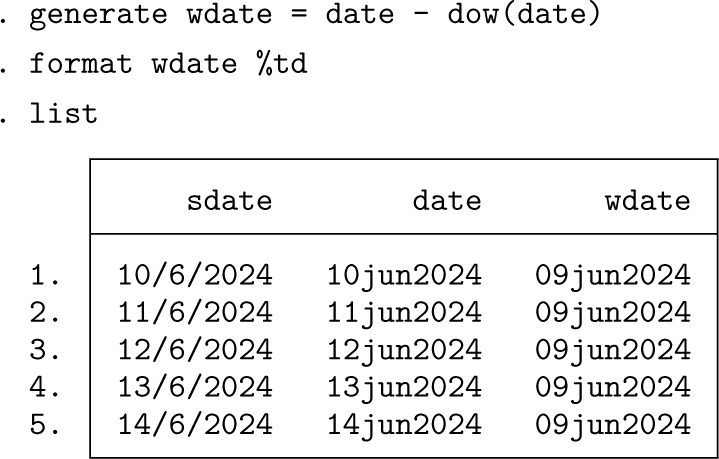
If we want weeks to be indexed as ending on Fridays, just add 5 to that weekly date. We could now proceed to
The community-contributed command
Data for datetimes but with an interval not 1 ms
Stata datetimes are, or should be, implemented using
It would be a surprise, however, to find many (or even any) Stata datasets with equally spaced data in which observations were once every ms. More commonly, the time step or resolution is much longer. Documentation for both