
Abstract
A previous column (Cox, 2009, Stata Journal 9: 137–157) gave a review of methods for working rowwise in Stata. Here rows means observations in a dataset, and the concern is calculations in each observation with a bundle of variables. For example, a row mean variable can be generated as the mean of some numeric variables in each observation.
This column is an update. It is briefly flagged that official Stata now has
1 Introduction
The main data structure of Stata is asymmetric: rows of a dataset define observations, and columns define variables. The great majority of Stata commands, starting with workhorses like
Other way round, in a previous column (Cox 2009) I reviewed a variety of ideas and methods for working rowwise. Perhaps the most valuable single suggestion, which is repeated here but not elaborated beyond this paragraph, is that the impulse to work rowwise may signal that your dataset layout (format, if you wish) is not ideal for Stata purposes. Often on Statalist and elsewhere, people have panel or longitudinal data in a wide layout in which observations define individuals (patients, firms, countries, sites, etc.) and different variables define various properties at different times. The answer here is usually to
This column is an update on that previous column. First, it is easy and congenial to flag that official Stata added
I assume that you are broadly familiar with loops in Stata. If you are not, and in any case, the previous column (Cox 2009) may be worth reading first, at least briskly.
2 Which variables hold the extremes in a row?
The remainder of this column focuses on a single class of problems, studiously avoided earlier. Suppose within an observation, variables
You can imagine what comes next. What do we do if there are ties? When one fills in surveys, particularly when people are asked to give opinions or beliefs on integer scales, ties are not just common but highly likely. It seems that some people even give the same response (say, 3 3 3…) on purpose, perhaps out of boredom or as a personal protest of some kind. Here we bite the bullet, grasp the nettle, and seize the bull by its horns and show how to program return of variable names even if ties are present.
As a sandbox dataset, we use what appear to be some real data on percent marks (grades, if you prefer) for a group of students on five mathematics examinations in an unnamed institution in an unnamed year. The anonymity here is all to the good. The data are from Mardia, Kent, and Bibby (1979, 3–4) and have been used by many statistically minded writers, typically for purposes or with methods much more subtle than in this column.
In essence, even if we used the functions
The dataset can be read in from the media for this column.
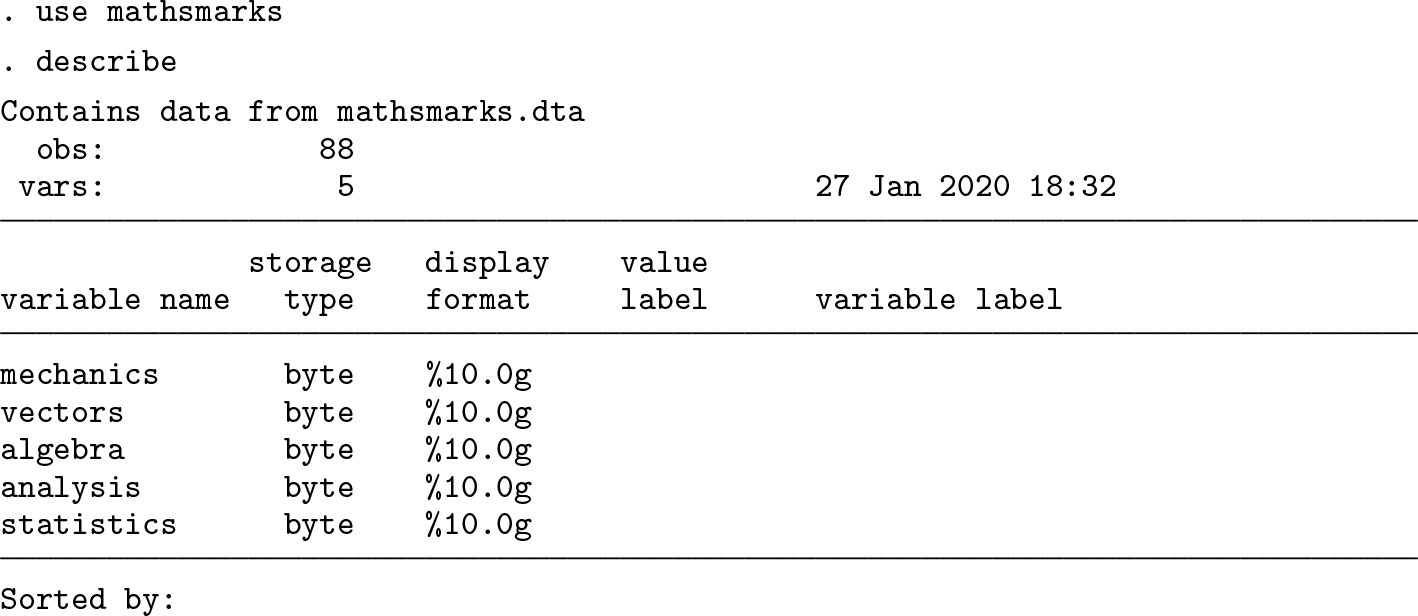
Evidently, we have splendidly evocative variable names like
No harm comes from looking at a graph. Figure 1 is a quantile-box plot (Parzen 1979). Each set of marks is plotted in ascending order (a quantile plot) with cumulative probability scales implicit on the horizontal axis. Boxes show median and quartiles, as in a conventional box plot. Plotting all the data points underlines the key point about such a box: 50% of the data points for each variable lie within each box (and so 50% lie outside). Finally, horizontal reference lines show the mean for each variable. The details of how to get such a plot are suppressed for a forthcoming column. Anyone intrigued by the result can download the program and help file using (Cox 2003)
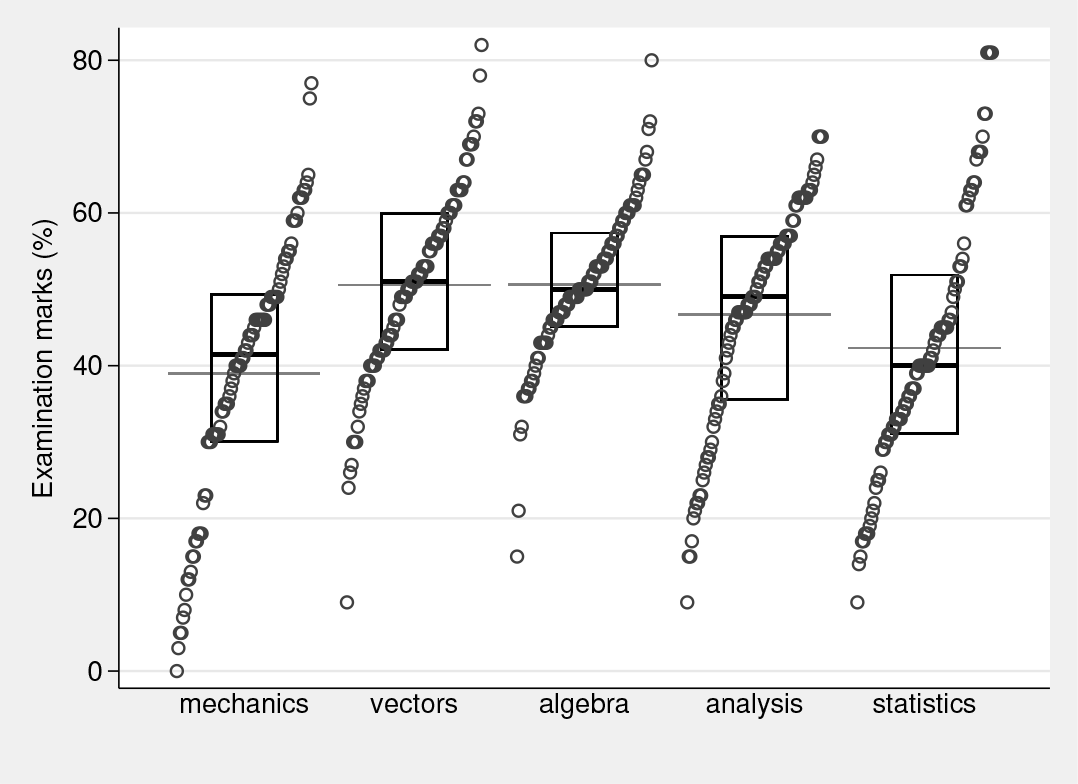
Distributions of the sandbox dataset. Quantiles, median and quartile boxes, and extra reference lines showing means.
Apart from allowing the usual kind of assessment of the distributions here—very simply, the variables are well behaved and, as advertised, percent marks—the graph serves as propaganda for a point of view. There is often, especially with small or modest datasets, scope for showing all the data without making the display too busy or too complex.
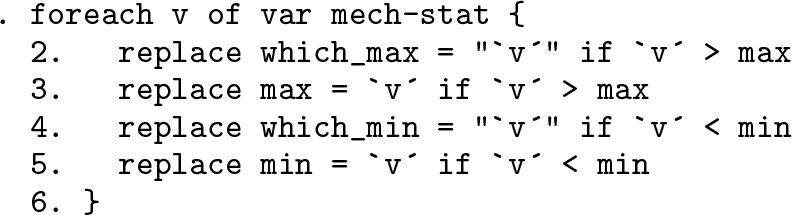
Here is a chunk of code confronting the ties issue that will be followed by commentary.
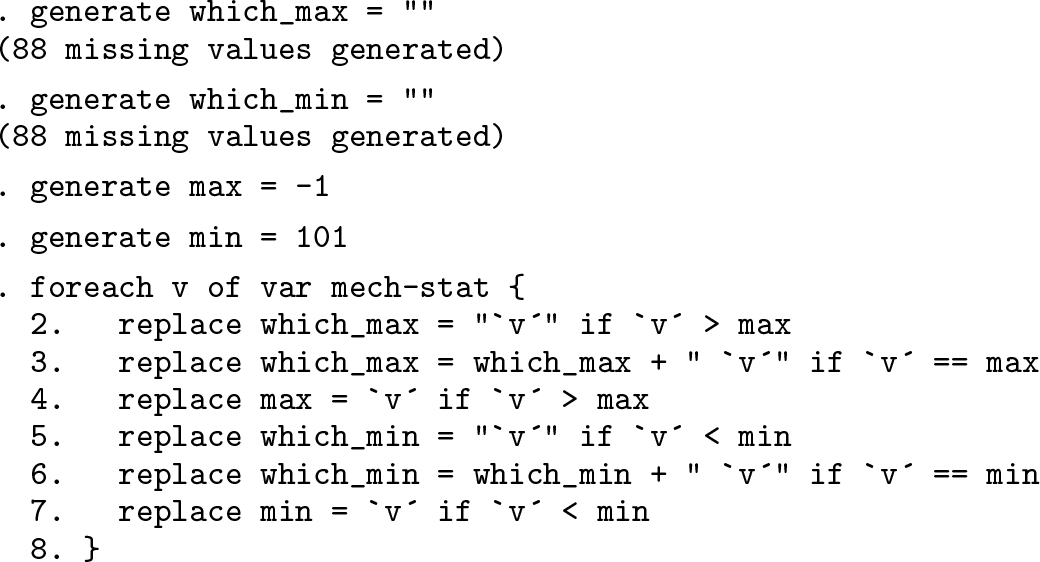
The general logic is first to initialize variables to hold the minimum and maximum values and the names of the variables in which they occur. Taste can supervene here in detail. Some people would use the name and values of the first variable in the loop, on the grounds that they could hold the minimum, the maximum, or both; and if they do not, we will change our minds accordingly. Remember that in different observations, a particular variable may hold both row minimums and row maximums; remember also that the loop rowwise includes implicitly a loop across observations. I have no feelings or recommendations against using the first name or the first value in initialization. Indeed, it is my practice sometimes, as a matter of caprice.
Caprice or not, a flag should be waved vigorously here. A
Here the code deliberately uses impossible values to initialize. We know that the marks range from 0 to 100 in principle and a quick plot, such as figure 1, or a
The overarching logic inside the loop has one theme. If the value we are looking at now is greater than the maximum so far, it is the new maximum. Symmetrically, if the value we are looking at now is less than the minimum so far, it is the new minimum.
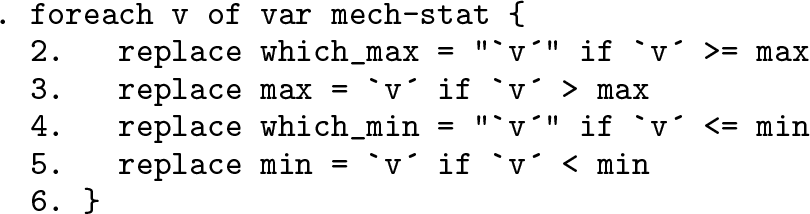
The tricky detail inside the loop concerns the handling of ties. If the value we are looking at now is as extreme as any seen yet, so equal to the maximum or minimum so far, then we add its name to the name or names we have stored so far. Again, this addition does or does not occur within individual observations, depending on the values of the variables.
Note a crucial tiny point: two or more variable names should be separated by spaces. Other punctuation such as commas is not of order but may not be so convenient. We need not worry about being forced into a dead end with no retreat, because a fresh minimum or maximum will lead to overwriting the names tentatively stored.
I would slap a
Let’s look at the results.
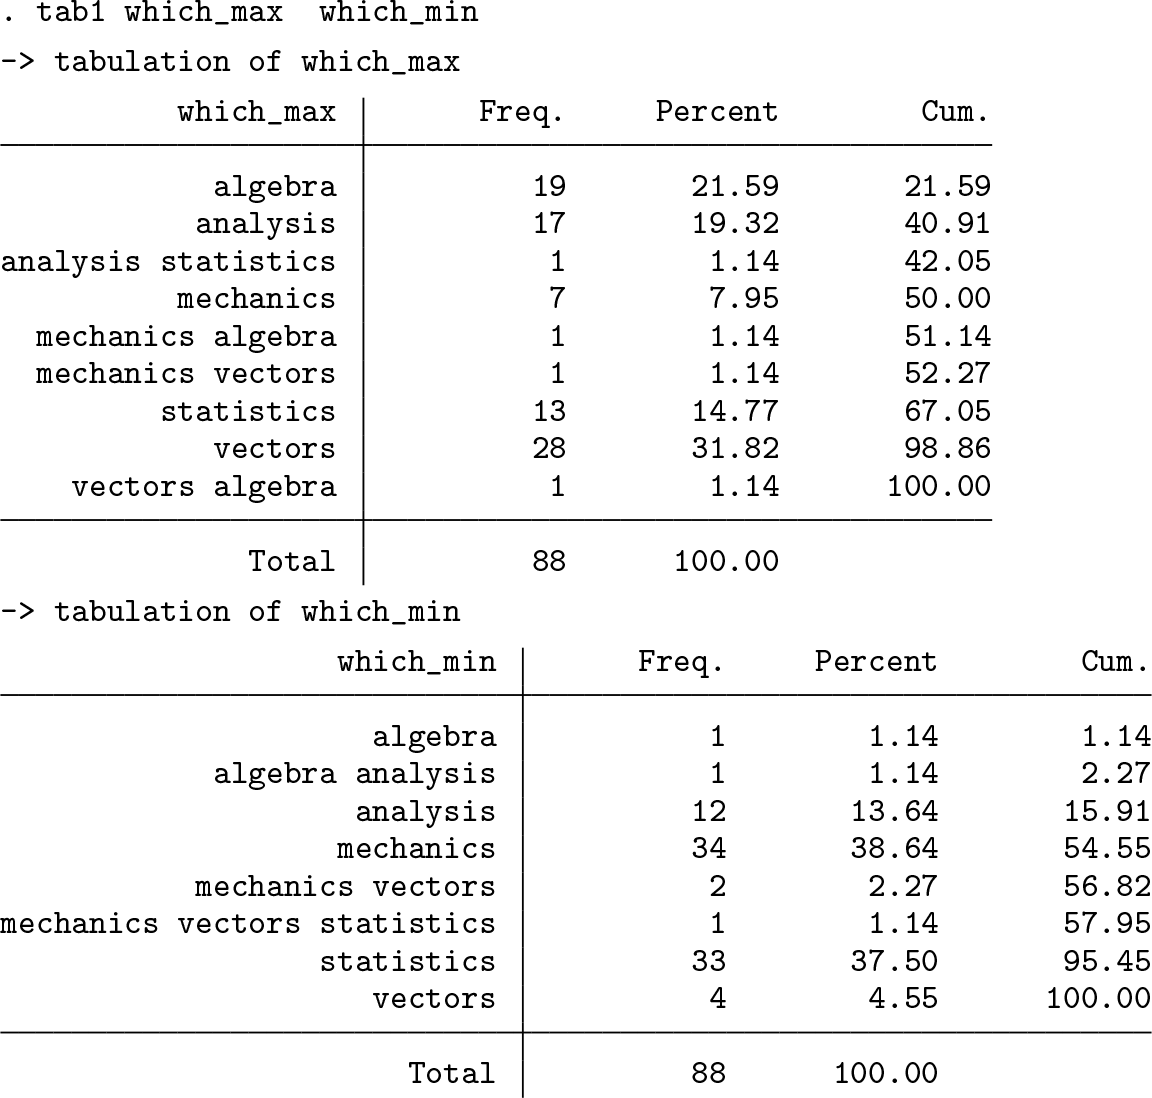
The results are not too complicated. Four students had two subjects at which they were equally good, and four had two or three subjects at which they were equally bad. Knowing that ties are uncommon, we might be confident at setting aside the ties and focusing on rank order. Because the
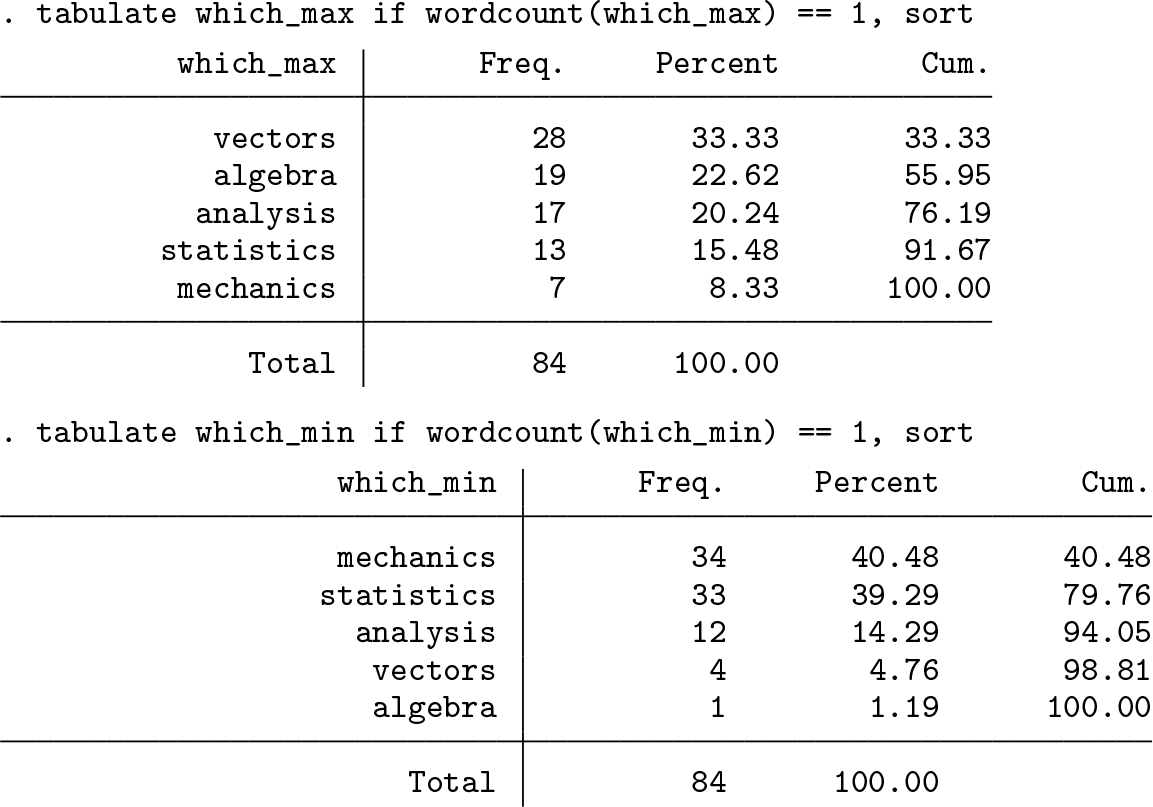
It looks bad for mechanics and statistics. Teachers (some of us) and past or present students (all of us) know the Law of Interpreting Exam Results: it is always the teachers’ fault. Good marks? The teaching was too elementary, the exam was too easy, or you were lucky that so many smart students chose your class. Bad marks? The teaching was poor or the exam was too hard. Naturally, there are no students who are not smart.
Back to the problem: let’s imagine a variant in which we are happy to record the maximum or maximum the first time it occurs. There might be some rationale for this, say, that variables have some time order and “first occurrence” is intrinsically interesting. Or it is just a variant on the problem, and we are thinking through the logic of the code.
The code is simpler, and we will not show results here, partly to save space and partly because there is no information that the variables in the example dataset have any kind of natural order. The initializations are the same; it is just the loop that differs.
In other words, the idea that the first variable met is the only variable that counts means that we ignore ties, ties being with a maximum or minimum previously observed.
As a final flourish, what about the opposite problem, in which only the last occurrence is remembered?
Here we overwrite names if we see a new instance of the maximum or minimum so far. Hence, we exit the loop with the last occurrence of a maximum or minimum recorded as the only occurrence remembered with a name.
3 Conclusion
Apart from the belated update flagging the introduction of
Supplemental Material
Supplemental Material, pr0046_1 - Speaking Stata: More ways for rowwise
Supplemental Material, pr0046_1 for Speaking Stata: More ways for rowwise by Nicholas J. Cox in The Stata Journal
References
Supplementary Material
Please find the following supplemental material available below.
For Open Access articles published under a Creative Commons License, all supplemental material carries the same license as the article it is associated with.
For non-Open Access articles published, all supplemental material carries a non-exclusive license, and permission requests for re-use of supplemental material or any part of supplemental material shall be sent directly to the copyright owner as specified in the copyright notice associated with the article.