We introduce the command xtserialpm to perform the portmanteau test developed in Jochmans (2019, Cambridge Working Papers in Economics No. 1993, University of Cambridge, Faculty of Economics). The procedure tests for serial correlation of arbitrary form in the errors of a linear panel model after estimation of the regression coefficients by the within-group estimator. The test is designed for short panels and can deal with general missing-data patterns. The test is different from the related portmanteau test of Inoue and Solon (2006, Econometric Theory 22: 835–851), which is performed by xtistest (Wursten, 2018, Stata Journal 18: 76–100), in that it allows for heteroskedasticity. In simulations documented below, xtserialpm is found to provide a more powerful test than xthrtest (Wursten 2018), which performs the test for first-order autocorrelation of Born and Breitung (2016, Econometric Reviews 35: 1290–1316). We also provide comparisons with xtistest and xtserial (Drukker, 2003, Stata Journal 3: 168–177). These tests perform well under stationarity but break down under even mild forms of heteroskedasticity.
Consider panel data on an outcome yi,t and a set of covariates xi,t, where i = 1,…, N and t = 1,…, T. The data are independent across groups i but may be dependent within groups. The workhorse specification to analyze such data is the regression model
where αi is a latent individual effect and εi,t is an idiosyncratic disturbance whose mean is normalized to zero. These disturbances are taken to be mean independent of the regressors and the individual effects but are otherwise allowed to be (conditionally) heteroskedastic and correlated within each group i. Our aim is to test whether the εi,t are correlated within groups. Although we do not make it explicit in the notation, everything to follow applies to settings where the panel is unbalanced (possibly with gaps) provided that missingness is at random. As such, the test discussed below is suitable for data with a group structure; the number of observations on a given group need not be the same, and the observations need not be collected over time. Examples are data on student test scores stratified by classroom or data on individual members of households.
The command xtserialpm, which we introduce in this article, performs a test for the (multivariate) null of no correlation at any order. The alternative is that at least one error pair is correlated. Thus, xtserialpm performs a portmanteau test. The test performed was developed in Jochmans (2019). This test is different from the portmanteau test of Inoue and Solon (2006), which is implemented in xtistest (Wursten 2018), and is robust to heteroskedasticity. This is important because requiring the errors to have a constant variance within each group is often unrealistic. One situation where heteroskedasticity will arise is when the error process is not in its steady state; this is typical in short panels. A second situation is where errors are conditionally heteroskedastic and some of the regressors are nonstationary. An example here would be a wage regression where the regressors include such characteristics as age, tenure and experience, and number of children, all of which are nonstationary.
The portmanteau paradigm is to be contrasted with an approach that tests against a specific alternative. Using a portmanteau test is of interest if no strong stand can be taken on the particular form of correlation that should serve as the alternative. This is relevant in many panel-data applications, especially when the observations for a given group do not have a natural ordering (such as time, for example). On the other hand, there are cases where attention may be limited to first-order autocorrelation patterns. In such a case, xtserial (Wooldridge 2010, 319–320; Drukker 2003) or its heteroskedasticity-robust version xthrtest (Born and Breitung 2016; Wursten 2018) may be of use.1 While tests against specific alternatives may have poor power if the alternative is ill chosen, they have the advantage that the dimension of the null hypothesis is independent of the sample size. A portmanteau test, on the other hand, necessarily has a null whose dimension grows with the length of the panel, T. Moreover, xtserialpm and xtistest are not well suited for panels where T(T − 1)/2 is not small relative to N.
We introduce the test that is the subject of this article in section 2. We give the syntax of the command xtserialpm, which implements the test, in section 3, and we provide an example in section 4. We give the results of a simulation study in section 5. The Monte Carlo analysis compares the performance of xtserialpm with xtistest, xtserial, and xthrtest in various settings. While xtistest and xtserial are competitive under homoskedasticity, they are unreliable under heteroskedasticity. Although xthrtest is designed to be size correct, it is found to have poor power. Moreover, it is virtually unable to detect most violations from the null, even those for which it was designed.
2 The test statistic
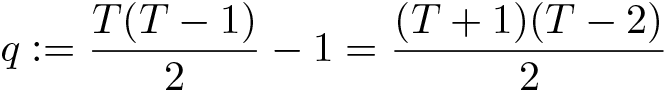
The presence of the group-level effect αi complicates the construction of a test based on the data in levels. The approach followed in Jochmans (2019) is to test the null that the difference between all pairwise within-group correlations are zero. There are T (T −1)/2 covariances, so
linearly independent differences. There are many ways of selecting q such differences. How they are chosen is irrelevant in practice because each will deliver numerically the same test statistic. A convenient way for notational purposes is as follows. Let Δ denote the first-differencing operator; that is, Δυi,t = υi,t − υi,t−1. Then, we test the null for all t and each t′ ≤ t − 2 and t′ = t + 1 against the alternative for some t and t′ ≤ t − 2 or t′ = t + 1.
An exercise in adding up shows that this indeed involves q moments. The rationale for them comes from the observation that
which is indeed the difference between two covariances. The main transition here uses
, which follows from iterated expectations and the assumption that
.
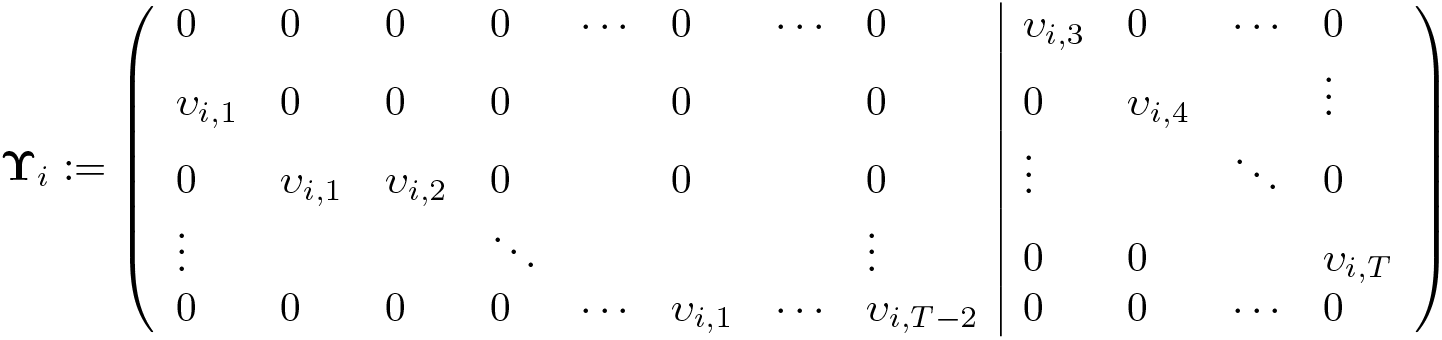
The q restrictions that make up our null can be written compactly as
where we have introduced the (T − 1) × q matrix
and the T × 1 vector υi := (υi,1,…, υi,T )⊤ and write D for the (T − 1) × T matrix first-difference operator; so Dυi = (Δυi,2,…, Δυi,T )⊤, for example. The left block of the matrix Υi is reminiscent of the instrument matrix for the generalized method of moments estimator of dynamic panel models (see, for example, Arellano [2003, 88–89]). The right block does not appear there, because it would not provide valid moment conditions in that context. The null can be tested using a minimum-distance statistic in a sample version of the moment restrictions as soon as three observations per group are available. Note that the dimension of the null grows with T. As such, the approach is designed for short panels, where q is small compared with N.
To make the test operational, we need to replace the unobserved υi,t with an estimator. For this, an estimator of β is needed. xtserialpm uses the within-group least-squares estimator (as computed by xtreg, fe),
where we have collected all observations for a given group in yi := (yi,1,…, yi,T )⊤ and Xi := (xi,1,…, xi,T )⊤ and M denotes the usual T × T projection matrix that transforms observations into deviations from within-group means. Given b, the residuals
can be used as estimators of the υi,t.
We then define
where the matrix Ui is the sample version of Υi constructed using the residuals ui,t in place of the unobservable υi,t; that is,
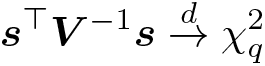
and we have introduced ui := (ui,1,…, ui,T )⊤. The test statistic for our null can then be written as the quadratic form
where and V is an estimator of the variance of s. xtserialpm uses the uncentered estimator
as the default. Use of a centered variance estimator is available as an option. In the simulations reported on below, we found that use of the centered estimator is power enhancing but comes at the expense of size distortion in small samples.
Our test statistic has an interpretation that explains its form. Because the second part of si sums to zero, we have
This is a sample version of the moments we are aiming to test. The second part of si is present to ensure that V is a consistent estimator of the variance of s. Moreover, the naive variance estimator ignores the fact that the statistic is constructed with residuals rather than (unobservable) errors and will generally not be consistent.
Under the null,
as N → ∞. A test of our null then amounts to comparing the test statistic with the quantiles of the distribution. Large values are evidence against the null of no serial correlation. This test is consistent against any alternative except the one where all covariances are constant.2 Asymptotic power results and calculations for special cases are provided in Jochmans (2019).
3 The xtserialpm command
xtserialpm is a standalone command that one can run without first running xtreg. You must xtset your data prior to executing xtserialpm. Unbalanced panel data are allowed.
The command has the following syntax:
xtserialpmdepvar [ indepvars] [if] [in] [, center noisily ]
center returns the test statistic computed with a centered covariance matrix as discussed above.
noisily displays the preliminary within-group estimator. The output is the same as that produced by xtreg, fe.
Running the command produces a table with the value of the test statistic and the associated p-value. The layout of the table mimics the layout of the table produced by xtserial.
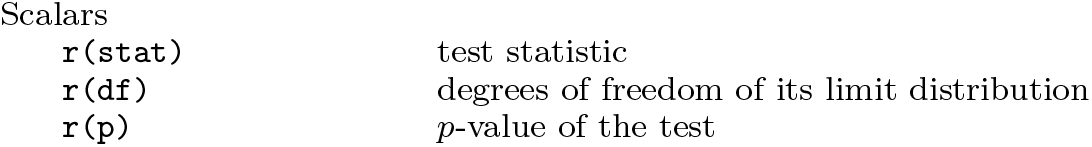
xtserialpm stores the following in r():
Help is available by typing help xtserialpm.
4 Example
We use the data from the illustration in Drukker (2003). The following extract loads the data:
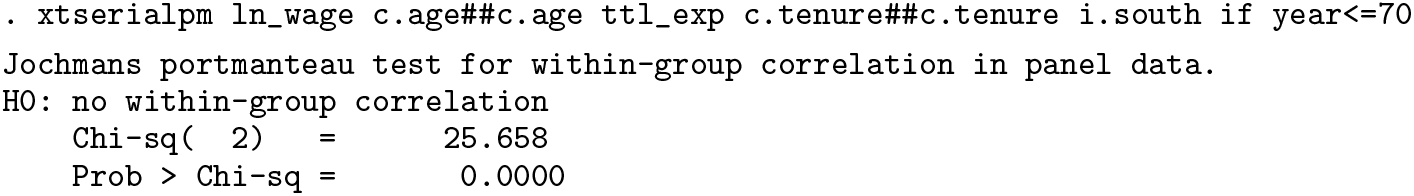
The portmanteau test is computed as
The result provides strong evidence for the presence of serial correlation in the errors.
To compute the test statistic using a centered covariance matrix estimator, use the center option as follows:
The test statistic is slightly larger, and our initial conclusion is unaltered.
To perform the test of Inoue and Solon (2006) in this example, we first generate residuals from the within-group regression by typing
We then perform the test on these residuals:
By default, xtistest checks for correlation (in the within-group residuals) up to the second order only.3,4 Here xtistest is used with the lags() option set to all so that the command yields the portmanteau test as originally introduced in Inoue and Solon (2006).
The output of the test is
The same conclusion regarding our null is reached.
5 Simulations
We provide size and power comparisons between xtserialpm, xtistest, xthrtest, and xtserial. We consider different specifications for the errors and provide results for different panel dimensions. In all cases, outcomes were generated with fixed effects drawn from a standard normal and with two regressors—the first standard normal and the second zero or one according to the toss of a fair coin—each with a coefficient set to unity. From the time-series literature, we consider alternative specifications where the errors follow a first-order autoregressive or first-order moving-average process. Both xtserial and xthrtest were designed specifically to detect such forms of serial correlation. It is straightforward to concoct specifications of the error process where these tests will not be able to detect any deviation from the null.
Our first set of results concerns first-order autoregressive error processes of the form
where the innovations ηi,t are independent standard normal. Here the null corresponds to ρ = 0. In (A1), we draw the initial value εi,1 from its steady-state distribution. This implies that the error process is strictly stationary (and hence homoskedastic). In (A2), we set εi,1 = 0 for all groups. This introduces time-series heteroskedasticity for any value of the autoregressive coefficient. Moreover, we have
and so on. The heteroskedasticity is mild but present both under the null and the alternative.
We present simulation results for panels with N = 100 and T ∊ {3, 6, 9}. This corresponds to q ∊ {2, 14, 35}, which, relative to N, can be considered small, moderate, and large. Results are reported in figure 1 by means of power plots (as obtained over 10,000 replications). For each test, the power curve plots the rejection frequency of the test against the value for ρ ∊ (−1, 1) that was used to generate the data. A test is size correct if its rejection frequency under the null equals its size (here set to 5%, the level at which the horizontal axis is set). For a given alternative, the rejection frequency is the complement of the probability of making a type II error. Hence, given two tests that are both size correct, the one with a higher rejection frequency is superior. The plots in figure 1 contain the power curves for the portmanteau tests xtserialpm (full) and xtistest (dashed) as well as for the tests targeted to detect autocorrelation at first-order, xthrtest (dotted) and xtserial (dashed-dotted). Note that xthrtest requires T ≥ 4 and so is absent from the plots for T = 3; T ≥ 3 suffices for the other three tests.
Power against first-order autoregressive alternatives; power is reported for xtserialpm (solid line), xtistest (dashed line), xthrtest (dotted line), and xtserial (dashed-dotted line)
The left plots shows that, under homoskedasticity, all tests control size well. The command xtserial performs best here, which is not surprising given that this is the ideal setting for this test. Both the portmanteau tests do well and are roughly equally able to reject the null when it is false. xtserialpm does better in the shortest panel, while xtistest does better in the longest panel. Both observations arise from the fact that xtserialpm tests more moment conditions. xthrtest lacks power against most alternatives. Although its ability to detect violations from the null improves somewhat with the length of the panel, it is uniformly outperformed by all other tests even in the longest panel considered here.
The right plots show the impact of time-series heteroskedasticity on all the tests. Being robust to heteroskedasticity, both xtserialpm and xthrtest continue to be size correct. Moreover, the heteroskedasticity improves the power of xtserialpm relative to the stationary case, especially for T = 3. xthrtest, on the other hand, continues to struggle to detect any violation of the null. Both xtserial and xtistest are now severely size distorted, with their probability of a type I error far exceeding 5%. Because |ρ| < 1, the error process is mean reverting and so will become stationary as t → ∞. Moreover, the errors become homoskedastic for large values of t. This explains why the performance of xtserial improves as T grows. Of course, no such improvement occurs for xtistest. On the other hand, we stress that the properties of xtserial and xtistest would not improve if instead N would increase.
Our second set of simulation results involves moving-average processes of order one; that is,
where the innovations ηi,t are again independent standard normal. The null corresponds to θ = 0. In (B1), we draw the initial value ηi,0 from the standard normal distribution, again implying stationarity. In (B2), we set ηi,0 = 0. This leads to heteroskedasticity under the alternative but not under the null. This is different from (A2). Here, because errors are homoskedastic under the null, all tests will remain size correct. Note that heteroskedasticity is limited to the first observation, εi,1, whose variance is equal to 1; εi,2,…, εi,T all have variance 1 + θ2.
Figure 2 provides the power curves for these two specifications. We plot power against the first-order autoregressive coefficient (under stationarity), ρ. This coefficient is one to one with θ in the sense that
Power against first-order moving-average specifications; power is reported for xtserialpm (solid line), xtistest (dashed line), xthrtest (dotted line), and xtserial (dashed-dotted line)
when and θ = 0 if ρ = 0. Note that −(1/2) ≤ ρ ≤ (1/2). The main conclusions from the autoregressive specifications carry over. Both xtserial and xtistest do well under homoskedasticity but have erratic power patterns under heteroskedasticity. xthrtest, although size correct, continues to be incapable of detecting any violation from the null. xtserialpm performs well in all specifications and, as such, yields the most reliable test.
6 Conclusion
We have introduced the command xtserialpm to test for arbitrary patterns of serial correlation in the errors of a fixed-effects regression model fit from short panel data. Contrary to the existing portmanteau test performed by xtistest, it is robust to heteroskedasticity. Both tests are designed for micropanels. For macropanels, where T is not small relative to N, only tests against specific alternatives can properly control size. Such tests are implemented in xtserial and xthrtest. Simulation evidence shows that even mild forms of heteroskedasticity make the properties of xtistest and xtserial break down. Unfortunately, heteroskedasticity in short panels is the rule rather than the exception. Further, xthrtest, although size correct under heteroskedasticity, is far less powerful than xtserialpm even when the alternative under question is characterized by well-pronounced dependence at first order. The conclusion from the theory and simulation evidence presented here is that, when heteroskedasticity is suspected, only xtserialpm will provide a suitable test when T (T − 1)/2 is small compared with N. On the other hand, only xthrtest is guaranteed to be size correct when T (T − 1)/2 is large relative to N. However, it may not pick up violations from the null if they do not occur at first order. Furthermore, even if they do, our simulations show that the test needs the sample size to be substantial to safeguard against type II errors with reasonable probability.
Footnotes
7 Acknowledgments
Koen Jochmans gratefully acknowledges financial support from the European Research Council through Starting Grant n° 715787. Vincenzo Verardi gratefully acknowledges financial support from the FNRS. Comments and suggestions by Helmut Farbmacher and an anonymous referee were much appreciated.
8 Programs and supplemental materials
To install a snapshot of the corresponding software files as they existed at the time of publication of this article, type
Notes
References
1.
ArellanoM.2003. Panel Data Econometrics. Oxford: Oxford University Press.
InoueA.SolonG.2006. A portmanteau test for serially correlated errors in fixed effects models. Econometric Theory22: 835–851. https://doi.org/10.1017/S0266466606060385.
5.
JochmansK.2019. Testing for correlation in error-component models. Cambridge Working Papers in Economics No. 1993, University of Cambridge, Faculty of Economics. https://doi.org/10.17863/CAM.47807.
6.
WooldridgeJ. M.2010. Econometric Analysis of Cross Section and Panel Data. 2nd ed. Cambridge, MA: MIT Press.