
Abstract
Receiver operating characteristic (ROC) analysis is used for comparing predictive models in both model selection and model evaluation. ROC analysis is often applied in clinical medicine and social science to assess the tradeoff between model sensitivity and specificity. After fitting a binary logistic or probit regression model with a set of independent variables, the predictive performance of this set of variables can be assessed by the area under the curve (AUC) from an ROC curve. An important aspect of predictive modeling (regardless of model type) is the ability of a model to generalize to new cases. Evaluating the predictive performance (AUC) of a set of independent variables using all cases from the original analysis sample often results in an overly optimistic estimate of predictive performance. One can use K-fold cross-validation to generate a more realistic estimate of predictive performance in situations with a small number of observations. AUC is estimated iteratively for k samples (the “test” samples) that are independent of the sample used to predict the dependent variable (the “training” sample).
Keywords
1 Introduction
Receiver operating characteristic (ROC) analysis is used for comparing predictive models in both model selection and model evaluation (Pepe 2000). ROC analysis is often applied in clinical medicine and social science to assess the tradeoff between model sensitivity (Se) and specificity (Sp) (Collins et al. 2015). After fitting a binary logistic regression model with a set of independent variables, the predictive performance of this set of variables can be assessed by the area under the curve (AUC) from an ROC curve (Pepe et al. 2008b).
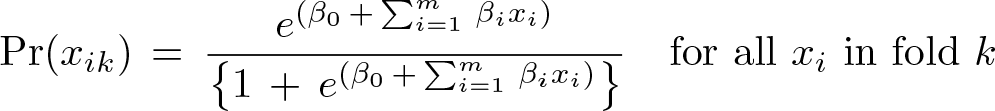
In binary classification, the model prediction is often made based on a continuous random variable X, which is a “score” computed as the linear predictor in a logistic regression model. Given a threshold parameter T , the score is classified as “positive” if X > T and as “negative” otherwise. X follows a probability density f
1(x) if the score actually belongs to class “positive” and a probability density f
0(x) otherwise. Therefore, the true-positive rate (TPR) is given by
The AUC is a global summary measure of diagnostic accuracy and discrimination (that is, the ability for the logistic model to classify patients as cases and controls). It ranges from 0.5 for accuracy of chance to 1 for perfect accuracy. The closer the curve follows the left-hand border and then the top border of the ROC space, the more area there is under the curve and the more accurate the test. The closer the curve follows the 45-degree diagonal of the ROC space, the less accurate the test. The greater the AUC, the better the test can capture the tradeoff between Se and Sp over a continuous range.
When using normalized units, the AUC is equal to the integral

where X 1 is the score for a positive instance, X 0 is the score for a negative instance, and f 0 and f 1 are probability densities (Fawcett 2006).
An important aspect of predictive modeling (regardless of model type) is the ability of a model to generalize to new cases (Altman et al. 2009). Evaluating the predictive performance (AUC) of a set of independent variables using all cases from the original analysis sample often results in an overly optimistic estimate of predictive performance (LeDell, Petersen, and van der Laan 2015). K-fold cross-validation can generate a more realistic estimate of predictive performance (Pepe, Feng, and Gu 2008a), in contrast with having only one random split of the data into two groups (training and test) when the number of observations is small (LeDell, Petersen, and van der Laan 2015).
Cross-validation is one of the most common resampling techniques for evaluating predictive models. It consists of splitting a sample into several pairs of training and test sets. Usually only one random split into K groups is used, although some prefer to repeat the procedure several times. Cross-validation can be used to estimate TPR and FPR from which ROC curves can be derived and corresponding AUCs calculated. Cross-validation requires that a sample be partitioned into K parts for each randomization. Then K models are generated, each of them built without the cases in the kth partition, which is used for evaluation. That is, each observation xi is part of one of the K partitions, with (k) returning the partition to which xi belongs, resulting in Xik observations. A special case when K = n (the number of observations) is called leave-one-out cross-validation or the jackknife procedure. Many applications use K = 5 or 10 (James et al. 2013) and perform only one random data split.
Designed for fitting binary logit and probit regression models with a set of independent variables,
We then assume that we applied a diagnostic test classifying each Xik observation as a normal or abnormal subject. Further assume that the higher the outcome value of the diagnostic test, the higher the risk of the subject being abnormal. The points on the nonparametric ROC curve are generated using each possible outcome of the diagnostic test as a classification cutpoint and computing the corresponding Se and 1−Sp for each cutoff in fold k. These points are then connected by straight lines, and the area under the resulting ROC curve is computed using the trapezoidal rule (see the Appendix ). The default standard error for the area under the ROC curve is computed using the algorithm described by DeLong, DeLong, and Clarke-Pearson (1988).
However,
2 The cvauroc command
2.1 Syntax
depvar represents a binary outcome.
varlist is the list of independent factors whose predictive performance is tested.
2.2 Options
Se (_
3 Illustration
We will use an excerpt from Cattaneo (2010) that looks at 4,642 singletons born in Pennsylvania in 1989–1991. We aim to estimate the probability of delivering a low birthweight (
We will also show the output generated for the
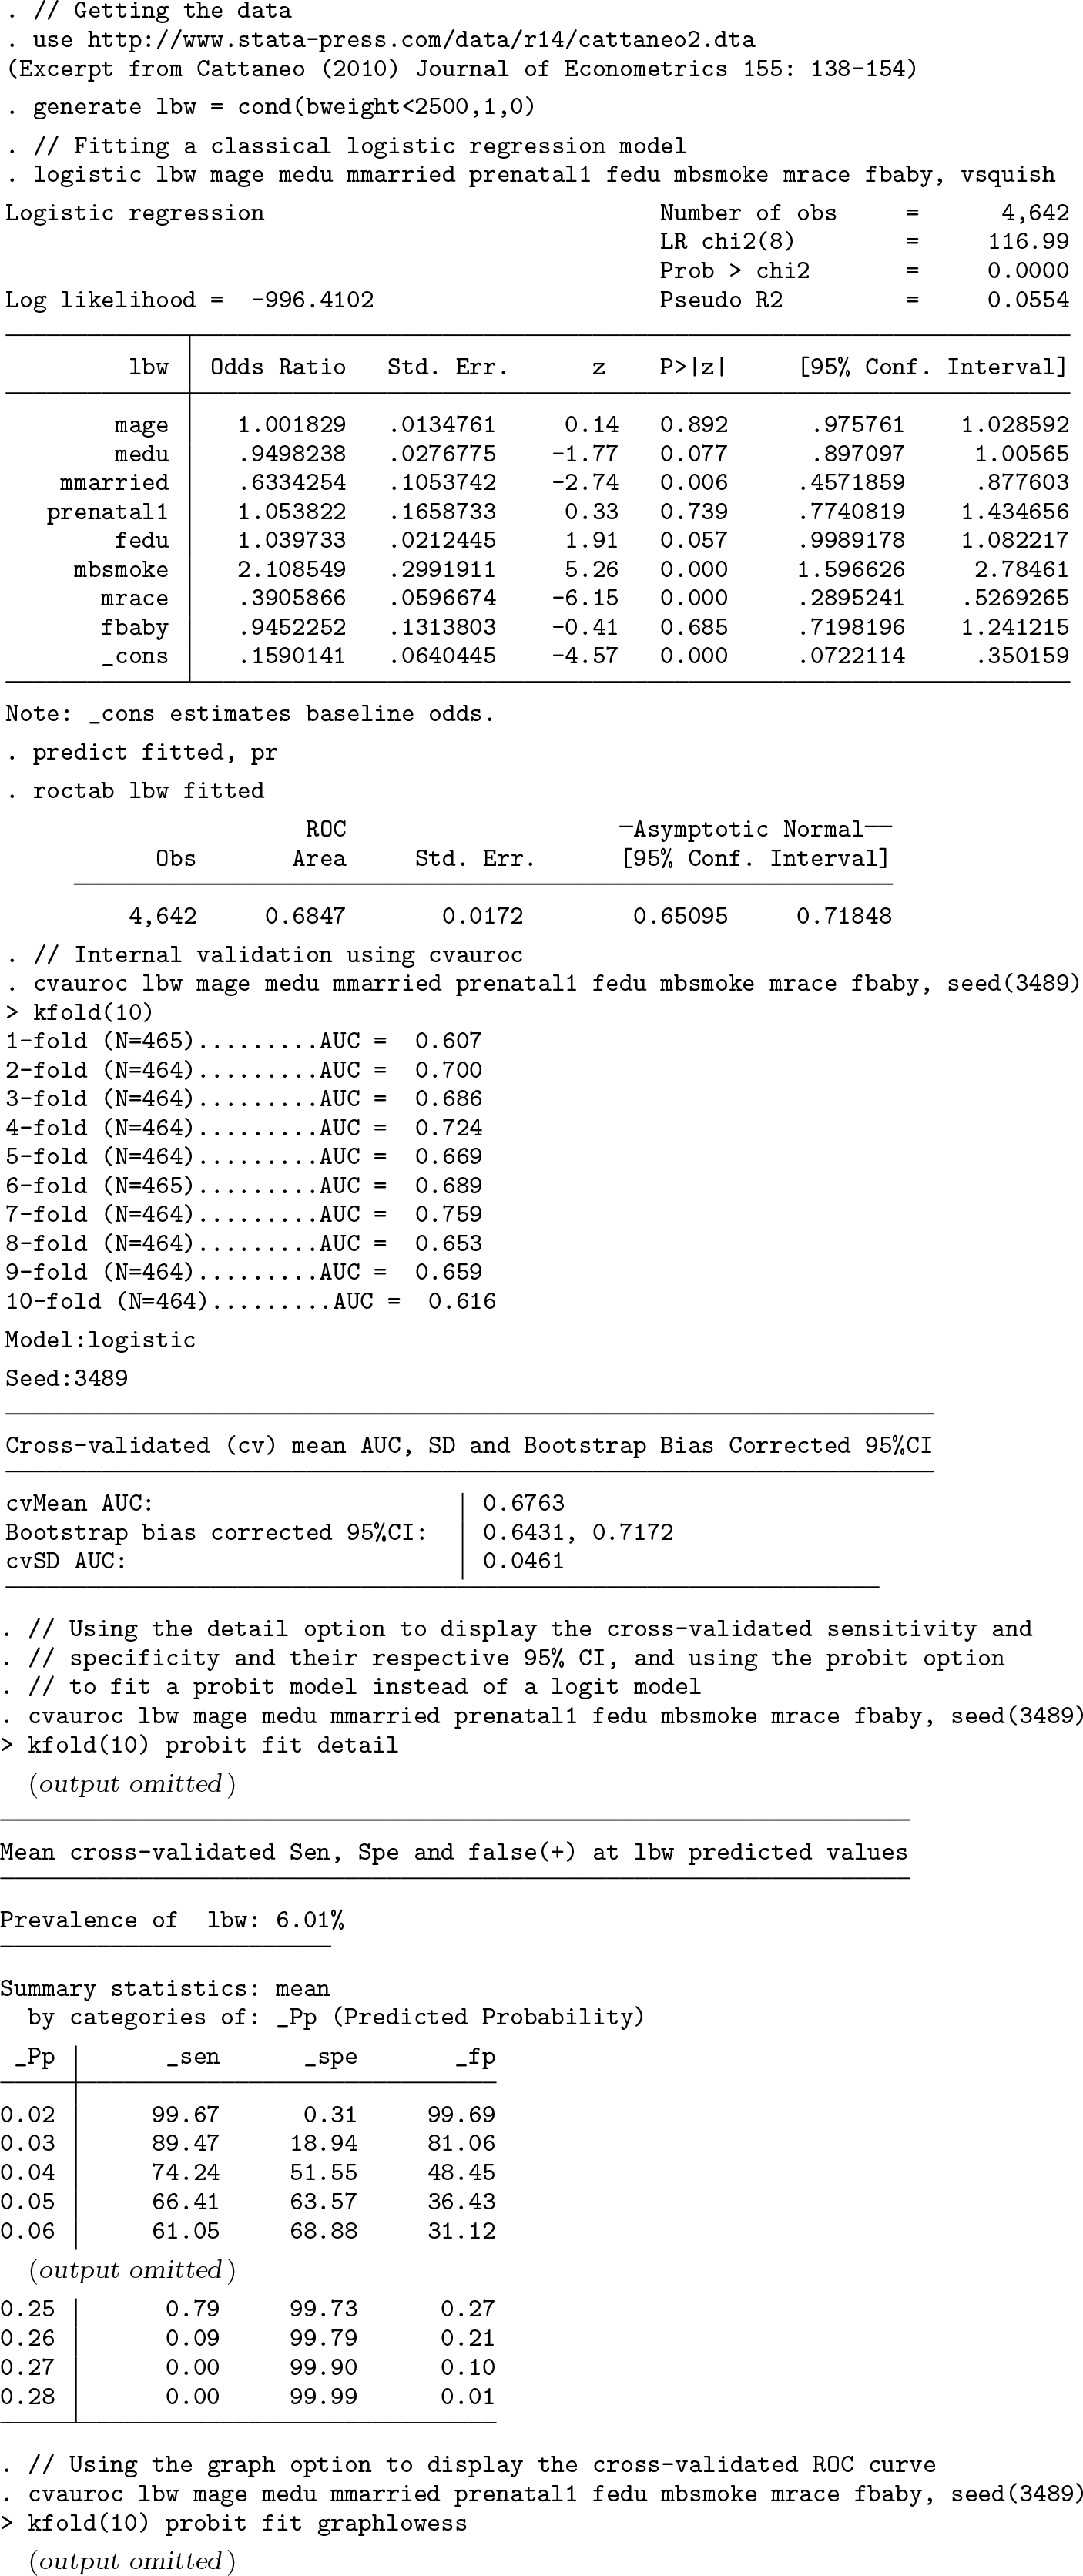

K-fold AUC and cross-validated AUC using
Maternal smoking status and race are the strongest predictors of low birthweights, with babies from smoking mothers having twice the risk of low birthweights. There is further evidence that marital status, father’s education, and mother’s education are associated with low birthweights. The AUC calculated using
To illustrate

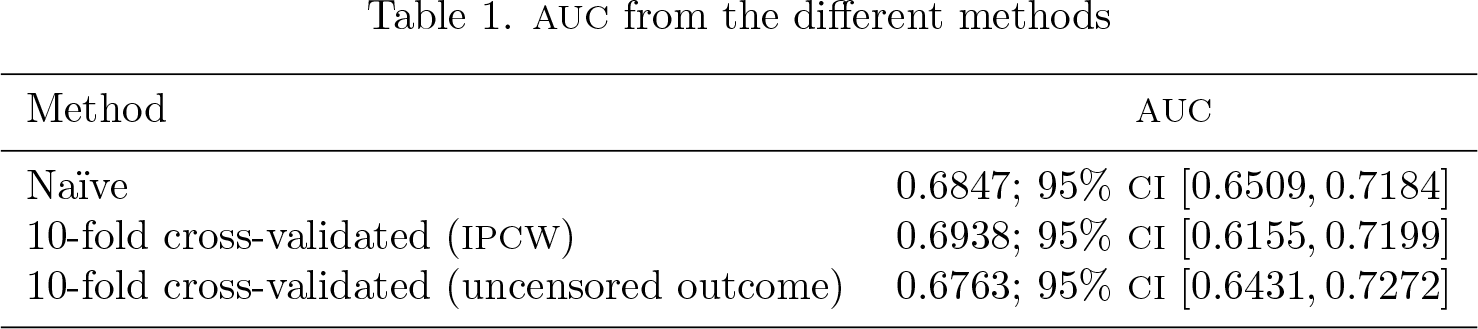
Table 1 shows the AUC for the naïve and
AUC from the different methods
4 Conclusion
To summarize, we have shown that evaluating the predictive performance of a set of independent variables using all cases from the original analysis sample tends to result in an overly optimistic estimate of predictive performance. However,
6 Programs and supplemental materials
Supplemental Material, st0569 - cvauroc: Command to compute cross-validated area under the curve for ROC analysis after predictive modeling for binary outcomes
Supplemental Material, st0569 for cvauroc: Command to compute cross-validated area under the curve for ROC analysis after predictive modeling for binary outcomes by Miguel Angel Luque-Fernandez, Daniel Redondo-Sánchez and Camille Maringe in The Stata Journal
Footnotes
5 Acknowledgment
Miguel Angel Luque-Fernandez is supported by the Spanish National Institute of Health, Carlos III Miguel Servet I Investigator Award (CP17/00206).
6 Programs and supplemental materials
To install the latest version of
![]() ).
).
Then, type the following to install
To uninstall the package, type
Note: The
To install a snapshot of the corresponding software files as they existed at the time of publication of this article, type
Appendix
The trapezoidal rule is a technique for approximating the definite integral
The trapezoidal rule works by approximating the region under the graph of the function f(x) as a trapezoid and calculating its area. It follows that
where Δx = (b − a)/n and xi = a + iΔx.
The trapezoidal rule may be viewed as the result obtained by averaging the left and right Riemann sums.
References
Supplementary Material
Please find the following supplemental material available below.
For Open Access articles published under a Creative Commons License, all supplemental material carries the same license as the article it is associated with.
For non-Open Access articles published, all supplemental material carries a non-exclusive license, and permission requests for re-use of supplemental material or any part of supplemental material shall be sent directly to the copyright owner as specified in the copyright notice associated with the article.