
Abstract
In August 2017, the National Center for Health Statistics (NCHS), part of the U.S. Federal Statistical System, published new standards for determining the reliability of proportions estimated using their data. These standards require one to take the Korn–Graubard confidence interval (CI), CI widths, sample size, and degrees of freedom to assess reliability of a proportion and determine whether it can be presented. The assessment itself involves determining whether several conditions are met. In this article, I present
Keywords
1 Introduction
When calculating a confidence interval (CI) for proportions, Stata by default calculates the “exact” CI, known in the broader literature as the Clopper–Pearson binomial CI (Clopper and Pearson 1934). This CI is more optimal with proportions based on fewer events than other CIs such as the Wald (Newcombe 1998; Dean and Pagano 2015). However, to calculate this CI for proportions estimated for survey data that use a complex, multistage cluster design, one should apply an adjustment specified by Korn and Graubard (1998). This adjustment is applicable when analyzing data from many nationally representative health surveys, which often use samples with a complex design (Korn and Graubard 1999).
The Korn–Graubard adjustment to the Clopper–Pearson CI (or more simply the Korn–Graubard CI) is also a key component in presentation standards for proportions that are published by the National Center for Health Statistics (NCHS) (Parker et al. 2017). The NCHS is part of the U.S. Federal Statistical System and is the principal health statistics agency of the U.S. Department of Health and Human Services. The agency’s mission is to provide statistical information that will guide actions and policies to improve the health of the American people. In August 2017, NCHS began using the Korn–Graubard CI, along with information on CI width, sample size, and degrees of freedom (DF), to assess the reliability of a proportion and determine whether it can be presented as an official estimate. Researchers using NCHS survey data who wish to follow these same presentation standards must now calculate the Korn–Graubard CI and use this CI to apply them.
In this article, I present the postestimation command
2 Korn–Graubard CIs
2.1 Calculation
The Korn–Graubard CI involves a modification to the binomial CI frequently used in a nonsurvey setting (Korn and Graubard 1998) and was developed for use when estimating proportions using a sample with a complex design and when the proportion, sample size, or both are small (Gray, Haslett, and Kuzmicich 2004). To calculate the Korn–Graubard CI for proportion p (Korn and Graubard 1998) as used in the

or the product of p and its complement (1 − p) divided by variance of p. Here p is the proportion, (1 − p) is the complementary proportion, and var(p) is the variance of p. Limits are set such that when p = 0, then n ∗ = n (where n is the sample size). The effective sample size is then adjusted by the DF, or the difference in number of primary sampling units (PSUs) and number of strata. This DF-adjusted effective sample size (n ∗DF) is defined as
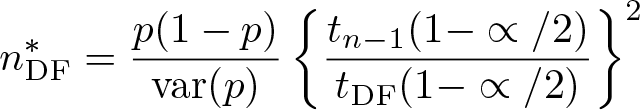
Here the unadjusted effective sample size n ∗ is multiplied by the t distribution of n − 1 divided by the t distribution of DF, squared (note ∝ represents the significance level). Limits are also placed here such that if p = 0, then n ∗DF = n.
The next series of steps in calculating a Korn–Graubard CI begins with adjusting the number of x positive responses for n ∗DF such that

The number of positive responses (x) is then used to calculate v 1 through v 4 DF, which are needed to calculate the F distribution and ultimately to produce the Korn–Graubard CI:

Finally, the CI (Korn and Graubard 1998) can be calculated for x number of positive responses with the DF-adjusted effective sample size of n ∗DF, where the lower limit of the interval (pL ) is

and the upper limit of the interval (pU ) is

2.2 NCHS presentation standards for proportions
The NCHS Data Presentation Standards for Proportions (Parker et al. 2017) were developed to assess the reliability of a proportion and determine whether it should be presented. Note that these standards do not address issues surrounding confidentiality, which may also be separately assessed to determine whether a proportion should not be presented. In addition, while these standards primarily focus on estimates calculated from survey data, they also discuss estimates resulting from population data (specifically, NCHS vital statistics). However, the Korn–Graubard CI does not apply to estimates from population data and therefore does not apply to the
Prior to assessing the reliability of a proportion using the NCHS standards, some final calculations are needed using the Korn–Graubard CI, specifically, the absolute and relative widths of the CI. Here the absolute width of the Korn–Graubard CI is defined by pU (x, n ∗DF) − pL (x, n ∗DF). The relative widths are calculated for both the proportion p and its complement (1 − p). Here the relative width for p is defined as {pU (x, n ∗DF) − pL (x, n ∗DF)}/p and for 1 − p as {pU (x, n ∗DF) − pL (x, n ∗DF)}/(1 − p).
According to the NCHS standards (Parker et al. 2017), proportion p is considered unreliable and would not be presented if any of the following are true: a) n < 30 or n ∗ < 30, b) the absolute width of its Korn–Graubard CI is ≥ 0.30, or c) its absolute CI width is > 0.05 and < 0.30, and its relative CI width is > 130% of the proportion. These thresholds were decided upon for the standards while keeping in mind that the Korn–Graubard CI is known to be conservative (Brown, Cai, and DasGupta 2001; Gray, Haslett, and Kuzmicich 2004).
If any of the aforementioned conditions are met, proportion p is suppressed. However, the NCHS standards also have additional considerations: a) the absolute CI width is ≤ 0.05 and either p = 0 or 1 − p = 0, or b) the absolute CI width is ≤ 0.05 and DF < 8. In these instances, a statistical review of the estimate should be given to determine whether it could be presented or should be suppressed. While within NCHS, this review would be performed by a clearance official, for general Stata users, this review might entail a manual assessment by either the user or a knowledgeable statistician.
The final consideration when applying the NCHS standards is to assess the reliability of the complement of proportion p. During instances where p is presented, its complement (1 − p) should also have the NCHS standards applied to it to assess the complement’s reliability. If 1 − p is found to be unreliable, per standards p can still be presented; however, a footnote should be added that states its complement does not meet the standards. Note that this assessment of 1 − p should be given regardless if 1 − p is intended to be presented.
3 The kg_nchs command
3.1 Syntax
The syntax is simply
Because this is a postestimation command for proportions using survey data, it can be executed only immediately following a
3.2 Description
The
The second set of results pertains directly to the NCHS standards and presents three separate dichotomous flags (0 = no; 1 = yes) for each proportion. The first flag signals whether a proportion meets all presentation standards and is considered reliable. The second flag signals whether a proportion is flagged for statistical review. The third and final flag pertains to the complementary proportion and signals whether the complement meets all presentation standards and is considered reliable. Used together, these flags provide Stata users with a quick method of assessing whether a proportion meets these comprehensive standards without the need for performing manual calculations.
3.3 Understanding DF and restriction following the over() option
For complex sample surveys, one general rule is to calculate DF as the number of PSUs minus the number of strata. Note that this is not the only way. For example, when calculating national estimates using the NCHS National Health Interview Survey, DF are assumed to be large enough for a normal approximation, and DF may be calculated as n − 1 (National Center for Health Statistics 2006; Parker et al. 2017). However, the number of PSUs minus the number of strata is the approach used with most NCHS surveys (Parker et al. 2017) and in Stata software. Therefore, this approach is used in the
Because DF play a critical role in both the adjustment of the effective sample size and determining whether a proportion should be flagged for statistical review, Stata users should clearly understand how DF are calculated for use in
Therefore, to prevent the incorrect PSU and strata counts from being used, the
4 Empirical examples
The proceeding examples use public-use data from the 2014 National Ambulatory Medical Care Survey (NAMCS), which consists of 45,710 patient visits. NAMCS is an annual survey conducted by NCHS that is representative of ambulatory visits made to nonfederal, office-based physicians in the United States. Details on the design, methods, and content of NAMCS can be found elsewhere (National Center for Health Statistics 2017).
The following example uses 2014 NAMCS data and the


Here 1.6% of visits were made by patients with congestive heart failure, while 98.4% were made by patients without congestive heart failure. The
The next example again examines office-based physician visits by patients with congestive heart failure but specifically among the subgroup of Hispanic women aged ≥ 65 years. With a smaller subgroup of 440 observations, reliability issues exist.
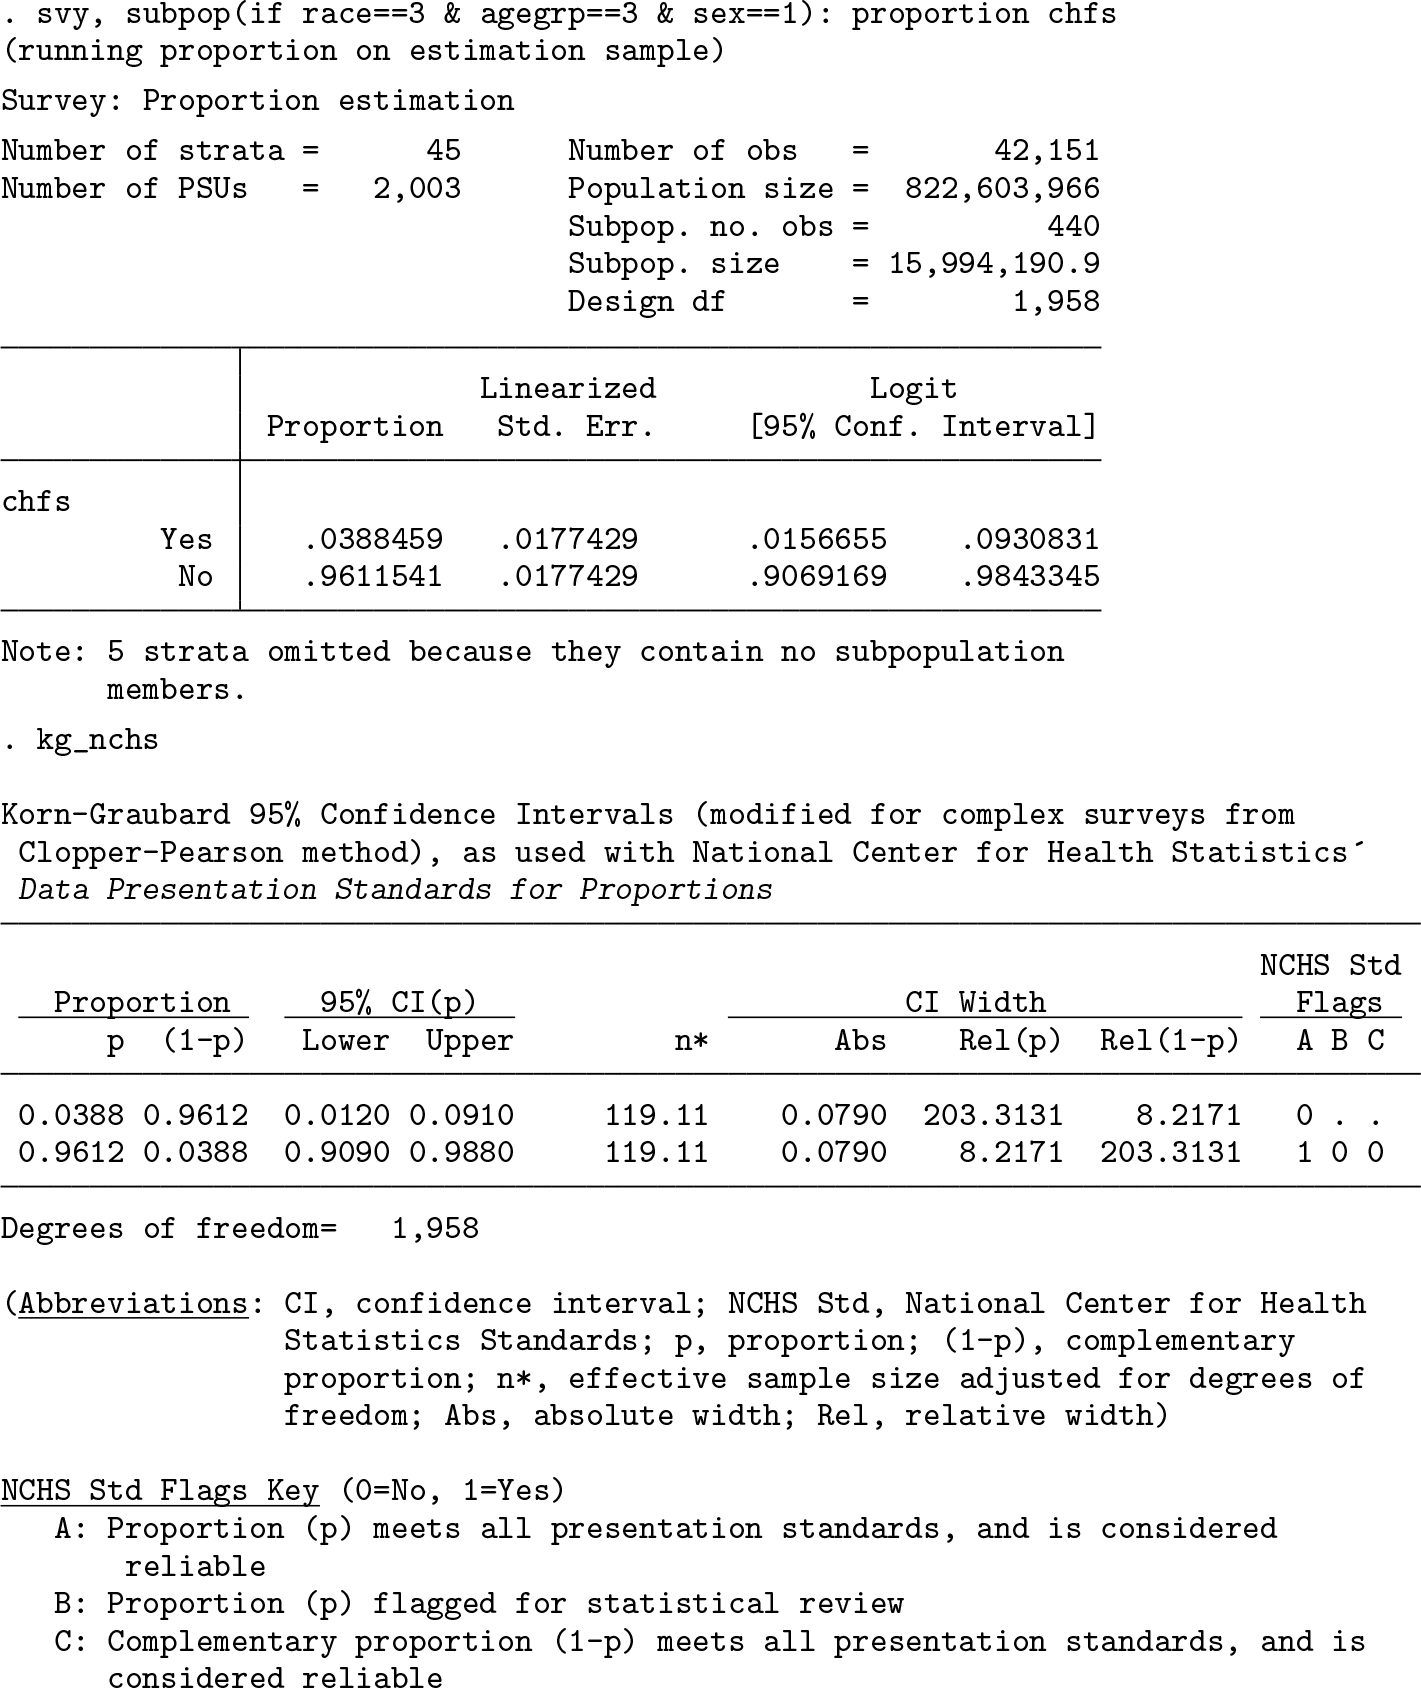
Here approximately 3.9% of visits were by Hispanic females aged ≥ 65 years with congestive heart failure. The Stata results from the
For the complement, 96.1% of visits were by Hispanic females aged ≥ 65 years without congestive heart failure. This proportion meets NCHS standards (that is, flag A = 1) and does not require statistical review (that is, flag B = 0). However, its complement is considered unreliable (that is, flag C = 0). Therefore, Stata users applying these standards should add a footnote stating such.
The example below examines office-based physician visits by Hispanic male patients aged 18–44 years. Among this subpopulation, not a single visit was by a patient who had congestive heart failure. Rather, 100.0% of visits by Hispanic males aged 18–44 were by persons who had never been diagnosed with congestive heart failure.

Recall that the limits specified above state that when a proportion is 0, the effective sample size is set to the nominal sample size (in this instance, 376). Thus, as the
The final example details why the
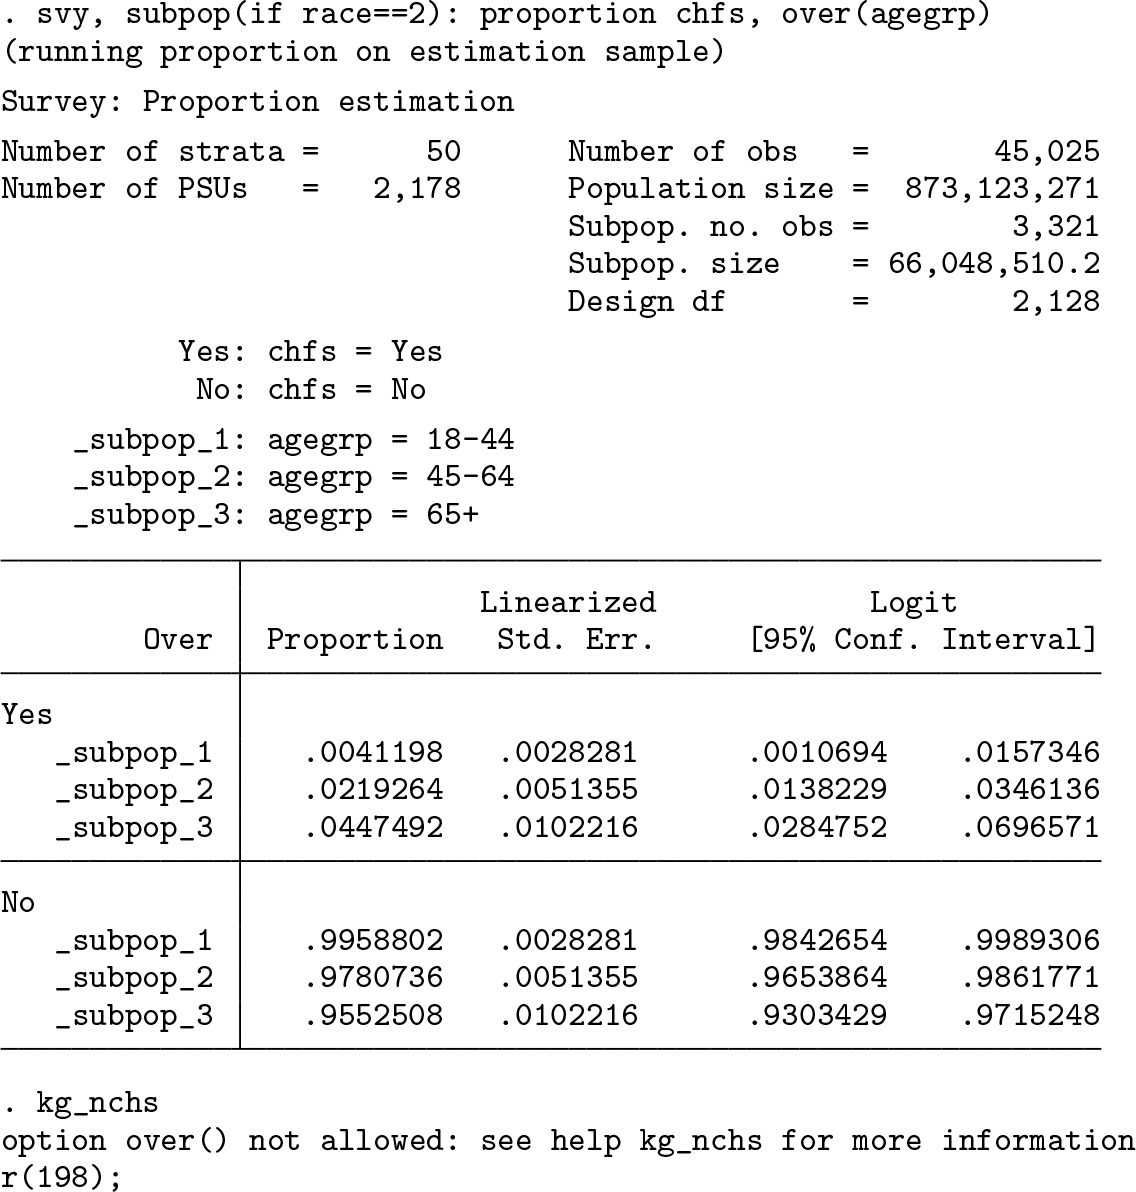
This restriction prevents the use of an inaccurate number of DF (in the Results window immediately above, 2,128) when adjusting the effective sample size for each subgroup. As an alternative, Stata users would generate separate
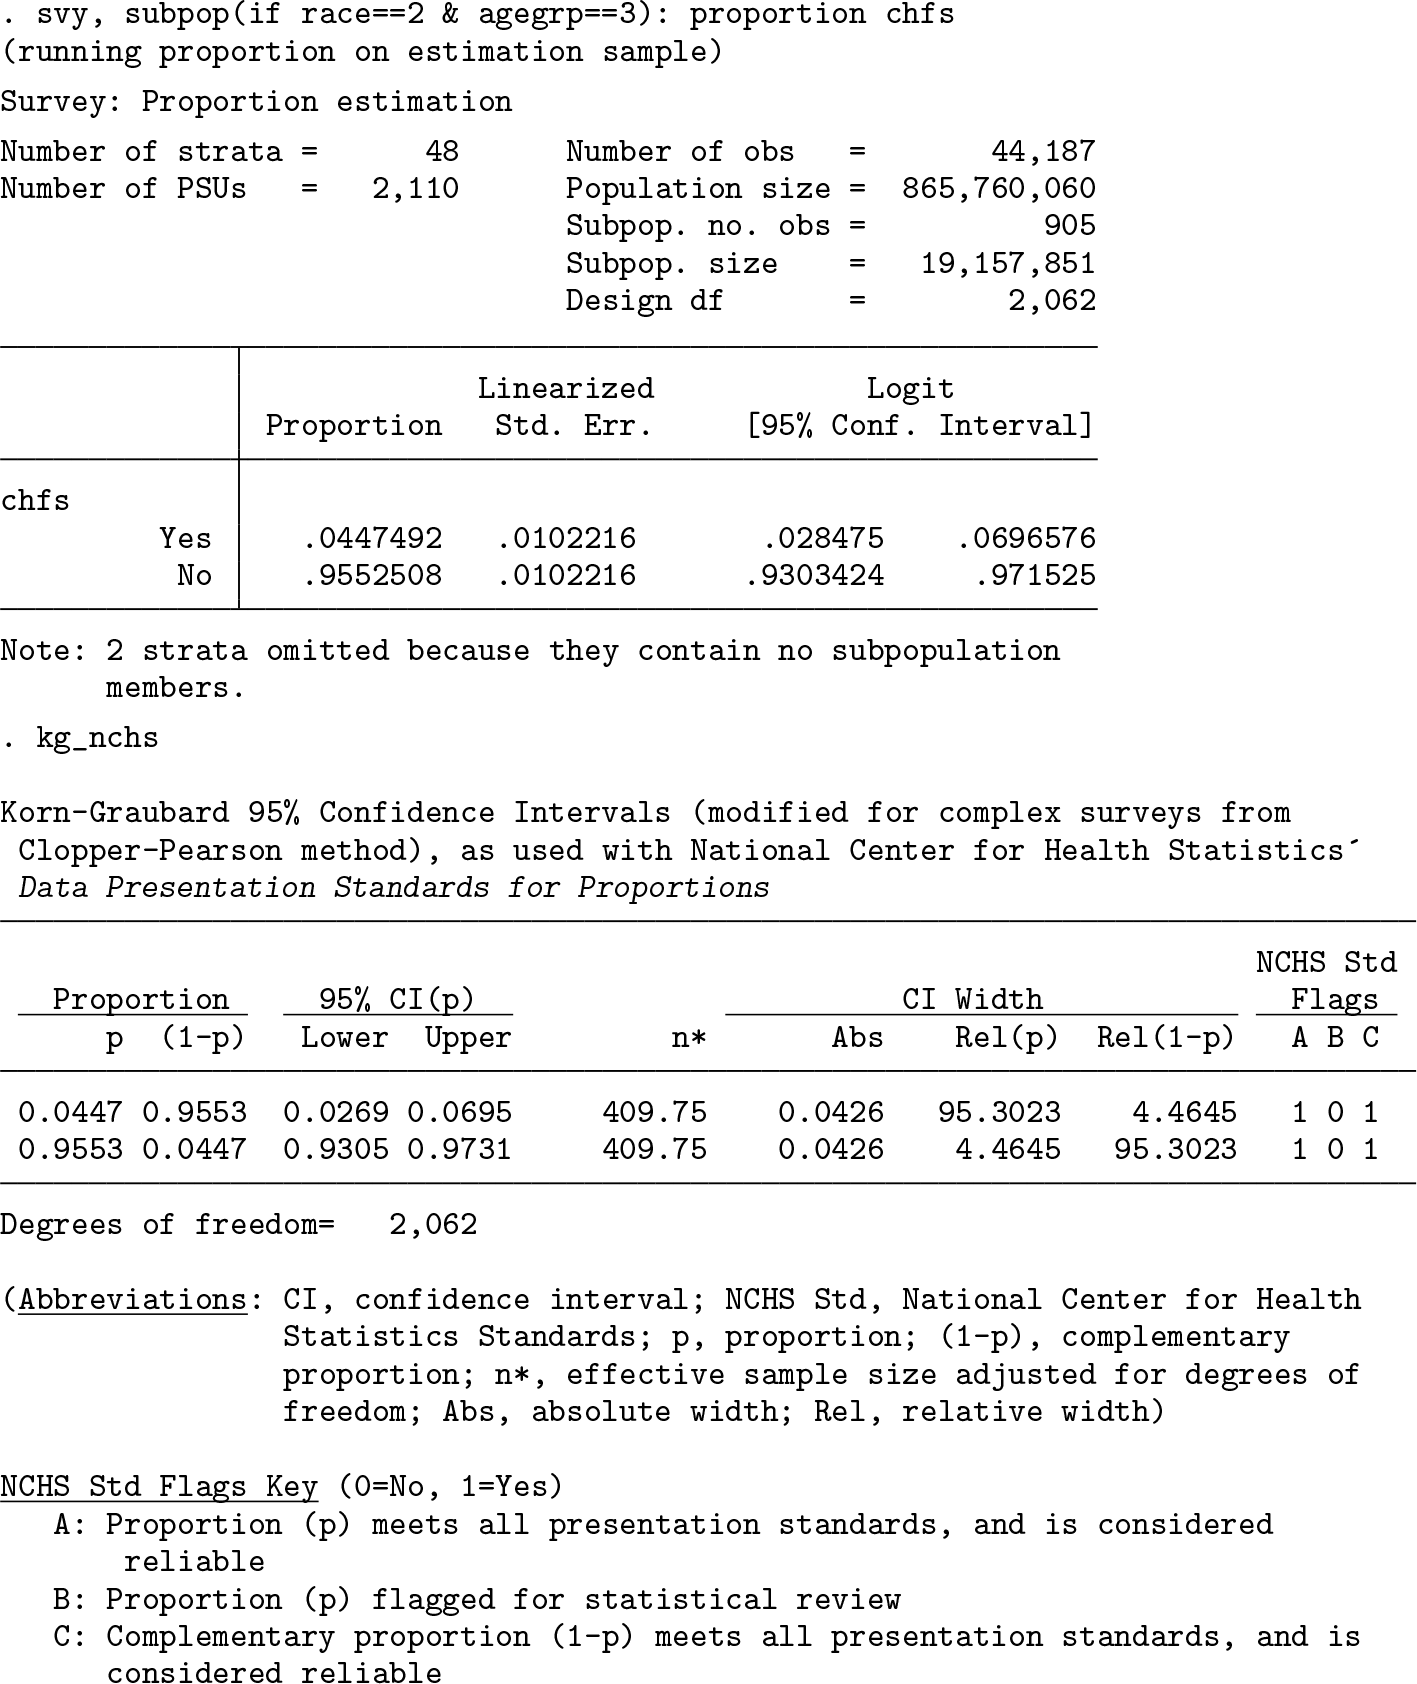
For visits by non-Hispanic black patients with congestive heart failure, the age group ≥ 65 years has a different number for DF (that is, 2,062) than the original example if
5 Conclusion
The
7 Programs and supplemental materials
Supplemental Material, st0564 - kg_nchs: A command for Korn–Graubard confidence intervals and National Center for Health Statistics’ Data Presentation Standards for Proportions
Supplemental Material, st0564 for kg_nchs: A command for Korn–Graubard confidence intervals and National Center for Health Statistics’ Data Presentation Standards for Proportions by Brian W. Ward in The Stata Journal
Footnotes
6 Acknowledgments
Note that all views expressed in this article are those of the author and do not necessarily reflect those of the Centers for Disease Control and Prevention or NCHS. I would like to thank the following individuals for “beta testing” the
7 Programs and supplemental materials
To install a snapshot of the corresponding software files as they existed at the time of publication of this article, type
References
Supplementary Material
Please find the following supplemental material available below.
For Open Access articles published under a Creative Commons License, all supplemental material carries the same license as the article it is associated with.
For non-Open Access articles published, all supplemental material carries a non-exclusive license, and permission requests for re-use of supplemental material or any part of supplemental material shall be sent directly to the copyright owner as specified in the copyright notice associated with the article.