
Abstract
Technical analysis is an important part of financial industry, research, and teaching. The methodology has two parts: i) calculation of the individual tools and ii) visual representations. In this article, I provide a community-contributed command,
Keywords
1 Introduction
Technical analysis is one of the important financial forecasting methods. Popular tools for such analysis are based on moving averages, mean reversion, standard deviation, and volume. Common tools include moving-average convergence divergence (MACD), relative strength index (RSI), and Bollinger bands. In this article, I provide a communitycontributed command,
Financial literature includes many studies to test the validity and forecasting ability of technical analysis (for example, Scott, Carr, and Cremonie [2016]; Blume, Easley, and O’Hara [1994]; and Neftci [1991]). Many studies cover specific tools and their forecasting powers. For instance, Bollinger bands are evaluated by Leung and Chong (2003) and Lento, Gradojevic, and Wright (2007), while MACD and RSI are evaluated by Chong and Ng (2008).
Researchers used to believe that returns were not predictable and that they followed a random walk (for example, Fama [1965]). However, many researchers now believe that returns may be predictable (for example, Campbell and Yogo [2006]). Accordingly, many researchers argue that common technical analysis may help to predict returns and identify price patterns (for example, Gehrig and Menkhoff [2006] and Leigh, Purvis, and Ragusa [2002]). This change in a fundamental cornerstone of financial theory leads many to readdress the importance of forecasting and technical analysis.
Investor behavior is one of the reasons that returns can be predicted (for instance, herd behavior by Bikhchandani and Sharma [2000]). Thus, instead of trying to find new analysis tools, researchers focus on self-fulfilling prophecies (that is, Azariadis [1981]). Technical analysis tools that are common and popular are likely to have sufficient people to believe in their predictions. These believers will fulfill the prophecies. For instance, investors who believe in Bollinger bands would become bearish every time the price breaks above the upper band. Similarly, people who believe in Fibonacci retracement will become more cautious around 23.6%, 38.2%, and 61.8% support and resistance levels. These levels will become like magnets, oscillating the price for multiple days if a sufficient number of traders believe in this technical analysis tool.
In this article, I focus primarily on the visual representations of the most common and popular financial technical analysis tools. This content is applicable for industry professionals, researchers, and students. Stata has community-contributed commands to download financial prices (that is,
2 Technical analysis charts: candlechart
2.1 Title
2.2 Syntax
namelist is the symbol of the security to be used for the technical analysis charts. We suggest downloading the data with the community-contributed
2.3 Description
Most online technical charting tools cannot accommodate conditional statements, data manipulation, elimination of outliers, redefinitions, and amendments.
A candle within a candle chart has two parts: the line and the body. The line represents the daily high at the top and daily low at the bottom. The body represents the daily open and daily close. If the daily close is higher than the daily open, then the top of the body is the daily close, the bottom of the body is the daily open, and the body is usually filled with green. If the daily close is lower than the daily open, then the top of the body is the daily open, the bottom of the body is the daily close, and the body is usually filled with red.
2.4 Options
2.5 Installation and updates
To install the software associated with this article as it existed when the article was published, type
Updated versions of the software may be available from our servers. To install from there, type
2.6 Usage
▷ Example
Candle chart for AAPL:
Figure 1 shows the candle chart for AAPL. For each candle, there is a body and a line. The top of the line is the daily high. The bottom of the line is the daily low. For a trading day when AAPL closed above the open, i) the body will be gray and ii) the top of the body will be the close of the day, while the bottom of the body will be the open of the day. For a trading day when AAPL closed below the open, i) the body will be black and ii) the top of the body will be the open of the day, while the bottom of the body will be the close of the day.

Candle chart for AAPL
▷ Example
Price and volume charts for AAPL:
Figure 2 shows the price candle chart along with the daily volume. Many technical analysis tools incorporate volume into their calculations.

Price and volume charts for AAPL
▷ Example
Technical analysis charts for AAPL:
Figure 3 shows all four technical analysis tools. For the Bollinger bands, it is common to conclude that the price that is above or below the Bollinger bands will revert to mean. Because the current price is within the Bollinger bands, this tool does not provide us with a signal. There is no extraordinary volume or lack thereof. Thus, volume also does not provide any signal for AAPL. For the MACD, the signal lines are reverting back to the mean, and both MACD lines are too close together. MACD also does not provide us with any meaningful signal. Finally, for the RSI, it is within the 30–70 band and does not provide us with a signal.
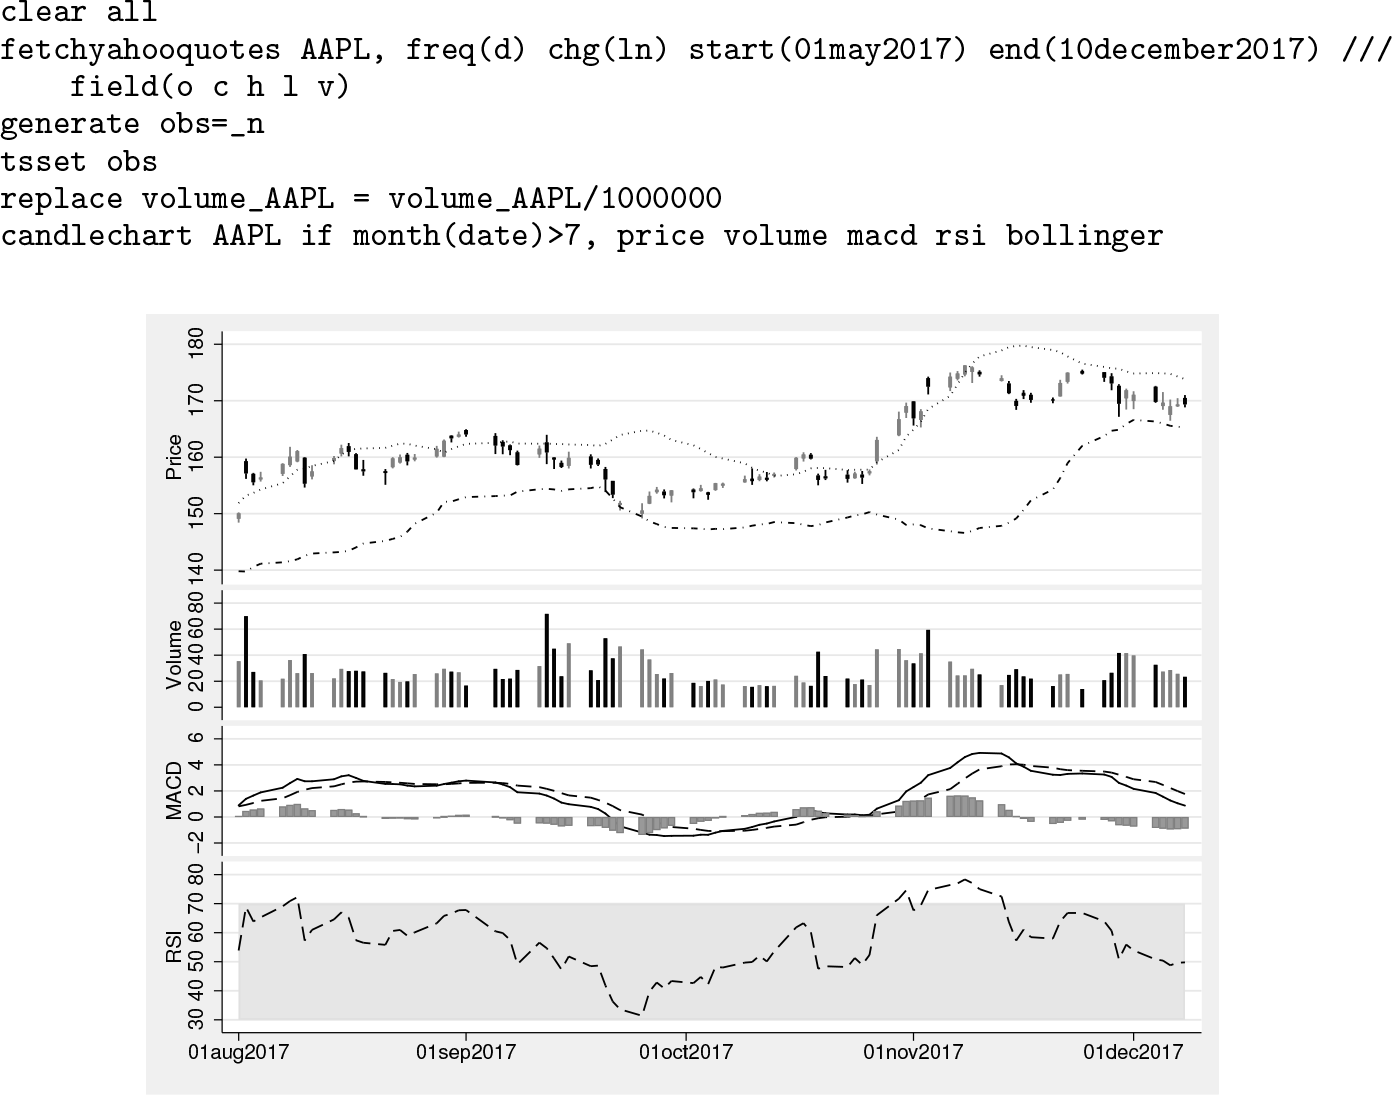
All four technical analysis charts for AAPL
▷ Example
Usage of the chart options:
Figure 4 shows all four technical analysis tools with chart options. Notice the chart title and the vertical x-axis labels. By using the

All four technical analysis charts for AAPL with chart options
3 Conclusion
Technical analysis is a significant part of financial forecasting. It is popular and gaining in momentum as technology advances. Fundamental changes in our understanding of return predictability also raises the popularity of technical analysis. Visual representation of technical analysis tools are available through most industry software. Stata is common among finance professionals, academics, and students. I provided a community-contributed command,
Supplemental Material
Supplemental Material, gr0076 - Candle charts for financial technical analysis
Supplemental Material, gr0076 for Candle charts for financial technical analysis by Mehmet F. Dicle in The Stata Journal
References
Supplementary Material
Please find the following supplemental material available below.
For Open Access articles published under a Creative Commons License, all supplemental material carries the same license as the article it is associated with.
For non-Open Access articles published, all supplemental material carries a non-exclusive license, and permission requests for re-use of supplemental material or any part of supplemental material shall be sent directly to the copyright owner as specified in the copyright notice associated with the article.