
Abstract
The OECD Programme for the International Assessment of Adult Competencies (PIAAC) is currently the only international survey of adult skills. It provides rich data on skills, work and life situations, earnings, and attitudes. To ensure representativeness and high reliability, the study is based on a complex survey design and advanced statistical methods. To obtain correct results from publicly available microdata, one must use special methods that are often too advanced for less experienced researchers. In this article, we present
Keywords
1 Introduction
The OECD Programme for the International Assessment of Adult Competencies (PIAAC) is a household survey that aims at measuring literacy, numeracy, and problem-solving skills. The assessment was launched in 2008, with the first round finalized in 2013 covering 24 countries and economies. Round 2 was finalized in 2016, bringing in 9 new countries for the dataset. Round 3 is scheduled to be finished in 2019. The study uses a complex survey design and advanced statistical methods to improve the representativeness and reliability of the results. As the only up-to-date source of internationally comparable information about adult skills, PIAAC is highly popular with researchers across the world.
However, to analyze microdata from the PIAAC study, one must use relatively complex methods. In Stata, one cannot obtain correct results from the PIAAC data without some programming, which is a difficult barrier to overcome for some researchers. In many cases, researchers use wrong approaches and later have difficulties when publishing their results. To facilitate analysis with PIAAC data, we developed the package
The three commands are straightforward to use even for Stata beginners and guarantee that users will obtain correct point estimates and SEs. The results obtained with these three commands are virtually identical to those that researchers can obtain using the IDB analyzer provided by the PIAAC consortium for SPSS users. The command
2 Statistical background
2.1 Complex sampling
Each country participating in PIAAC chose its own sampling design. The only requirement was to produce “a probability-based sample, representative of the target population of the country” (Mohadjer, Krenzke, and Van de Kerckhove 2013). One-, two-, three-, and four-stage stratified designs were used (for details, see table 1). Each country was free to define sampling units and stratification design. Poland, for example, used a two-stage sampling design with towns or villages as primary sampling units and individuals as secondary sampling units. It also used a simple rural-versus-urban stratification. Italy used a three-stage design with municipalities as primary sampling units, households as secondary sampling units, and persons as final sampling units, while stratification was based on geographic regions of equal size (Mohadjer, Krenzke, and Van de Kerckhove 2013).
Sample designs for PIAAC country (rounds 1 and 2)
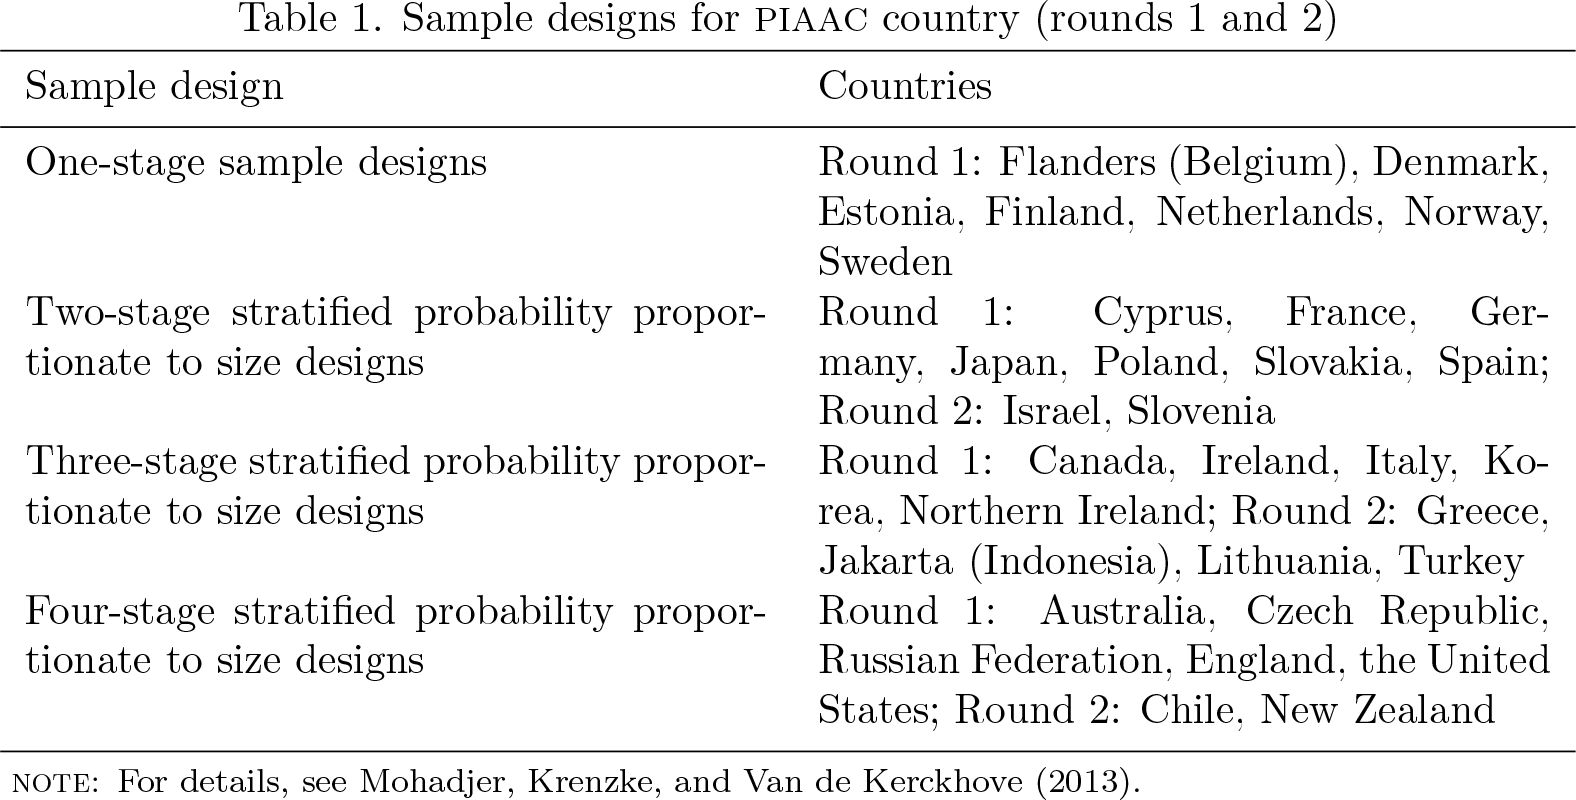
NOTE: For details, see Mohadjer, Krenzke, and Van de Kerckhove (2013).
Sampling weights were computed to reflect different selection probabilities on the basis of the varying sampling designs to adjust for nonresponse and for “any known differences between the selected sample and the total target population” (Mohadjer, Krenzke, and Van de Kerckhove 2013).
The complex sampling design used in PIAAC has two major consequences. First, all point estimates must be computed using sampling weights. Second, one must use replication methods to obtain correct SEs. Although there are analytical methods that are used for SE computations in household surveys similar to PIAAC, replication methods have important advantages. They provide unbiased and efficient estimates and are relatively easy to implement for many applications (Efron 1982; Levy and Lemeshow 1999). For PIAAC, replication methods have the important benefit of enabling the unification of estimation procedures for samples from dozens of countries participating in the survey.
In short, replication methods involve selecting a set of replicated subsamples instead of a single sample. Subsamples are drawn using an identical or similar sample selection mechanism, and desirable estimates are computed. Because each estimate in each subsample follows an identical sampling process, it is assumed that sampling variance can be estimated from the variability of subsample estimates (for details, see Efron [1982]).
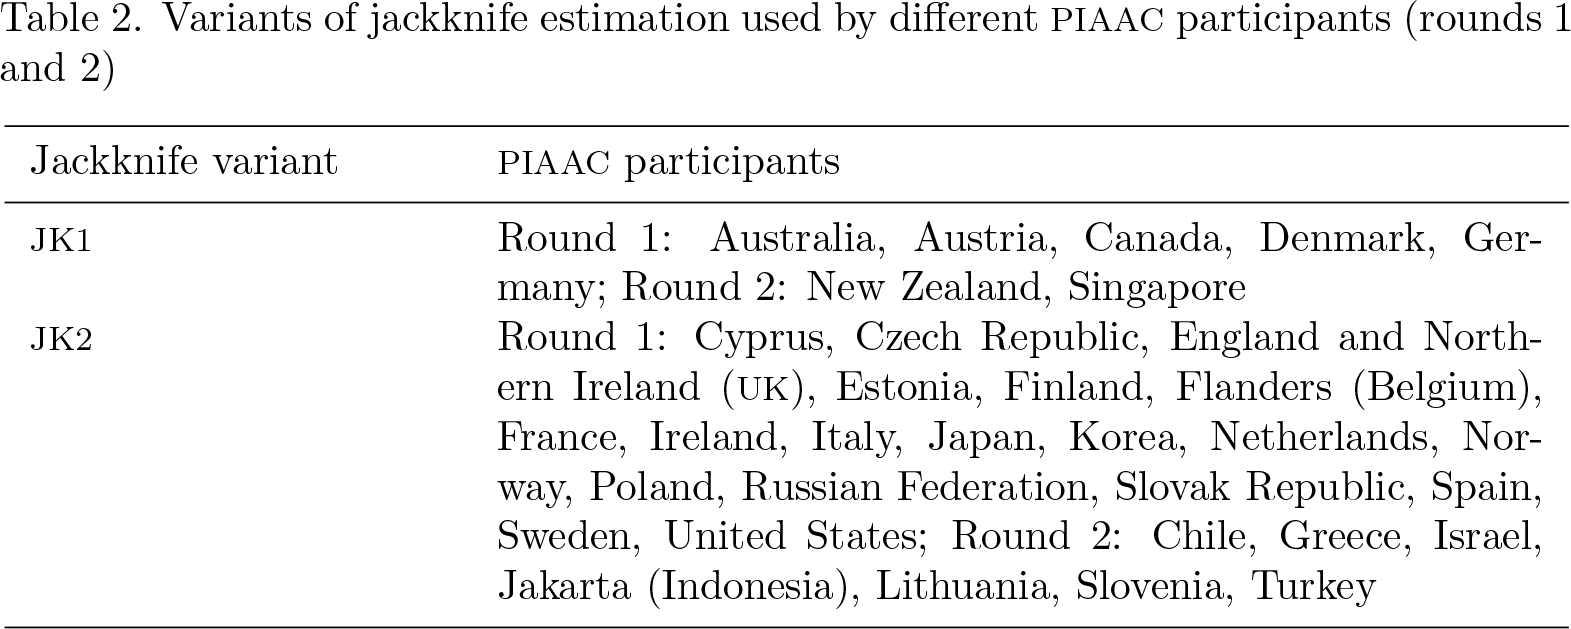
For PIAAC, two variants of the so-called jackknife procedure were proposed: delete-a-group jackknife (JK1) and the paired jackknife (JK2). The first variant is used in sample designs where sampling units are not stratified, while the second variant is used in stratified samples. In the JK1, in each replication one random group is sampled using the same sample design as in the whole sample. In JK2, in each replication one group is removed from a stratum, and weights are adjusted so the remaining groups retain the stratum’s proportion in the total sample (Lee and Forthofer 2005). Table 2 provides information about the jackknife variants applied to each participant of the PIAAC survey.
Variants of jackknife estimation used by different PIAAC participants (rounds 1 and 2)
International datasets provided by the PIAAC consortium contain both probability and replication weights. Estimation of SEs that does not involve measures of cognitive proficiency (for cognitive components, see next section) is based on computations using a standard replication approach. Computations are based on the variability of estimates in subsequent replicates obtained using replication weights,
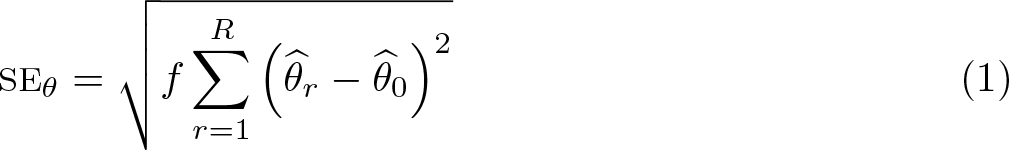
where
R is the number of replicates;
constant f depends on a jackknife variant used in each country for the delete-a-group variant f = (R − 1)/R and for the JK2 f = 1.
In
2.2 Calculations using plausible values (measures of cognitive proficiency)
The PIAAC study uses advanced measurement and estimation methods to provide countries with reliable measures of adult proficiency. In PIAAC, cognitive tests use matrix sampling design with different sets of items, multistage adaptive testing, and different assessment modes. Similar designs are used in all modern surveys measuring the proficiency of students or adults, and their key feature is that respondents answer different sets of items. The main benefit of this approach is that it covers more cognitive material (more test questions). The main drawback is that it makes the analysis of survey outcomes more complex.
Similarly to other surveys of cognitive proficiency, PIAAC uses complex measurement design with item response theory models combined with plausible values methods to obtain unbiased estimates of respondents’ proficiency (Yamamoto, Khorramdel, and von Davier 2013).
In short, plausible values represent random draws from an empirically derived distribution of latent variables that is conditional on the observed values of the scale (measurement model) and the covariates (latent regression),

where
Usually, plausible values are drawn from posterior distribution using the Markov Chain Monte Carlo methods (see a detailed description in Fox and Glas [2001, 2003]) in the Bayesian estimation framework. The procedure generates a set of plausible values, and each respondent receives several indicators (plausible values) of proficiency. Each plausible value is used once in each analysis. For instance, for 10 generated plausible values, 10 models are fit; in each model, one plausible value is used, and the final estimates are obtained using Rubin’s rule (Little and Rubin 2002)—results from all analyses are simply averaged.
Because plausible values are random draws, the random component provides a way to model the uncertainty associated with the estimate that is related to the measurement error (Wu 2005). Moreover, plausible values have approximately the same conditional distribution as the latent trait being measured. The latent regression part (that is,
2.3 Combining complex sampling with plausible values
Analysis of PIAAC cognitive outcomes is not straightforward because it requires additional computations to reflect complex sampling design and measurement of cognitive proficiency with plausible values. Estimates variance must reflect both the uncertainty related to sampling and the uncertainty related to the measurement of cognitive proficiency. SE for a survey statistic involving plausible values can be expressed as

Implementation of (1) for data with plausible values is

where
P is the number of plausible values, p = (1,…, P);
PIAAC datasets contain 10 plausible values and 80 replicate weights. Thus, implementing the above formula requires 810 computations for each statistic of interest. The procedure starts with 10 calculations for each plausible value with the final weight. Then, the procedure calculates statistics with 80 replicate weights and repeats this for each plausible value. These calculations might be time consuming, especially with complex statistical models. Thus, researchers often use simpler methods to obtain initial results and run full models for the final calculations. A shortcut approach to running the initial analysis could use only one of the plausible values and final weights to obtain point estimates with analytically calculated SEs. However, the final results must be obtained using the formula described above and in some cases might be different from the initial results because of a large sampling or measurement error.
3 Analyzing PIAAC data with Stata survey commands
Analysis without plausible values is possible using the Stata built-in commands for survey data. Below are examples of how to use
For estimation with jackknife replicate weights, Stata by default sets the constant f = (R − 1)/R [see (1)] that is appropriate for the JK1 method. Thus, for this method, a standard setup can be used:
For the JK2 method, this constant can be specified using the option
After setting up data with
However, in most cases users will want to analyze adult proficiency with PIAAC data and thus use plausible values in their analyses. While users can analyze plausible values in Stata using the built-in commands, it is usually too demanding for most users. One option is to manipulate the datasets to use them with Stata’s multiple imputation commands. However, the current multiple imputation estimation command in Stata does not allow using jackknife replication weights, so users cannot obtain unbiased SEs this way. Another option is for users to write their own code that repeats calculations over plausible values and replicate weights using the formulas specified above. The
4 Descriptive statistics with PIAAC data: piaacdes
4.1 Syntax

4.2 Description
4.3 Options
In addition, users can specify several options that can be used to replace original information available in PIAAC datasets and facilitate analysis with plausible values or different regression models.
4.4 Stored results
4.5 Examples
Example 1. Computation of statistics without involving plausible values
Suppose you want to estimate results for just three countries: Germany, Poland, and the United States. You can recode the
Then, you can use
Results are also returned in matrices that can be further processed directly in Stata. Type
which will display the coefficients matrix in Stata.

You can use this matrix to further process
Example 2. Computation of statistics with plausible values
You can compute the means and specific percentiles for the PIAAC numeracy proficiency scale (
Example 3. Computation of statistics by categories
You can compute the means and standard deviations for the PIAAC index of readiness to learn (readiness). Results are reported separately for each country and by gender. Numbers are reported with two decimal points.
Results are saved in the HTML file and in separate return matrices for each
Example 4. Computation of statistics over proficiency levels
You can compute the means for the PIAAC index of readiness to learn (
Results are saved in the HTML file and in the separate return matrices corresponding to different proficiency levels defined over plausible values in problem solving. For example, to see the matrix with the point estimates for the fourth
5 Regression analysis with PIAAC data: piaacreg
5.1 Syntax
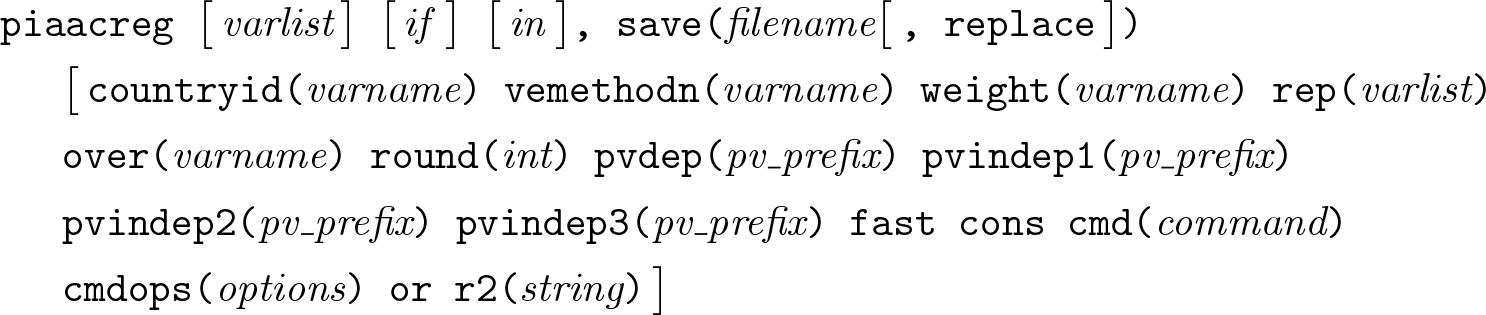
5.2 Description
5.3 Options
Users can also replace original variables identifying countries, variance computation method, and weights using the options
5.4 Stored results
5.5 Examples
Example 1. Regression without plausible values
You can compute regression without plausible values by typing
Results are saved in the working directory in the file
To see the SEs, type
To see the R-squared matrix, type
Example 2. Regression with plausible values as a dependent variable
Plausible values in numeracy are declared as the dependent variable by using the
Results are saved in the HTML file and in the return matrices that can be accessed as in example 1.
Example 3. Regression with plausible values as an independent variable
Plausible values in numeracy are declared as one of the independent variables by using the
One can include the second or the third set of plausible values as independent variables by using the
Example 4. Logistic regression with plausible values as an independent variable
Other regression models can be run by using the
6 Tables with PIAAC data: piaactab
6.1 Syntax

6.2 Description
The
6.3 Options
Users can also replace original variables identifying countries, the variance computation method, and weights using the options
6.4 Stored results
Results are saved as HTML files and returned in matrices that can be further processed directly in Stata.
6.5 Examples
Example 1. Calculation of the table without involving plausible values
You can compute the percentage of males and females by country with the appropriate SEs by typing
Results are saved in the working directory in a file named
To see the SEs, type
Example 2. Calculation of the table involving plausible values
You can compute the percentage of respondents at each proficiency level in literacy with the appropriate SEs. Calculations are based on the OECD’s thresholds using plausible values
Results are saved in the HTML file and in the return matrices. See example 1.
Example 3. Calculations by subgroups using the over() option
You can compute calculations by subgroups using the
Results are saved in the HTML file. Results are also saved in the separate return matrices for each
7 Other community-contributed commands that work with PIAAC data
Two other community-contributed commands allow for the analysis of PIAAC data. The
In addition,
These and additional examples are provided in the help files for these commands.
Supplemental Material
Supplemental Material, st0551 - piaactools: A program for data analysis with PIAAC data
Supplemental Material, st0551 for piaactools: A program for data analysis with PIAAC data by Maciej Jakubowski, and Artur Pokropek in The Stata Journal
References
Supplementary Material
Please find the following supplemental material available below.
For Open Access articles published under a Creative Commons License, all supplemental material carries the same license as the article it is associated with.
For non-Open Access articles published, all supplemental material carries a non-exclusive license, and permission requests for re-use of supplemental material or any part of supplemental material shall be sent directly to the copyright owner as specified in the copyright notice associated with the article.