
Abstract
Zhe Zhang, Shelley M. Kimelberg, and Robert M. Adelman on underexamined urban change.
New York. London. Chicago. San Francisco. Toronto. Pick up any undergraduate urban sociology textbook and you will probably find an account of gentrification in one of these cities. By now the story is recognizable to most: affluent individuals, plus large stocks of capital, move into lower-income, previously disinvested communities, fundamentally remaking the physical, economic, and social landscape in the process. It’s no mystery why sociologists tend to focus disproportionately on gentrification in large, global cities in their analyses of this urban dynamic. The dramatic changes gentrification brings to such well-known metropolises—gleaming new luxury condos, an abundance of high-end retailers and restaurants, drastic demographic shifts often involving displacement and marginalization along both class and racial lines—are stark, predictable, and seemingly unstoppable. But as Japonica Brown-Saracino notes in her 2017 Annual Review of Sociology article, this is not always the reality of gentrifi-cation. Indeed, when scholars consider smaller, regional cities, it becomes clear that gentrification can manifest in different and sometimes unexpected ways.
gentrification in the rustbelt
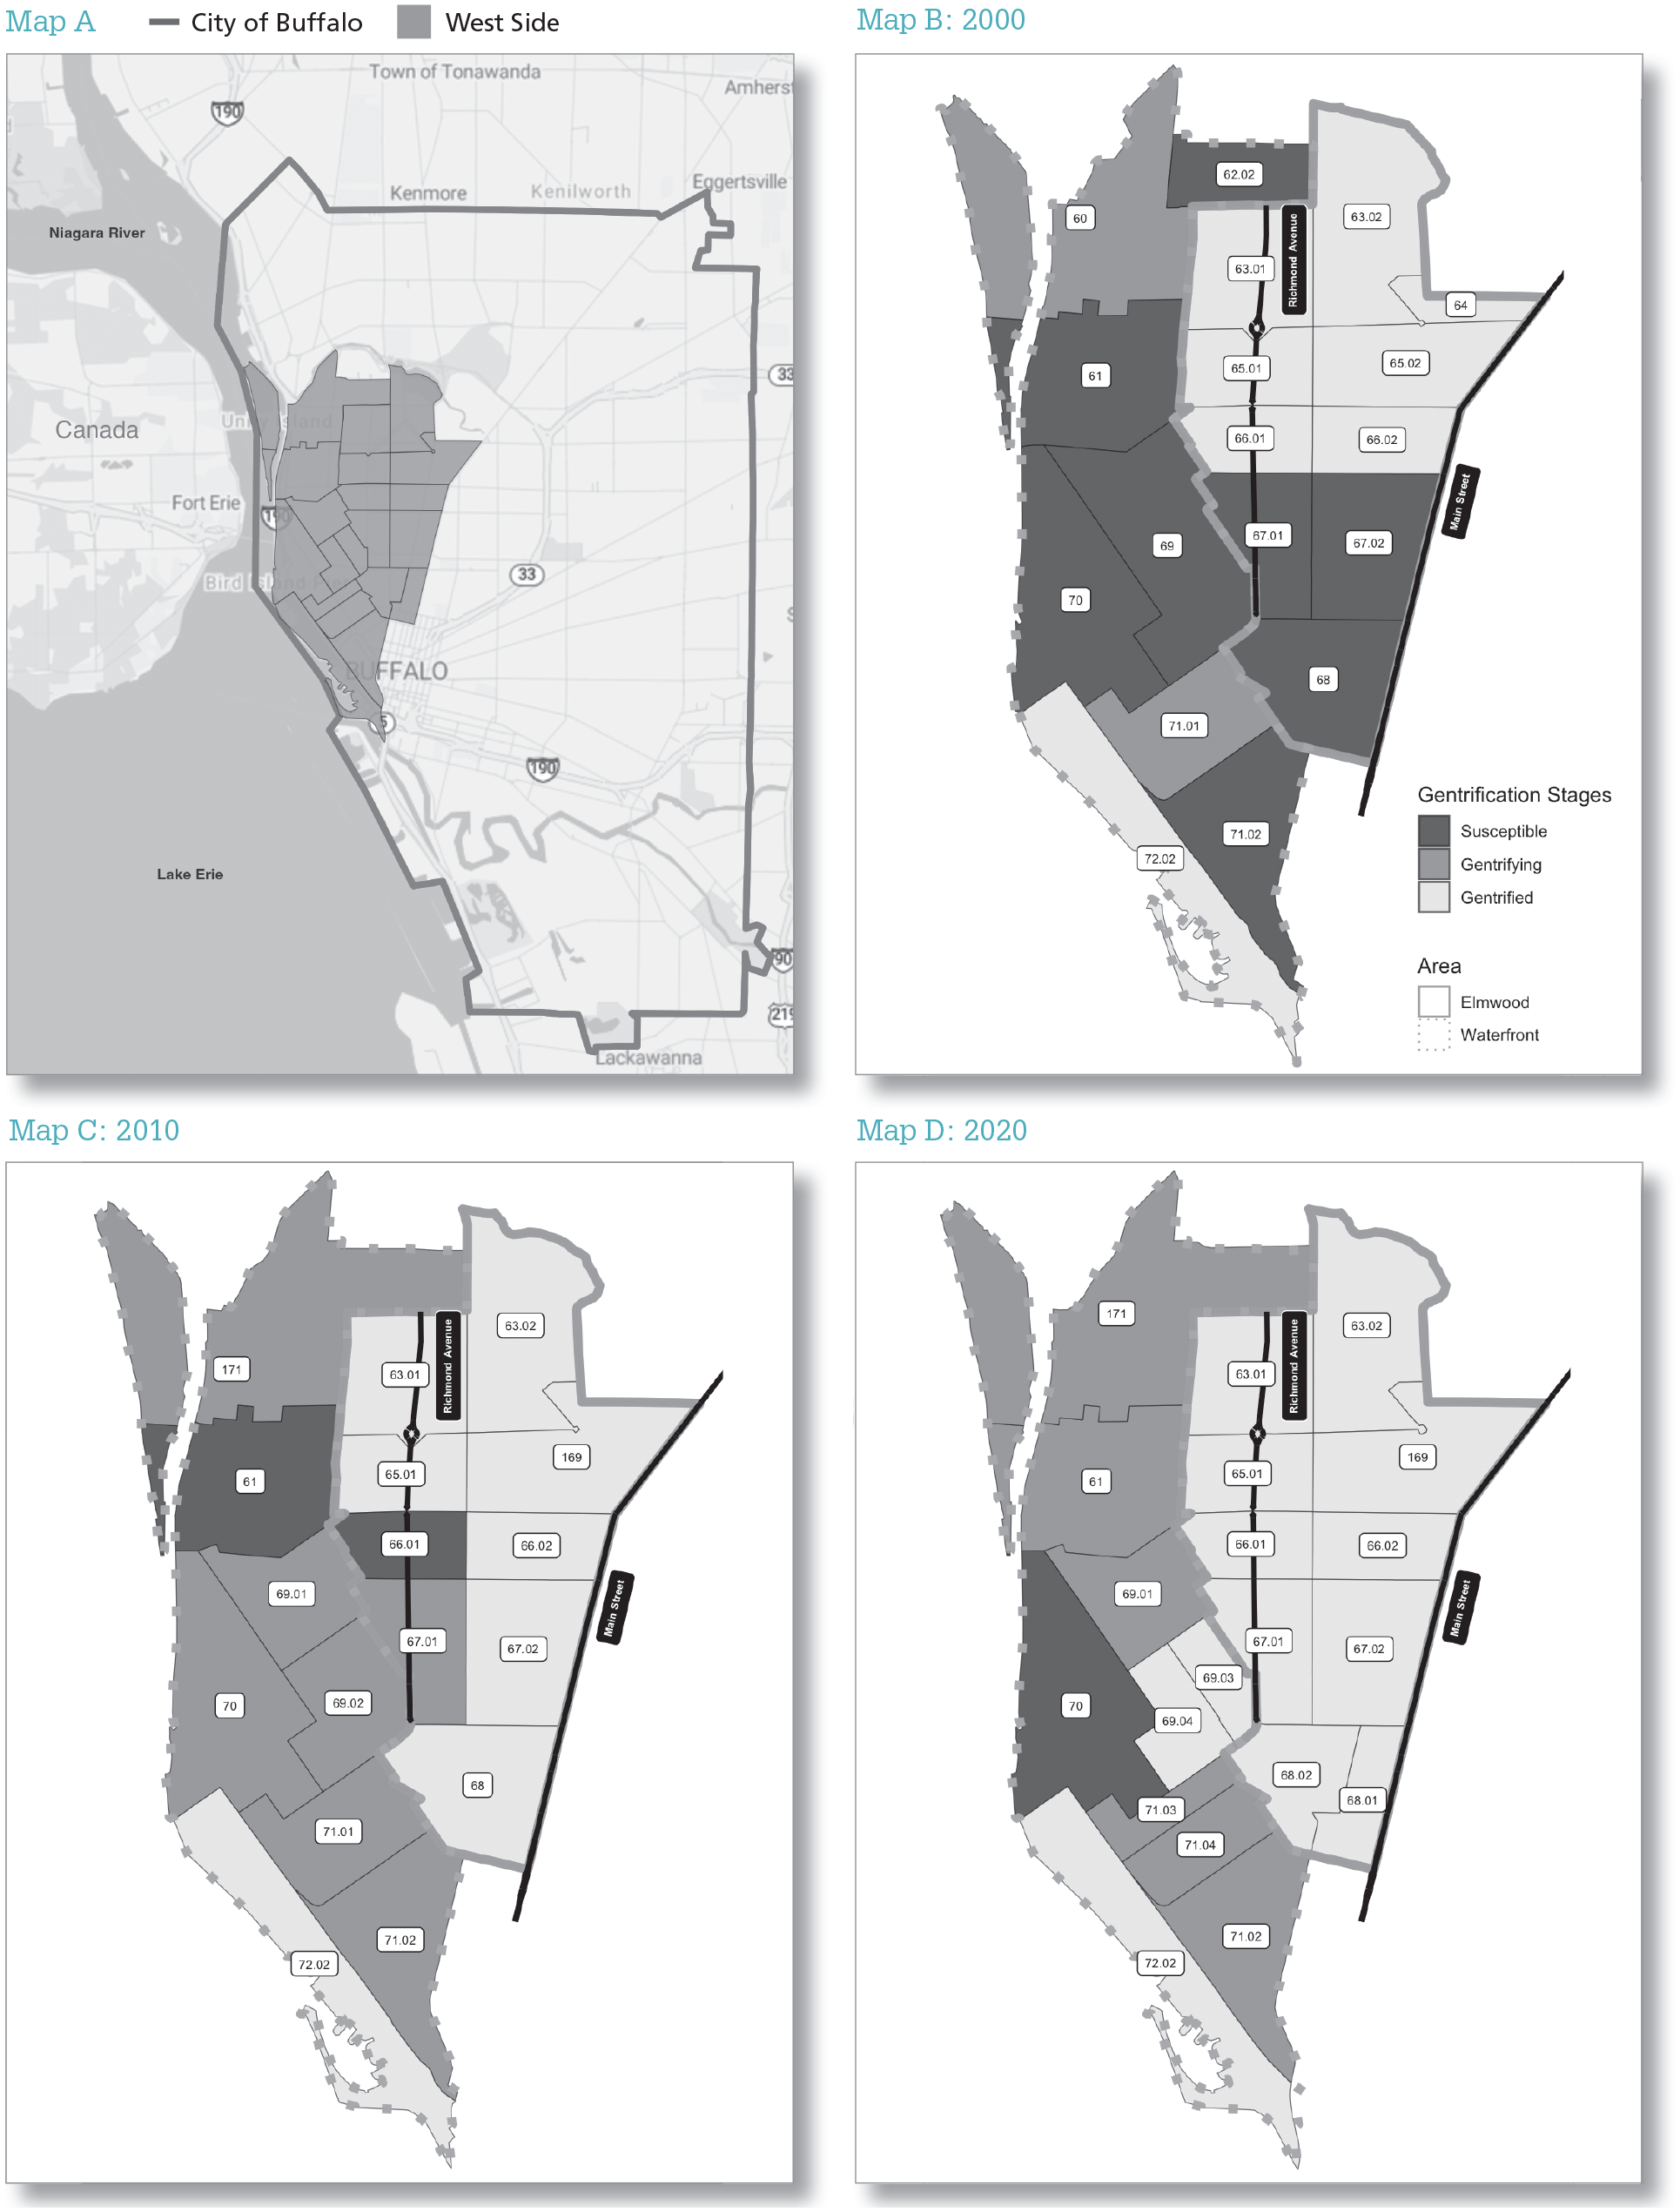
Take Buffalo, New York (see Map A on p. 58). A classic Rustbelt city, Buffalo posted its first population increase in 2020 after more than 60 years of consistent decline, a milestone celebrated by the local Buffalo News. Despite a poverty rate that still ranks among the highest in the United States, Buffalo has recently experienced pockets of gentrification, most notably in Elmwood and the Waterfront, adjacent neighborhoods known collectively as the West Side (for more, see Clint McManus’s 2016 Partnership for the Public Good report, "West Side Study").
The panels on p. 59 show that these two neighborhoods share a similar demographic and socioeconomic history. According to data from the U.S. Census Bureau, both were more than 90% White in 1970, ethnically dominated by Italian and Irish immigrants and their descendants. Starting around the year 2000, however, the two neighborhoods diverged. The Waterfront became home to relatively large populations of people of color, including African Americans, Puerto Ricans, immigrants, and refugees, many of whom have launched thriving small businesses (a trend explored in sociologist Robert M. Adelman and colleagues’ 2019 study, "Buffalo’s West Side Story"). Elmwood, too, became more racially diverse over time, but it remains predominantly White. Furthermore, Elmwood has received more public and private capital investment, as geographer and data scientist Christopher Willer highlights in his 2022 Urban Geography account of the neighborhood’s targeted rebranding initiative.
Maps B, C, and D illustrate these trends geographically. Using census tract-level data from 2000, 2010, and 2020, we classify each tract in Elmwood and the Waterfront as "susceptible," "gen-trifying," or "gentrified" at each of the three time periods. To do so, we measure each tract’s relative position within the city, reflecting the extent to which that tract underwent change at a rate that was higher than, lower than, or similar to that for Buffalo as a whole. We examine change along three key dimensions of gentrification: (a) the presence of a vulnerable population (which includes indicators such as a higher proportion of renters, a higher proportion of low-income households, a larger population of non-White groups, and a lower proportion of college-educated persons); (b) sociodemo-graphic shifts (which captures increases in, for example, rates of homeownership, presence of non-Hispanic Whites, presence of those working in management or professional occupations, and median household income); and (c) housing market variation (with greater changes in median home value and median gross rent reflecting gentrification pressures).
Using these data, we determine the stage for each tract as follows: tracts classified as "susceptible" (shown in dark gray in maps B, C, and D) have a vulnerable population but demographic changes and variations in housing market conditions that do not exceed those for the city as a whole; tracts classified as "gentrifying" (shown in medium gray in the maps) have a vulnerable population plus evidence of changes in demographic or/and housing market conditions that exceed those for the city; and tracts that no longer meet the criteria for a vulnerable population but have both notable demographic shifts and greater change in housing market indicators than the city itself are classified as "gentrified" (shown in light gray).
What can we learn from these maps? Our analyses reveal that gentrification in Elmwood—already underway in 2000—progressed consistently across the two decades, such that all of its tracts were fully gentrified by 2020. Interestingly, however, even in this otherwise straightforward case, one tract (66.01) moved from gentrified to susceptible and back again over the course of two decades, underscoring the instability and multidirectionality of neighborhood change. Gentrification in the Waterfront, in contrast, has advanced more slowly, revealing a variegated patchwork of change. Most tracts deemed susceptible to gentrification in 2000 were not yet fully gentrified by 2020, and one tract (70) deemed gentrifying in 2010 had fallen below that threshold by 2020 (returning to the susceptible classification).
Gentrification in Elmwood and the Waterfront (Buffalo, NY).
The maps show changes in gentrification stages at the census tract level across the West Side of Buffalo, New York, between 2000 and 2020. Elmwood is outlined by bold gray lines, and the Waterfront is delineated by dotted gray lines. Main Street and Richmond Avenue, two prominent streets that traditionally define the boundaries of Elmwood and the Waterfront, respectively, are indicated by bold black lines.
Note: Map data are publicly accessible through decennial census data for 2000 and American Community Survey (ACS) 5-year data for 2006-2010 and for 2016-2020. Please contact the authors for further information on the methods and data used to measure and map gentrification and the categorization of these two areas across time.
Demographic Changes 1970-2020
Data demonstrate demographic changes at the census tract level and are publicly accessible through decennial census data from 1970 to 2000 and American Community Survey (ACS) 5-year data for 2006-2010 and for 2016-2020. Median household income data were not available in the 1970 Census.
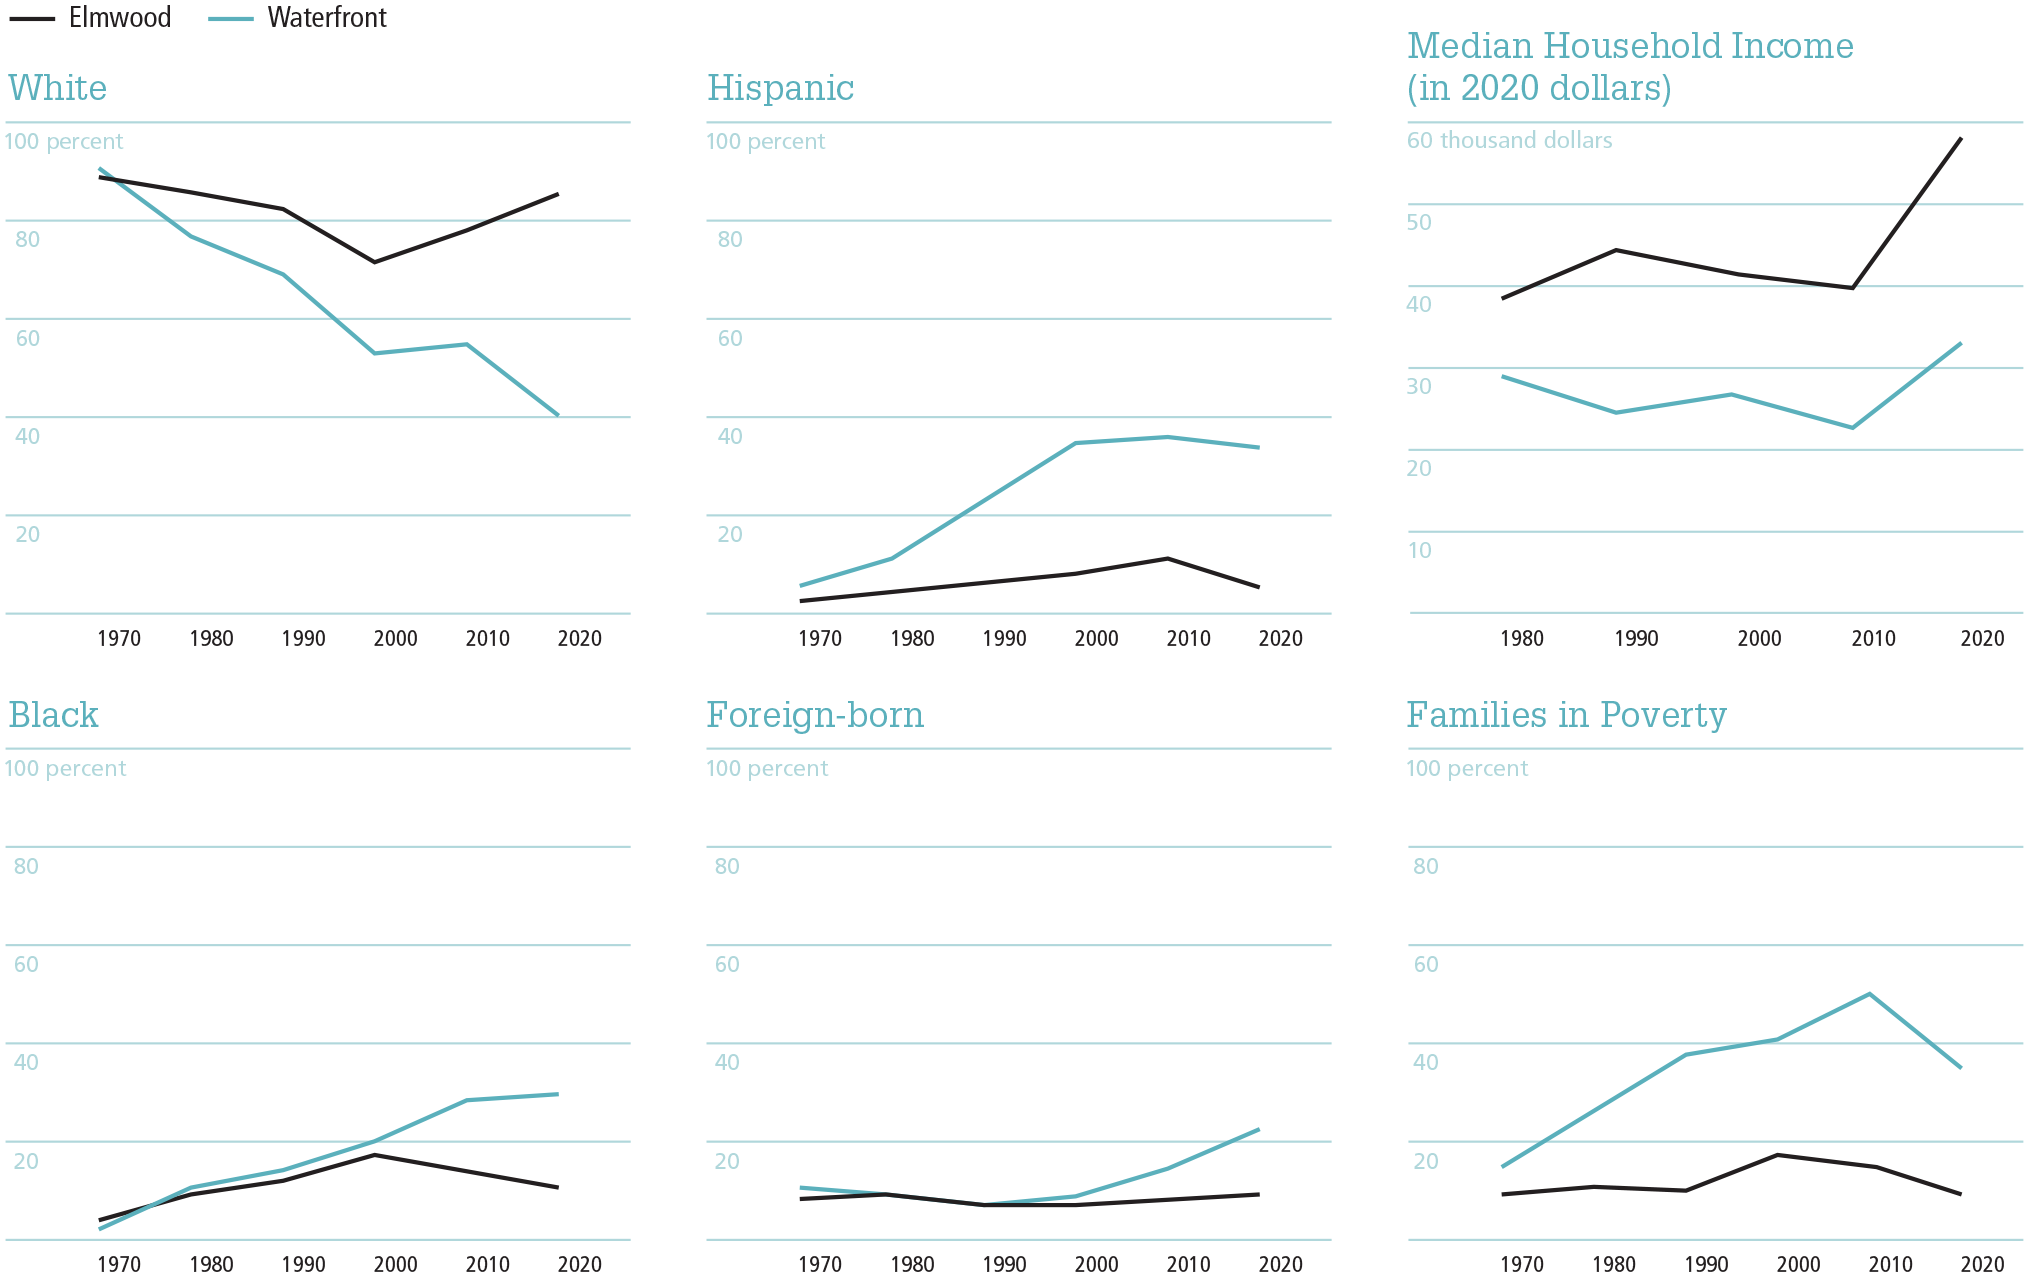
Several factors may account for the different paces and patterns of gentrifi-cation in Elmwood and the Waterfront, including the impact of the recent influx of immigrants and refugees in the Waterfront and its residents’ persistently lower socioeconomic conditions relative to the residents of Elmwood (as shown in the panels). Likewise, as Willer acknowledges in his aforementioned 2022 study, historical records from the early 20th century reveal that Elmwood was not subject to the same intensive redlining as the Waterfront. This likely buttressed property values in Elmwood and fueled its greater overall wealth.
don’t forget about us! the importance of studying small cities
Our primary intent is not to explain the intra-city differences in gentrification evident in Buffalo, but to highlight how these data complicate familiar narratives about gentrification trends. Rather than a relentless, uniform shift from low-income communities of color to affluent, predominantly White neighborhoods, gentrification can and does unfold in disparate ways. In mid-sized, older industrial cities like Buffalo, where the influences of global capital are minimal and overall incomes, housing values, and rents are, comparatively speaking, modest, gentrification may simply look different than what scholars have come to expect. Indeed, the Buffalo case reminds us that gentrification does not always occur evenly across local spaces, nor is it necessarily stable across time.
We hope this depiction of urban trends in Buffalo will inspire more research in secondary and regional cities. Echoing sociologist Richard E. Ocejo and colleagues’ 2020 call in "Centering Small Cities for Urban Sociology in the 21st Century," we argue that the discipline’s longstanding bias toward a few large places has limited understanding of what change looks like in the vast majority of U.S. neighborhoods and communities (for more, we recommend urban sociologist Chase Billingham’s 2015 piece, "The Broadening Conception of Gentri-fication"). This bias has contributed to a circumscribed view of the phenomenon of gentrification and its likely consequences for long-time residents. It’s time to broaden our view.