
Abstract
In the US, the weight of immigration enforcement falls disproportionately on immigrants from Haiti and Central America. How can we tell? I use deportations and immigrant population data to compare which origin countries account for an unexpectedly high number of deportations – after taking into account their share of the nation’s unauthorized immigrant population. These data sources help us see whether deportations by nationality are uneven. In recent years, immigrants from select countries of origin (especially Haiti and Central America) are overrepresented among deportees when considering each origin country’s contribution to the United States’ unauthorized immigrant population.
In the US, the weight of immigration enforcement falls disproportionately on immigrants from Haiti and Central America. How can we tell?
I use data from the Center for Migration Studies (CMS) and the US Department of Homeland Security (US DHS) to compare which origin countries account for an unexpectedly high number of deportations—after taking into account their share of the nation’s unauthorized immigrant population. These data sources help us see whether deportations by nationality are uneven.
If deportations carried out by US DHS reflect only the agency’s obligations to enforce immigration laws, then its deportation figures (by country of origin) should match the profile of the nation’s unauthorized immigrant population. For instance, if US DHS targets unauthorized immigrants across all nationalities equally, then nations that comprise a relatively small share of all unauthorized immigrants should likewise contribute a comparable and small proportion of all deportations. But that is not the case for Haiti and Central America.
Uneven enforcement outcomes reflect policy choices rather than inevitable trends.
Examining deportation trends from 2017 is instructive. Poverty, violence, political instability, and climate change caused a rise in migration, including asylum seekers. Thousands of Haitian migrants were arriving at the US-Mexico border. Recent arrivals sought entry and a new life in hopes of joining others already living here. At the time, the number of unaccompanied minors from Central America eclipsed past trends. Based on 2017 estimates of the nation’s unauthorized immigrant population, immigrants from Haiti, El Salvador, Guatemala, and Honduras made up 16 percent of unauthorized immigrants according to the Center for Migration Studies. Yet, during fiscal year 2017, deportations back to these four countries totaled 27 percent of deportees (see the US DHS Yearbook of Immigration Statistics).
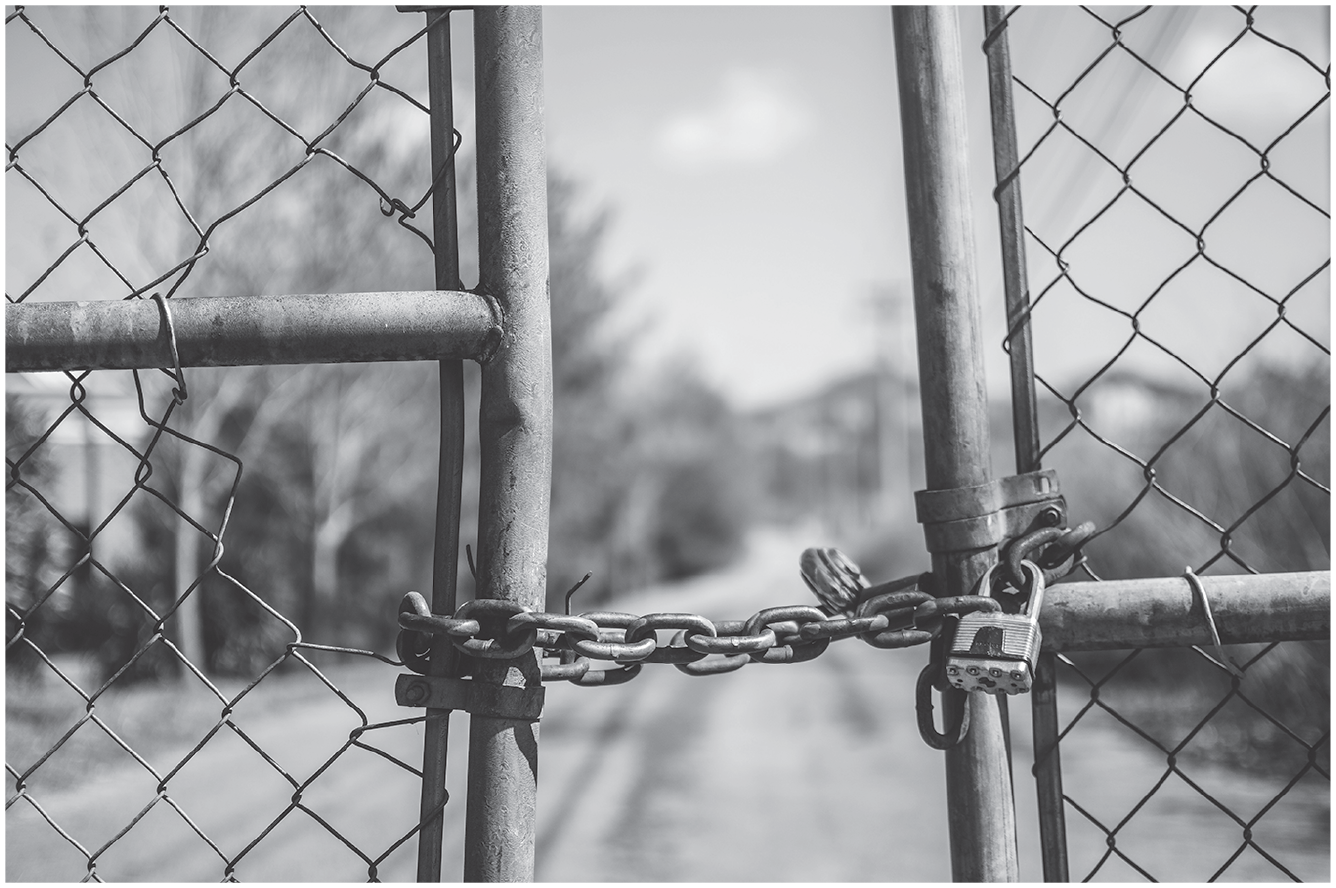
Immigrants to the U.S. from Haiti or Central America disporportionately face more barriers and stronger enforcement than migrants from other parts of the world.
Travis Saylor, Pexels
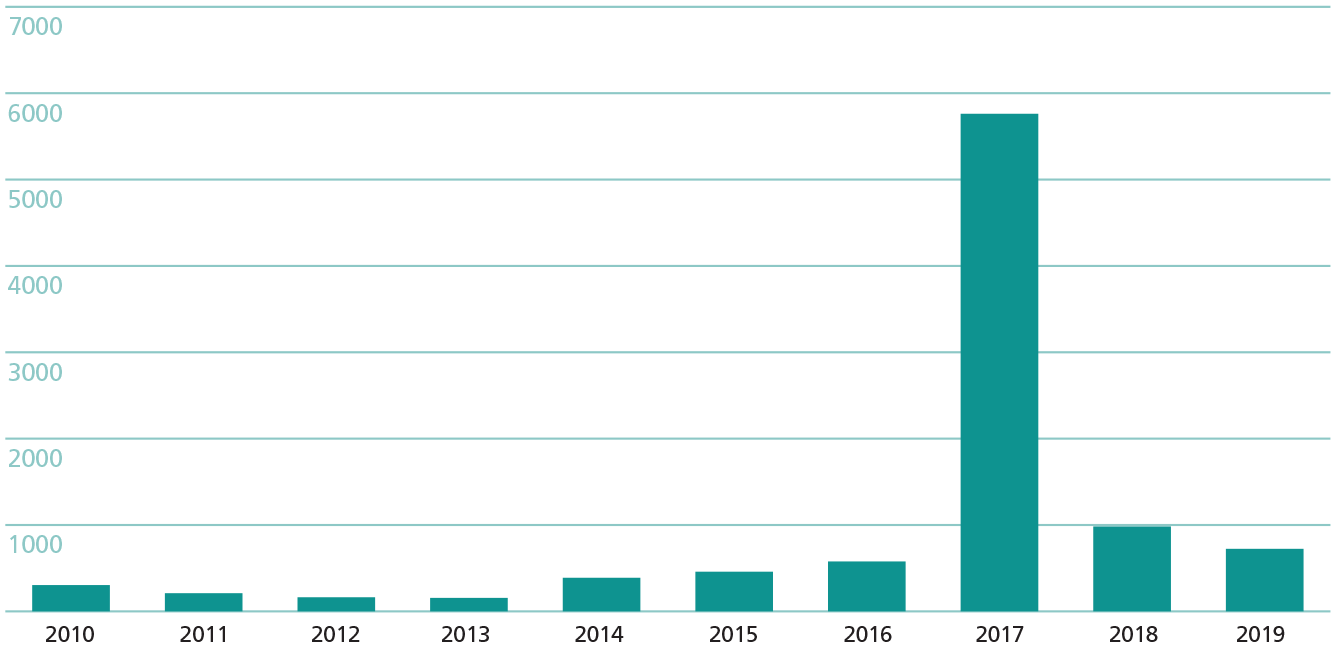
The number of Haitian deportees in 2017 was a dramatic spike from recent trends, as displayed in Figure 1. The volume of Haitian deportations, in other words, reflects policy choices and could have been avoided via alternative policy solutions. After a ten-fold rise in Haitian deportees from one year (578 deportations in fiscal year 2016) to the next (5,762 deportations the following year), Haitian deportations in the latest two years of available data remain elevated compared to 2010 through 2016. During a six-year time span (fiscal years 2010 through 2015), US DHS reported 1,681 deportations back to Haiti. Federal authorities surpassed that total in just two years: 1,707 deportations (fiscal years 2018 and 2019). In May 2021, US DHS announced a new, 18-month designation of Haiti for TPS—a change following five years of heightened uncertainty.
Removals of Haitian Immigrants
Source: Pedroza’s tabulations using the US DHS Yearbook of Immigration Statistics between 2010 and 2019; specifically, Table 37 for 2010, Table 40 for 2011-2013; and Table 41 for 2014-2019.
To put these figures in further context, Figure 2 compares 16 countries of origin whose contribution to the US unauthorized population in 2017 was similar to Haiti. I compare these 16 countries of origin because they all represent a relatively small proportion nation’s unauthorized population. In this group, each origin country accounted for between 0.5 and 1.6 percent of unauthorized immigrants. As such, we would expect none of these countries to account for more than one in 60 (1.6%) deportations in a given year. That reality holds for all countries in Figure 2 except for one: Haiti.
Deportations and Unauthorized Immigrants, part 1
Source: Pedroza’s tabulations of data on 22 countries of origin and their respective proportions of unauthorized immigrants in 2017 (from the Center for Migration Studies) and deportations in fiscal year 2017 (from the US DHS Yearbook of Immigration Statistics
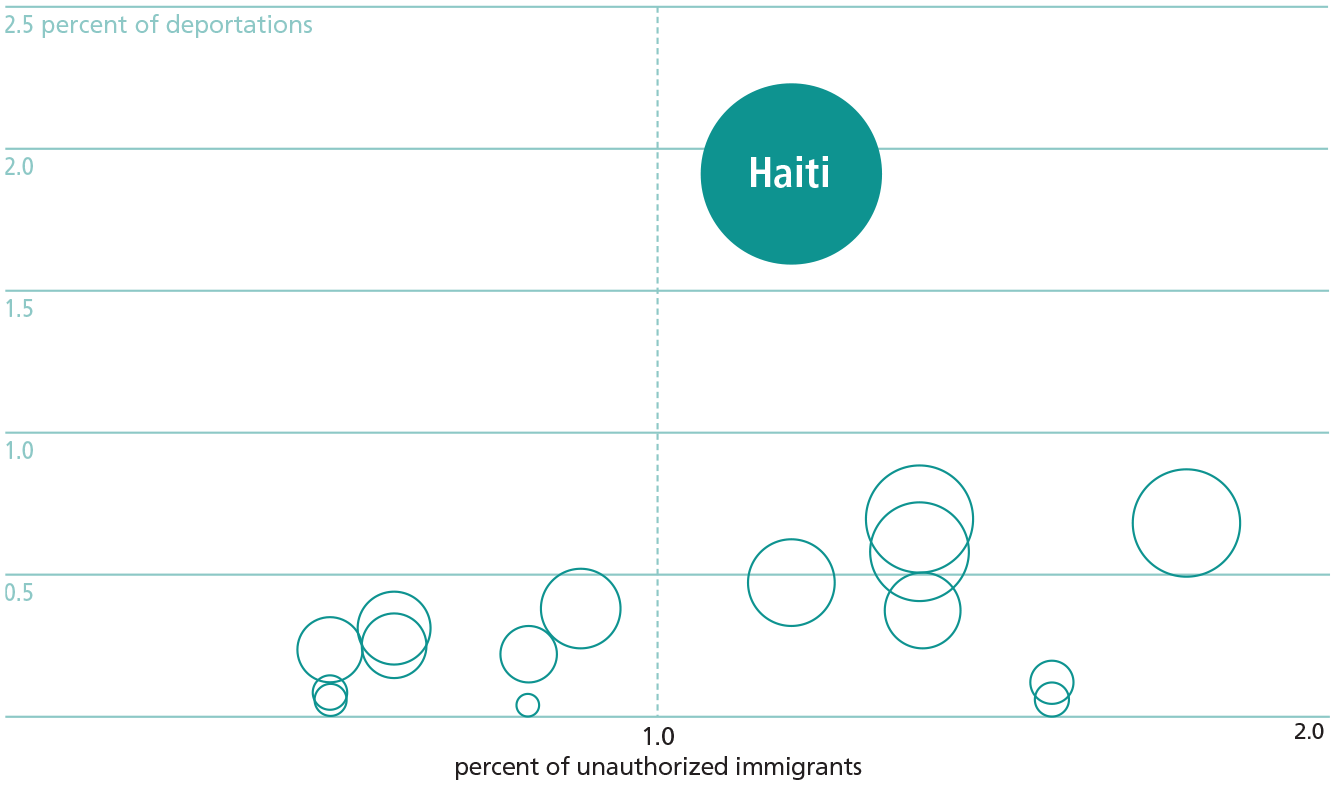
In Figure 2, I plot this distribution (percent of unauthorized immigrants) and contrast these figures to each origin country’s share of deportees. The denominators reflect the estimated number of unauthorized immigrants (X-axis) and the total number of immigrants removed by US DHS (Y-axis). The size of each circle reflects the number of deportees in fiscal year 2017. Despite having a comparably-sized unauthorized population as other groups in Figure 2, Haitian deportees stand out in both volume and proportion of deportations. None of the other 15 origin countries exceeded 1 percent of deportations. By contrast, Haitian deportees (totaling 5,762) comprised nearly 2 percent of all deportations that year; which is much higher than the Haitian share of unauthorized immigrants (1.2 percent). For comparison, immigrants arriving from the Dominican Republic — Haiti’s neighbor—represented 1.8 percent of unauthorized immigrants.
Why did Haitian deportees outpace other countries of origin with comparably sized unauthorized immigrant populations during this time period? To begin, we have recent evidence of anti-Blackness in enforcement outcomes. For instance, a report by the Black Alliance for Just Immigration (https://baji. org) found that Black deportees are more likely to face criminal charges than other immigrants. Haiti’s disproportionate contribution to deportations in Figure 2 suggests differential treatment toward the predominantly Afro-Haitian nation. The disparate impact resulted from the Obama Administration’s September 2016 decision to reverse course on its stance toward Haitians arriving after a devastating 2010 earthquake. The move directly led to thousands of deportations. The Trump Administration later reinforced this approach by refusing to renew Temporary Protected Status (TPS) for Haitian migrants.
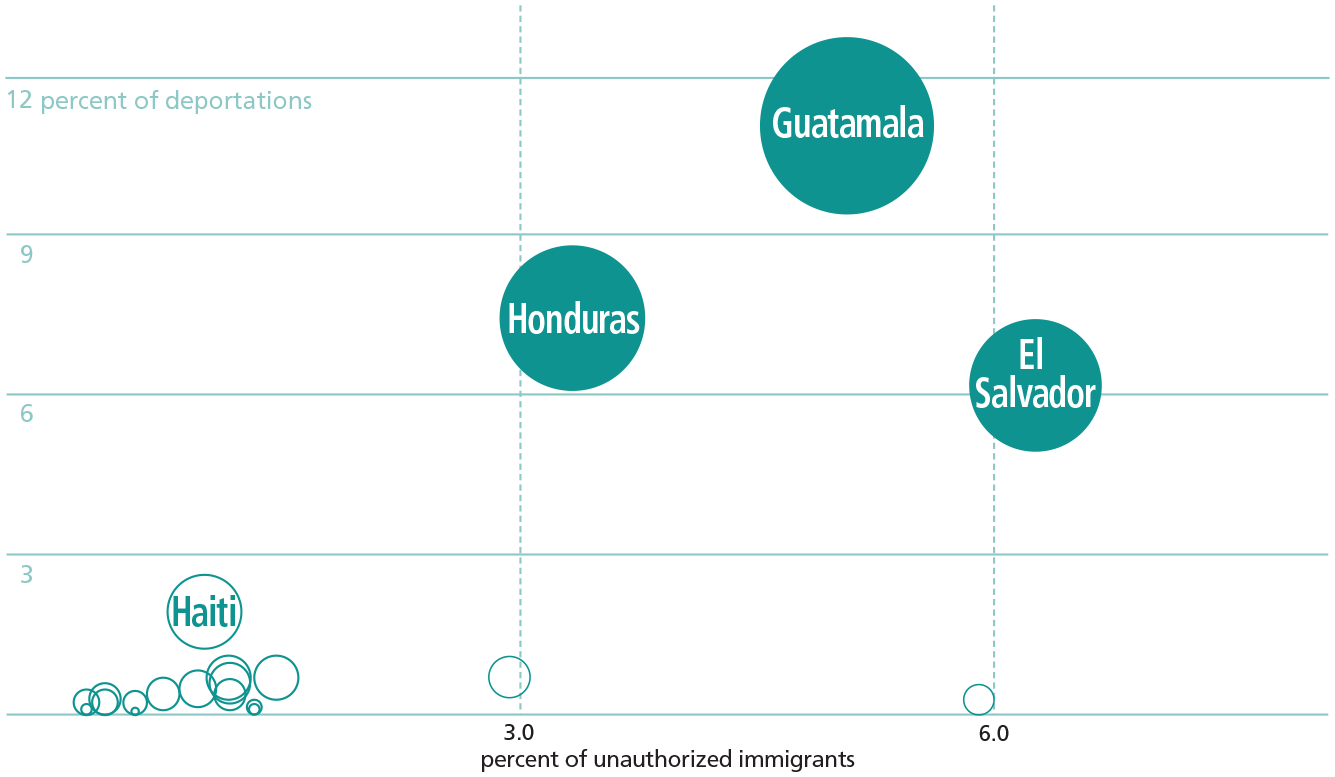
Figure 3 extends the analysis by focusing on three Central American origin countries. Among these countries, we also see a pattern of uneven immigration enforcement in US DHS enforcement data. Just as Haitians account for a higher share of deportees than we would expect, Central American deportees are also over-represented in the government’s own deportation data. The 21 countries displayed in Figure 2 account for 41 percent of unauthorized immigrants and nearly one-third of deportations in fiscal year 2017. Taken together, Guatemala, Honduras, and El Salvador represented 15 percent of the nation’s unauthorized population. If enforcement applied evenly across nationalities, we would expect these countries to also account for 15l percent of deportations. But that is not the case. Instead, they contributed an outsized share of all deportations: one-quarter of deportees during this time period were removed back to one of these three origin countries.
Deportations and Unauthorized Immigrants, part 2
Source: Pedroza’s tabulations of data on 22 countries of origin and their respective proportions of unauthorized immigrants in 2017 (from the Center for Migration Studies) and deportations in fiscal year 2017 (from the US DHS Yearbook of Immigration Statistics).
Why are Guatemalan, Honduran, and Salvadoran deportees overrepre-sented when compared to their share of the unauthorized population? Sociologists have found that Central Americans are more likely to be exposed to enforcement in local communities. Leisy Abrego and Cecilia Menjfvar point to policies of exclusion designed to make life exceptionally difficult for Central Americans. State laws targeting immigrants and policies allowing cooperation between federal and local law enforcement tend to disproportionately expose immigrants from Central America to immigration authorities. Tanya Golash-Boza also finds the US deportation system exposes Central American immigrants to additional surveillance; a process which targets these communities (and thus “racial-izes” immigrants based on nationality and perceived differences) in ways that contribute to the deportation figures we see above. Chiara Galli also documents the role of the nation’s inadequate and ambivalent response to the arrival of unaccompanied minors as another source of exclusion fueling mass deportations of Central American migrants and asylum seekers. In sum, the outsized share of Central American deportees is notable and is not accidental but rather the result of exclusionary policy decisions.
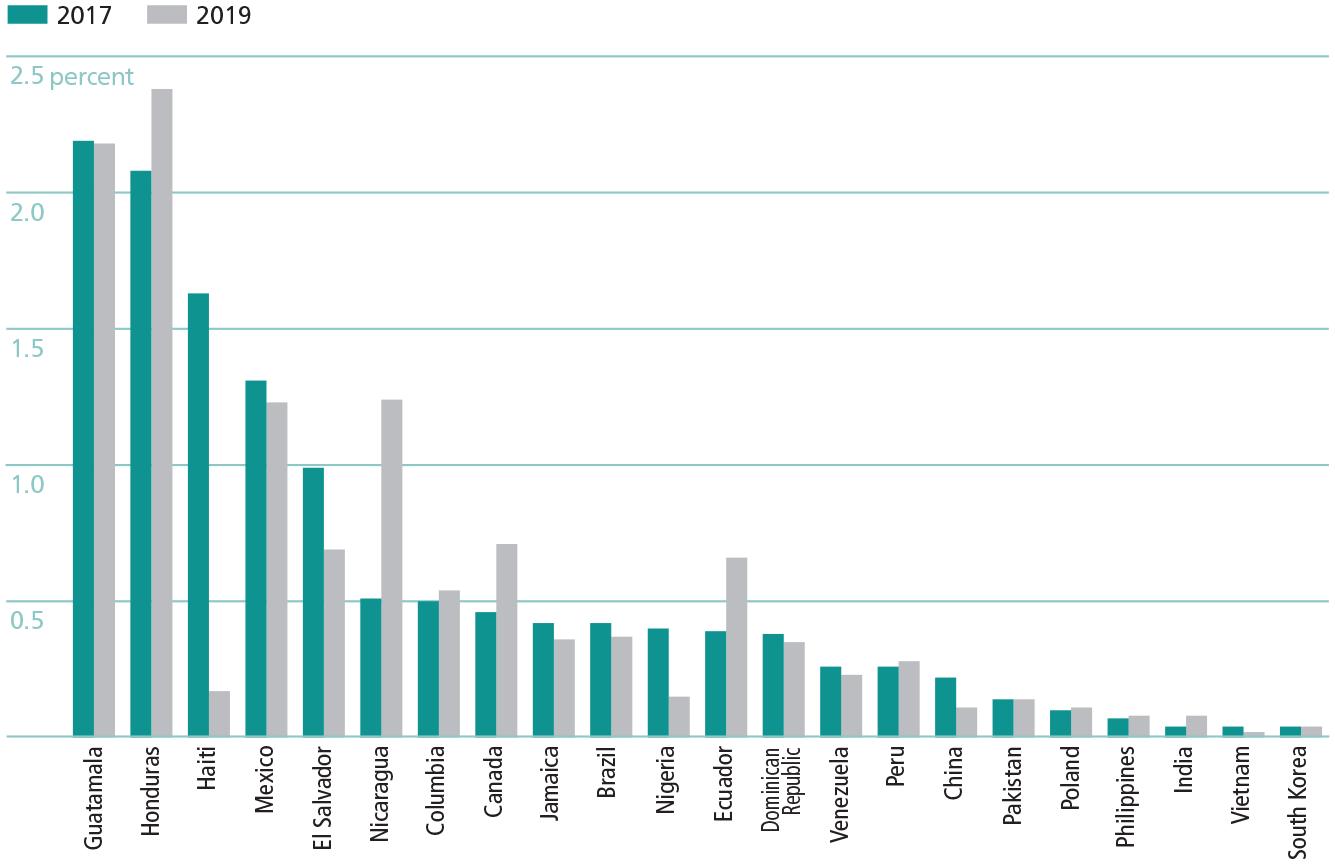
Bringing together recent trends across 22 origin countries, Figure 4 graphs enforcement ratios using the data reported earlier alongside the most recently available estimates of unauthorized immigrants in 2019 and deportations in fiscal year 2019. Again, I compare the percent of unauthorized immigrants for each nation to the same country’s share of deportees, but this time I display these as ratios. Clearly, immigrants from select countries of origin are still overrep-resented among deportees when taking into account each origin country’s contribution of the United States’ unauthorized immigrant population.
Enforcement ratios by origin country and year (deportations/unauthorized)
Source: Pedroza’s tabulations of data on 22 countries of origin and their respective proportions of unauthorized immigrants in 2017 (from the Center for Migration Studies) and deportations in fiscal year 2017 (from the US DHS Yearbook of Immigration Statistics).
We can end these impacts but not without changing course, which starts with action at the federal level to reverse the nation’s investments in mass deportations.
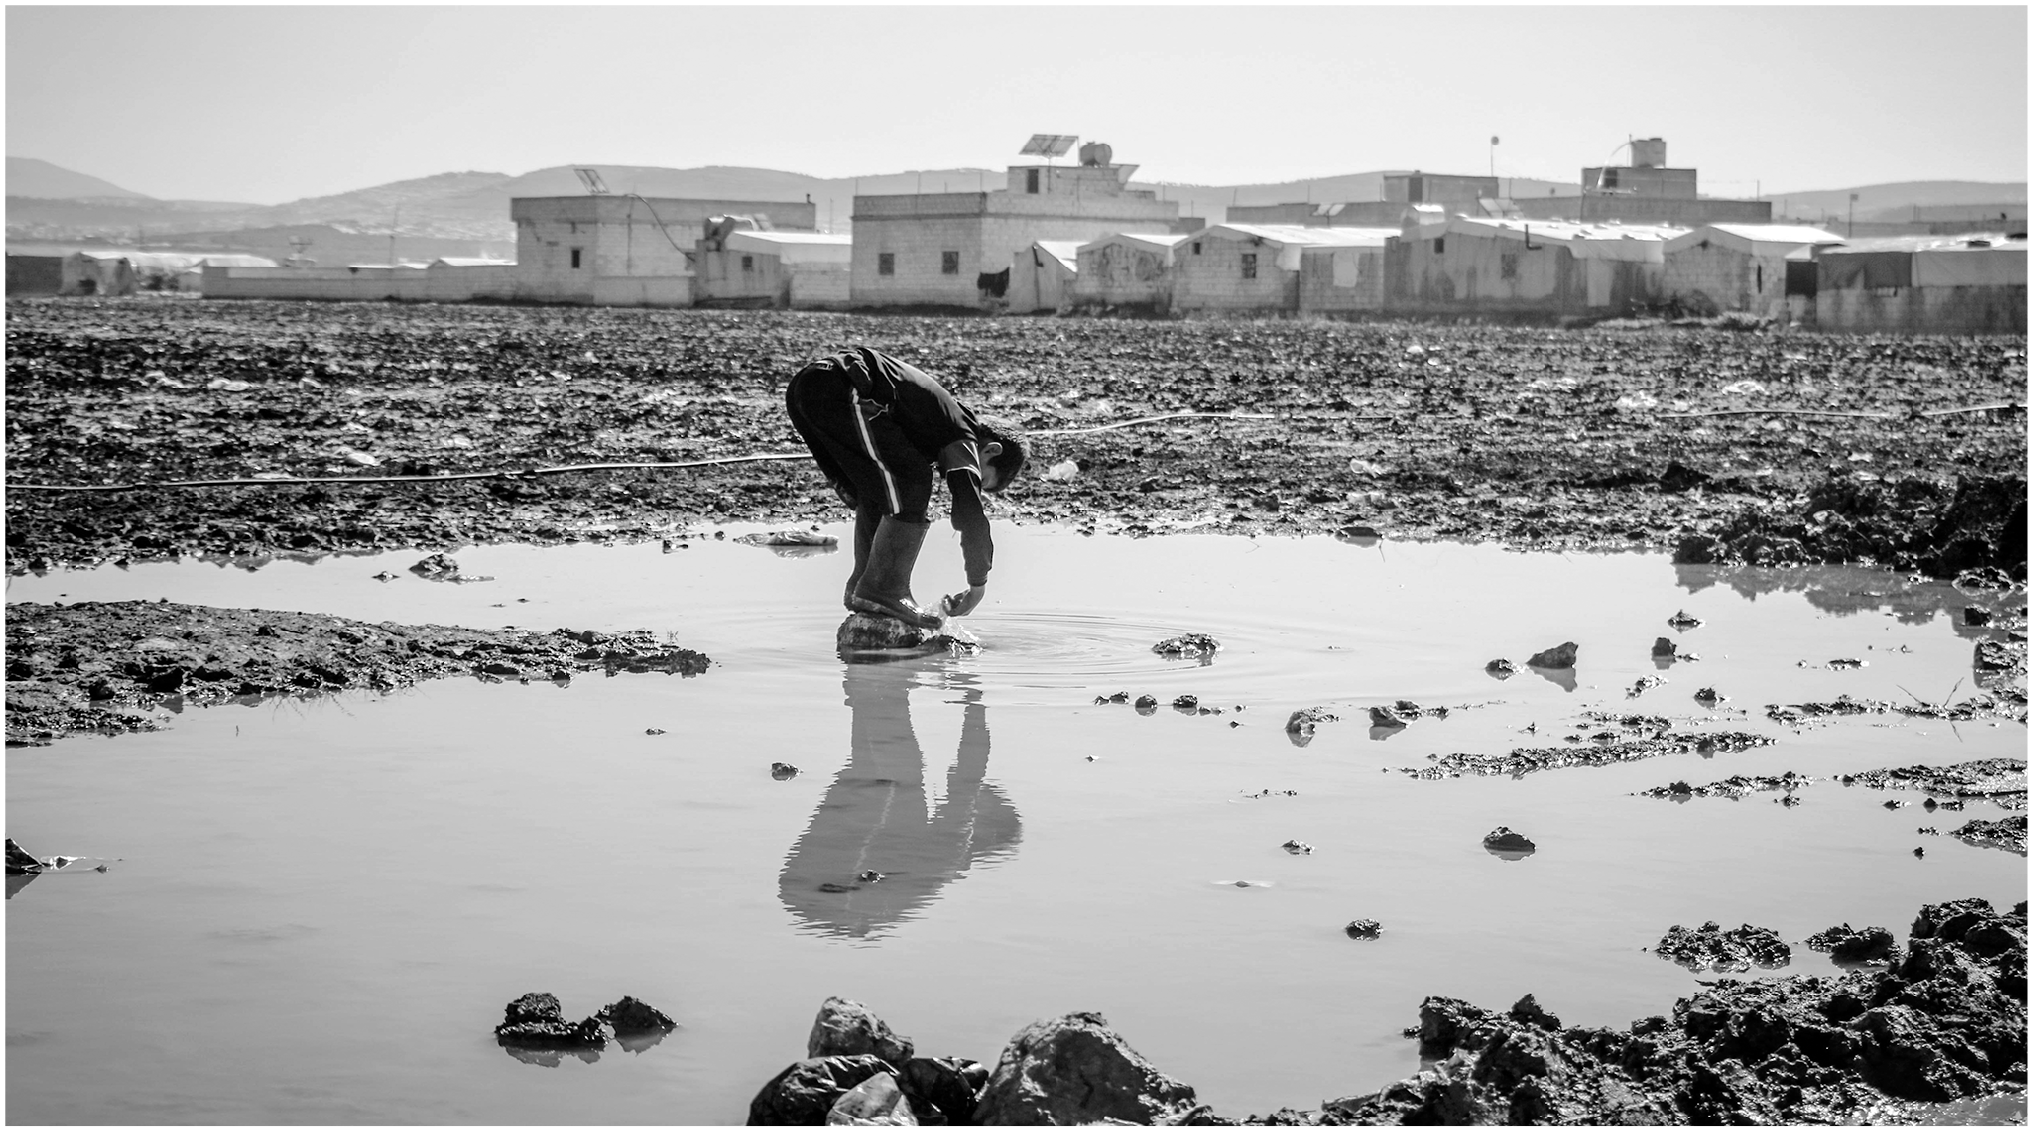
A man washes his shoes outside of a refugee camp where migrants wait indefinitely to seek asylum.
Ahmed Akacha, Pexels
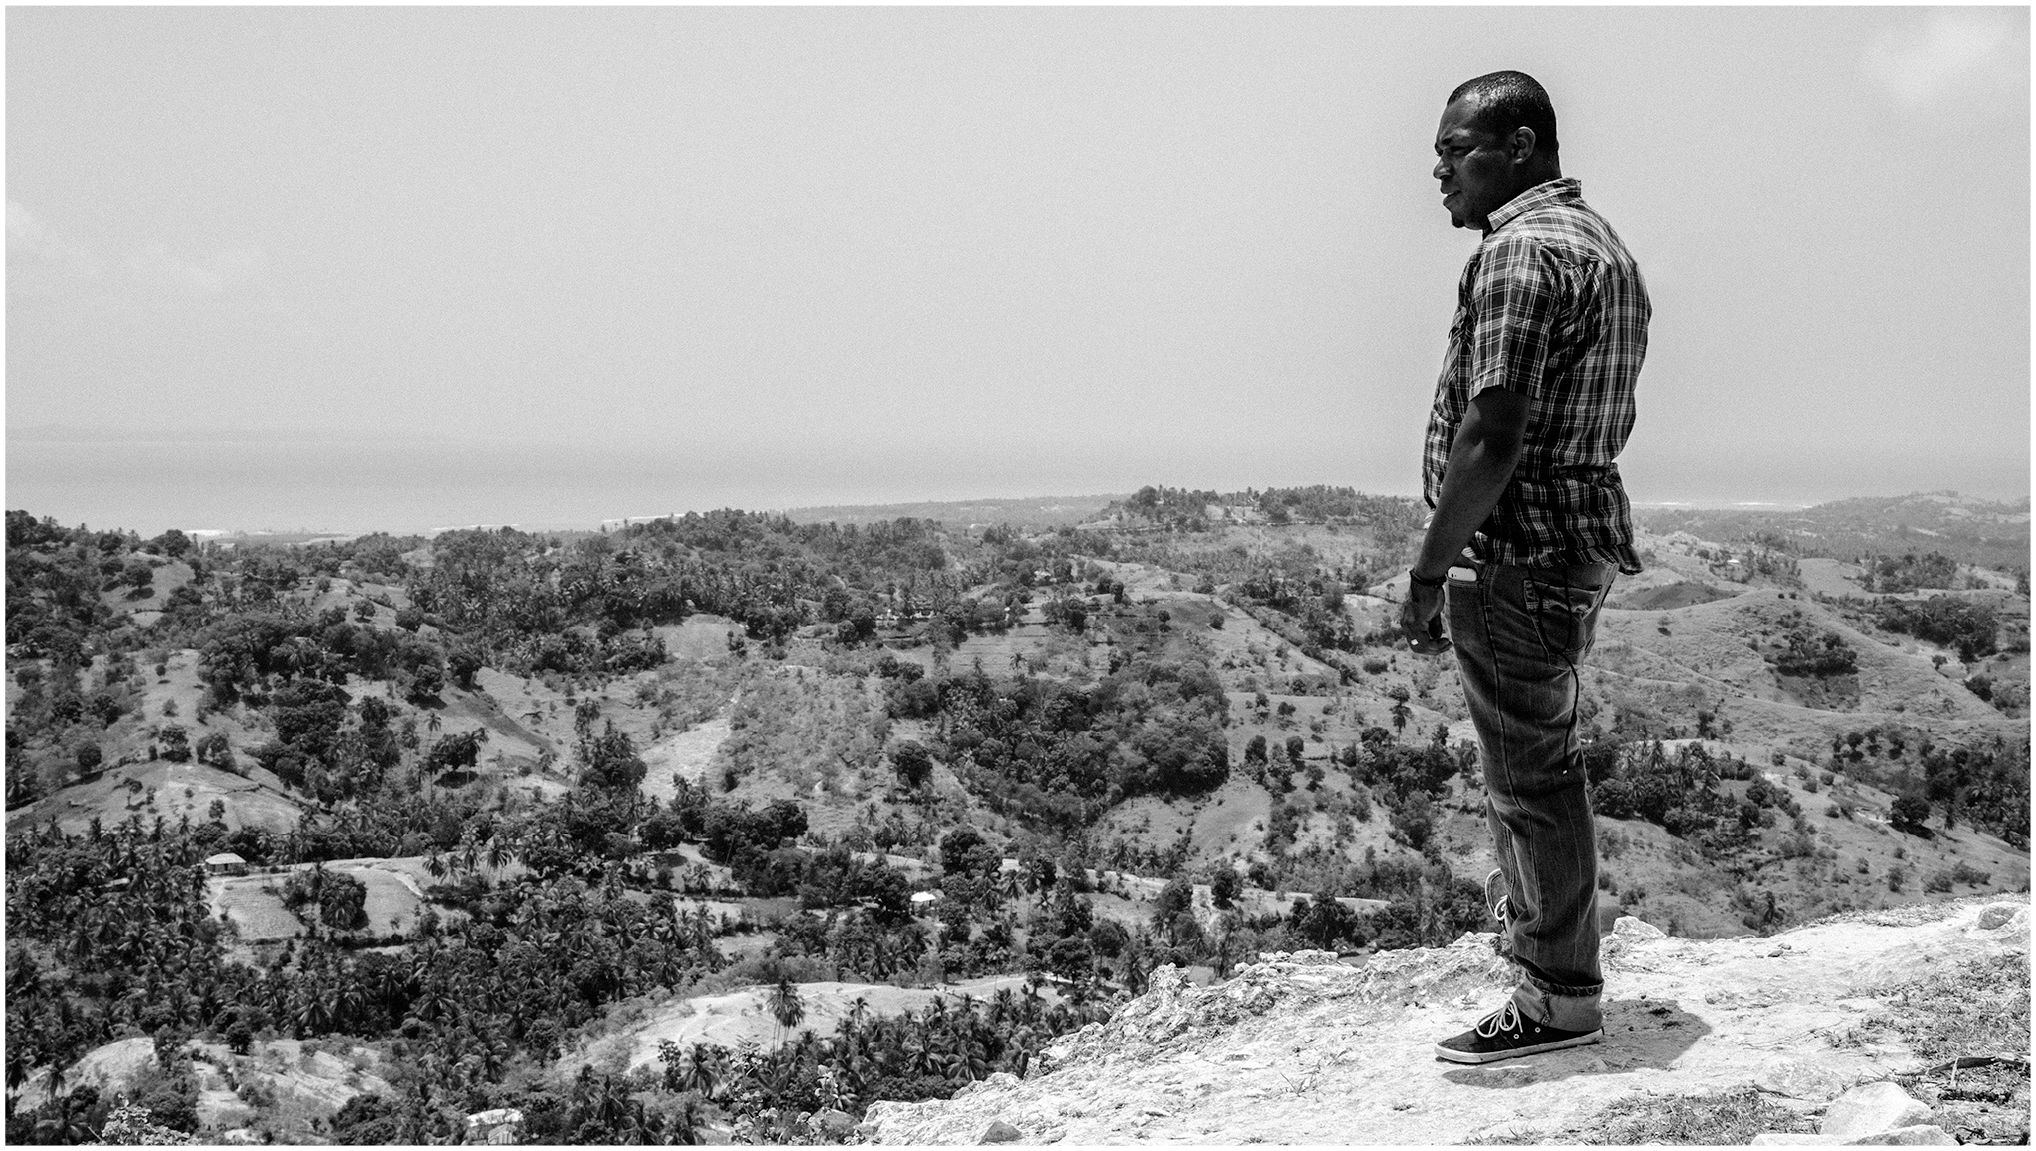
Migrants from Haiti and Central America are often more likely to be fleeing dangerous conditions than other groups that arrive to the U.S.
Kelly L, Pexels
Uneven enforcement outcomes reflect policy choices rather than inevitable trends. So far, the impact of deportations falls more heavily on immigrants from select countries of origin—including, as we see in the government’s own data, immigrants from Haiti and Central America. We can end these impacts but not without changing course, which starts with action at the federal level to reverse the nation’s investments in mass deportations.