
Abstract
michael hout on finding the non-religious through longitudinal data.
Most Contexts readers will know that in recent years Americans became less attached to organized religion. The 2016 General Social Survey (GSS) estimated that 22% of adults preferred no religion, up from 21% in 2014, 14% in 2004, 9% in 1994, and 7% in both 1984 and 1974. This strong trend invites the inference that American religion is declining rapidly. But no single trend can give a complete view of a complicated institution. The rise of the “nones” is interesting, in part, because it is the most extreme evidence of religious decline in the United States.
People for whom religion is not a “strong” identity give less reliable answers for questions on religion.
To balance the assessment, I turn to GSS data on the strength of religious identification, participation in religious services, prayer, and belief in God. The data show a polarization of sorts. While non-affiliation has grown, people claim a strong religious identification as often as they did forty years ago. The trend to non-affiliation occurred among people who were not strongly attached to religion and who rarely attended services. To characterize the change as “liberals emptying the pews,” as a recent Atlantic article did, is inaccurate. Non-attenders disaffiliated. More and more Americans have to come to think of religion as all or nothing at all.
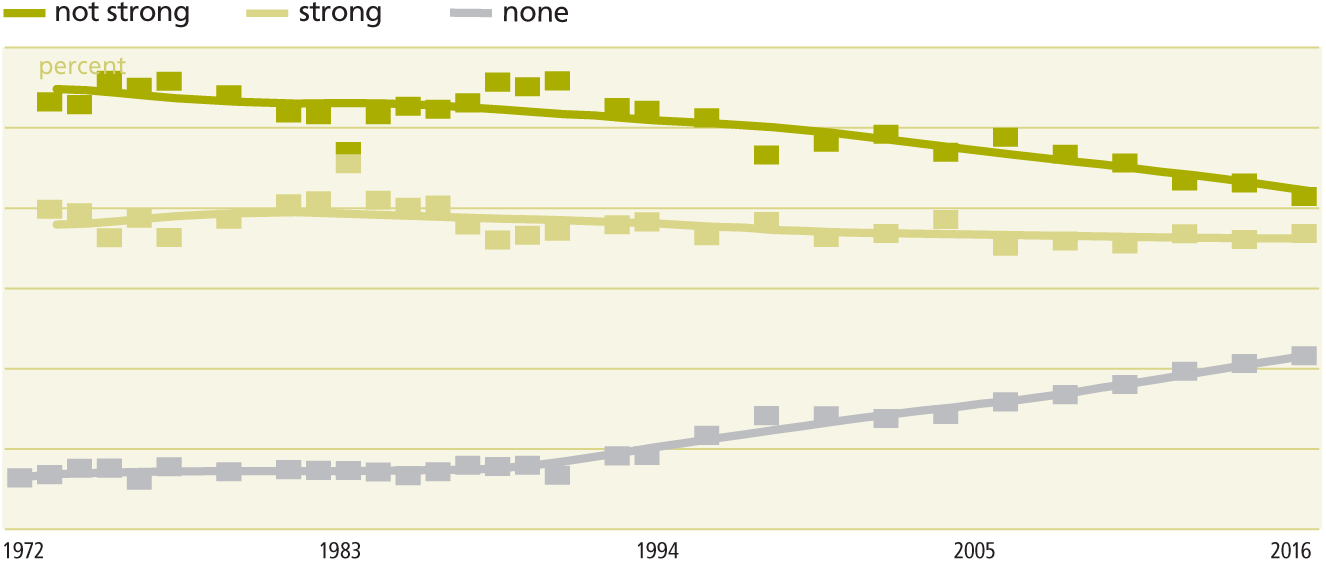
Strong religious preference and no religious preference by year: United States, 1973-2016
Source: General Social Surveys, 1973-2016 (data weighted and adjusted for design effects)
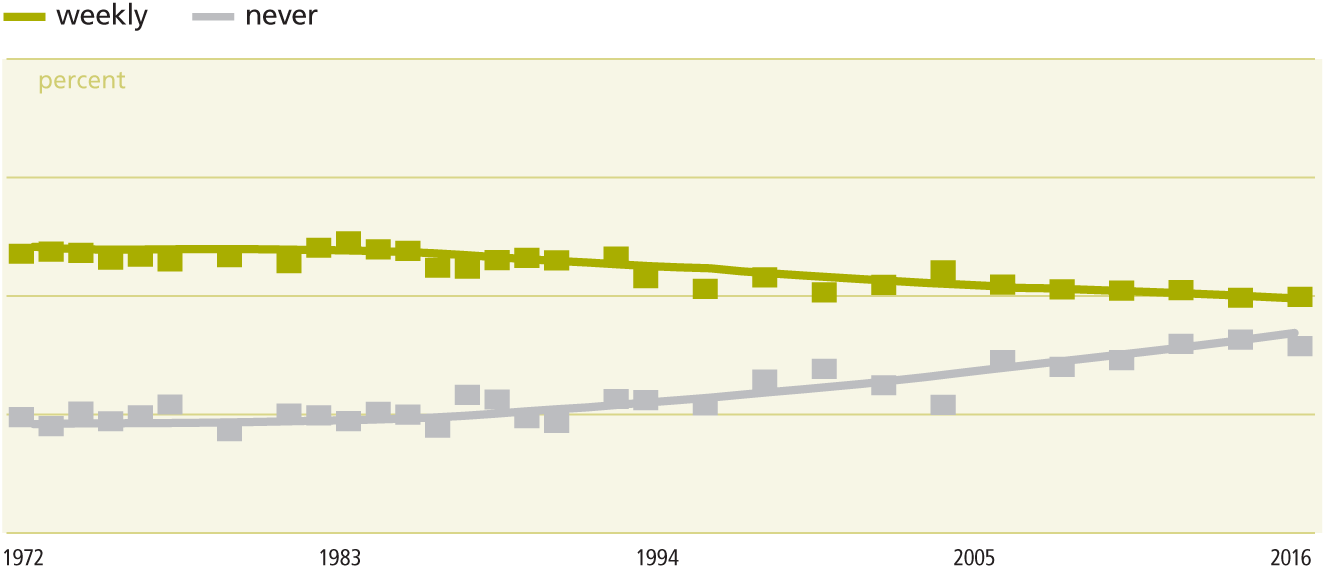
Attendance at religious services – weekly and never – by year: United States, 1973-2016
Source: General Social Surveys, 1973-2016 (data weighted and adjusted for design effects)
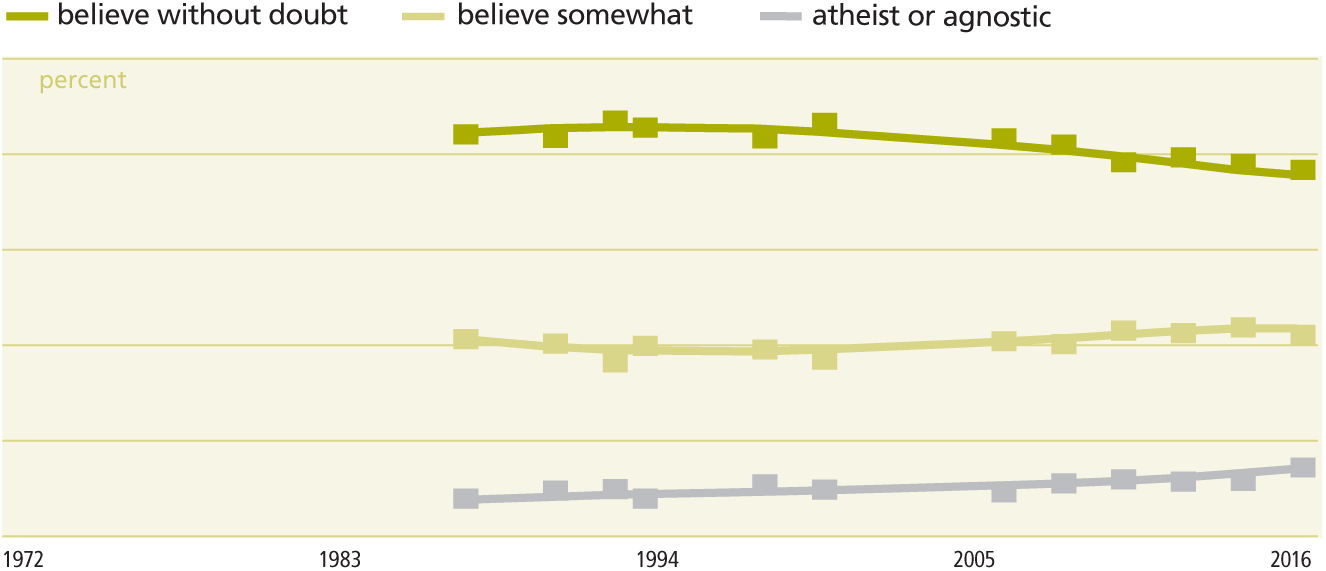
Belief in God – without doubt and unbelief – by year: United States, 1986-2016
Source: General Social Surveys, 1986-2016 (data weighted and adjusted for design effects)
Affiliation, Behavior, and Belief
In 2016, 37% of American adults declared a strong religious preference, a decrease of just two percentage points from 39% in 1976 (see the middle line in the top figure). The dramatic rise in no religious preference (the bottom line) came at the expense of holding a “somewhat strong” or “not too strong” religious preference. The data come from a GSS question that follows the main religion question, “What is your religious preference? Would that be Protestant, Catholic, Jewish, no religion, or something else?” The follow-up question is “Would you call yourself a strong [religion] or not very strong [religion]?” (The interviewer is directed to insert the person’s religious preference into the question). Between 35 and 39% of Americans called themselves “strong” members of the religion they preferred. In the 1970s and 1980s, 53 or 54% Americans called themselves “not very strong” or “somewhat strong” in their religious preference. By 2016, less-than-strong preference had fallen 12 percentage points to 42%.
Scholars have proposed that for people for whom religion is a primary identity, for the most part meaning the people who say they have a “strong” religious preference, answering these questions is easy. They think of themselves, in part, in the terms of their religious commitment. Almost by definition the rest of the population is made up of people who think about religion less often. Religion is more or less absent from their lives most of the time. Few are aggressively anti-religious (one or two percent may be); instead, they simply think of themselves in other terms and think of religion seldom if at all. People for whom religion is not a “strong” identity give less reliable answers on surveys, even to the question of whether or not they have a religious preference. Many name a religion in one interview, then say they have no religious preference the next time the survey asks (and vice versa). Scholars have named this back-and-forth stance “liminal,” as if the respondent is standing in the doorway between religion and no religion, not firmly in either. In the usual one-off survey, we cannot separate the liminals from those who are fixed in either the religion or no-religion category. With repeat interviews, we can. In my own research with the GSS panel data, I have found that about 20% of American adults were liminal in the period from 2006-2014. Furthermore, most liminals said that they were “not strong” when they voiced a religious preference.
The GSS belief question:
Please look at this card and tell me which statement comes closest to expressing what you believe about God:
Some churches are emptying, but that is due to the demographic and geographic turnover of the population, not disaffiliation. New churches in growing cities and suburbs offset the closing of churches in declining neighborhoods.
Religious behavior may or may not have changed as non-affiliation increased, depending on the measure. More Americans say they never attend services than used to be the case. In 2016, 26% of Americans never attended religious services, up twelve points from the 14% who never attended in 1986 (see the middle figure; there was no appreciable change prior to 1986). Weekly attendance, on the other hand, fell only half as fast, decreasing six percentage points from 35% in 1986 to 29% in 2016. If the trend was fully consistent with changes in affiliation, weekly attendance would have held steady while non-attendance increased. That did not happen, because Catholics decreased their church attendance without leaving Catholicism. My own research showed that even strong Catholics became less likely to attend services between 1990 and 2006. Irregular religious attendance was the norm in the U.S., even in the 1960s. The GSS data show that a majority, between 50 and 55%, of Americans attended services irregularly through the mid-1980s. Since then, irregular attendance dropped about six percentage points to 45% in 2016 (still a plurality of Americans). Some churches are emptying, but that is due to the demographic and geographic turnover of the population, not disaffiliation. New churches in growing cities and suburbs offset the closing of churches in declining neighborhoods.
Prayer is a more private form of religious behavior. While communal religious services are more sociologically relevant, private prayer can help highlight the distinction between organized religion and personal spiritual development. Americans pray as frequently now as when the GSS first measured prayer in 1983 (data not shown).
When Claude Fischer and I first wrote about non-affiliation in 2002, we stressed the “unchurched believers”—people who stated no religious preference, but believed in God. Few “nones” were atheists at that time, and that is still true. In 2016, just 14% of people with no religious preference believed God does not exist; 20% believed in God without doubt (see inset for the six response alternatives). Overall, atheists were 4% of the adult population in 2016; agnostics were another 7%. Unbelief increased while non-affiliation increased, but much more slowly (see bottom p. 79). A strong majority (57%) believed in God without doubt in 2016, down from the initial estimate of 64% in 1988. Thus the decrease in strong belief was slower than the rise of non-affiliation (and about the same as the decrease in weekly attendance).
The rise of the “nones” is probably the best-known trend in American religion over the past two decades. It is also the biggest. Other trends imply only slight religious decline since the 1980s. Strong religious commitment did not decline. It was weak initial attachment that gave rise to today’s non-affiliation. People who used to occasionally attend services no longer attend at all, but regular attenders persist. Most Americans believe in God and pray to that deity. The irony is that people disaffiliating from organized religion barely registered in the churches because the “nones” rarely attended services.