
Abstract
Amon Emeka on finding the cities where employment discrimination is the lowest.
Keywords
Unemployment has become a pronounced and seemingly permanent problem in Black America. Black unemployment has routinely been twice or more as high as White unemployment for the last several decades. This pattern reflects an especially potent form of social exclusion that continues to demand the attention of social scientists and policy makers. It can rightly be called exclusion first because scholars who study unemployment tend to count as unemployed only people who are activly pursuing jobs but are unable to have them, at least momentarily, and second, because unemployment engenders an array of material and non-material deprivations that bear negatively on the quantity and quality of life among those who experience it. There is broad agreement that race is a significant factor in patterns of unemployment but much less agreement about why.
There is broad agreement that race is a significant factor in patterns of unemployment but much less agreement about why.
The confusion stems from our tendency to ask “what kinds of individuals get jobs?” in hopes of identifying personal characteristics that might explain individual Black workers’ inability to secure employment rather than asking “under what kinds of circumstances are job opportunities distributed most equitably?” in order to identify contextual characteristics associated with higher or lower levels of racial exclusion.
Who Gets the Jobs?
To answer this question, statistical techniques are often used to see how various personal characteristics effect the probability that a given worker will be employed. Not surprisingly, more education is associated with a greater chance of employment. The policy implications are straightforward—the more education one has, the greater is the likelihood of her employment. We need to make sure everyone graduates from high school or, better yet, college. A logical extension is that the high rates of unemployment among Black workers would be most effectively remedied by finding ways to ensure their high school or college graduation.
But there are at least two ways this reasoning is incomplete. First, setting aside the difficulties of doing so, even if we were able to deliver 100% of all young people to college graduation, it would not dramatically alter the shape of our local and national labor markets. That is, the demand for labor might not change much even if the labor pool contained nothing but college graduates. Employers would still be able to categorically exclude workers from their applicant pools based on racial stereotypes and still have many qualified applicants. For employers, the question would become, “given what (little) I know of Black people or Black workers, would I rather hire a Black graduate or a White or Asian or Latino graduate?” Their answers have not tended to bode well for Black workers.
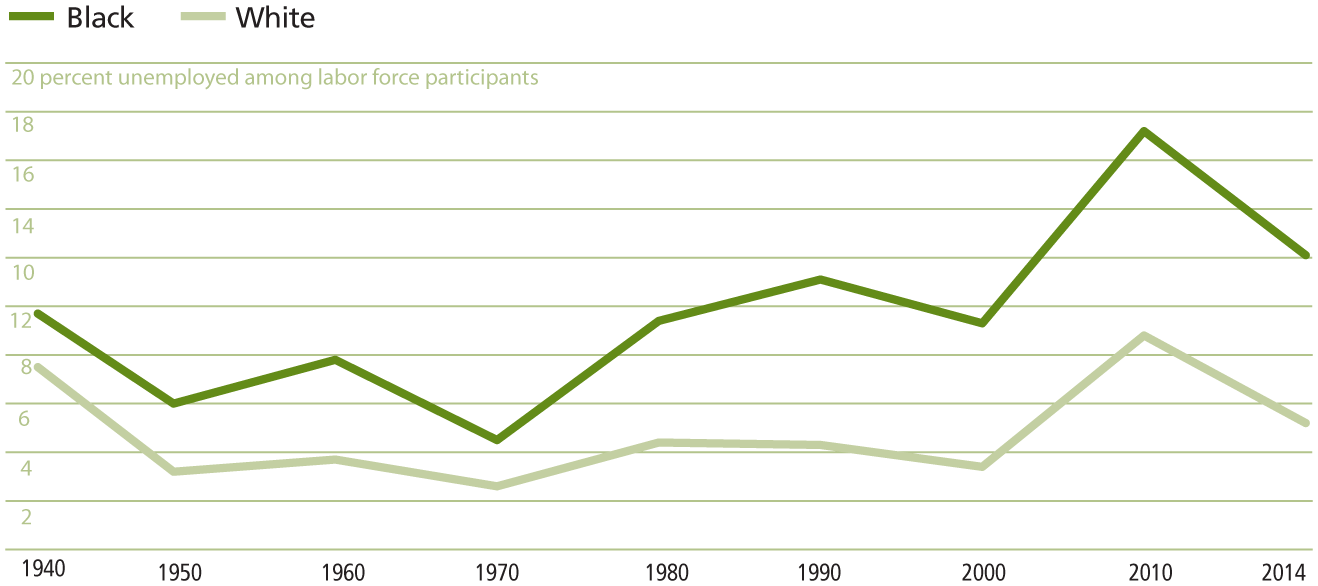
Unemployment among working age (25-59 yrs) White and Black men since WWII
Source: U.S. Census and American Community Survey Files courtesy of the Minnesota Population Center (IPUMS 2015)
That leads to a second fundamental flaw of arguing that education is a surefire way to eliminate racial employment gaps: Black workers have significantly higher rates of unemployment even when we compare them to White workers with the same or similar educational credentials. Many labor market researchers acknowledge as much. An important policy implication of this finding is that even if Black, White, and other workers had identical levels of education, their unemployment rates would continue to differ to the detriment of Black workers. This does not diminish the importance of education, but it does expose a shortcoming of analyses carried out at the level of the individual. While it is important to know what kinds of individuals are successful in labor markets, it is equally important to know what kinds of labor markets are successful at yielding equitable outcomes for similarly qualified individuals. Therefore, labor markets—not just individuals—should be compared if we are to get a complete understanding of persistent racial employment gaps in the U.S.
Which Labor Markets Distribute Job Opportunities Equitably?
Sadly, the answer to this question is none. However, when we examine the size of the racial employment gap from place to place, we can learn what labor market characteristics are associated with more or less racial exclusion. Few studies of the racial employment gap have taken this route, though it allows us to more directly answer questions about the role of systems and contexts—not individual workers—in generating racial inequality.
There are several ways to quantify the racial gap for the purposes of comparisons across time and place. In their 1995 article in Social Forces, Samuel Cohn and Mark Fossett used 1980 Census data to calculate the ratio of the odds of White employment to the odds of Black employment among men between the ages of 25 and 59 in U.S. metropolitan areas with substantial Black populations. They found that the White odds of employment were 1.2- to 4.3- times as great as Black odds of employment, depending on which metropolitan area they resided in. (That analysis, like mine, uses odds ratios, which are a little tricky to read. If 90% of White men are employed, compared with 75% of Black men, then the odds ratio is 3-to-1, or 9/1 divided by 3/1.)
In the relatively stable years leading up to the Great Recession, racial employment gaps were no less pronounced in American cities than they had been 25 years earlier. In many, the gaps were larger. I have replicated Cohn and Fossett’s calculations using data from 2010-14—a full generation after the workers considered in their study. I have also calculated racial employment gaps holding the age and education constant so we can see the extent of difference between White and Black men who live in the same metropolitan areas with the same levels of education and who are of the same age. The differences remain substantial. The first figure below lists the ten metropolitan areas in which the White-Black employment gaps were the widest.
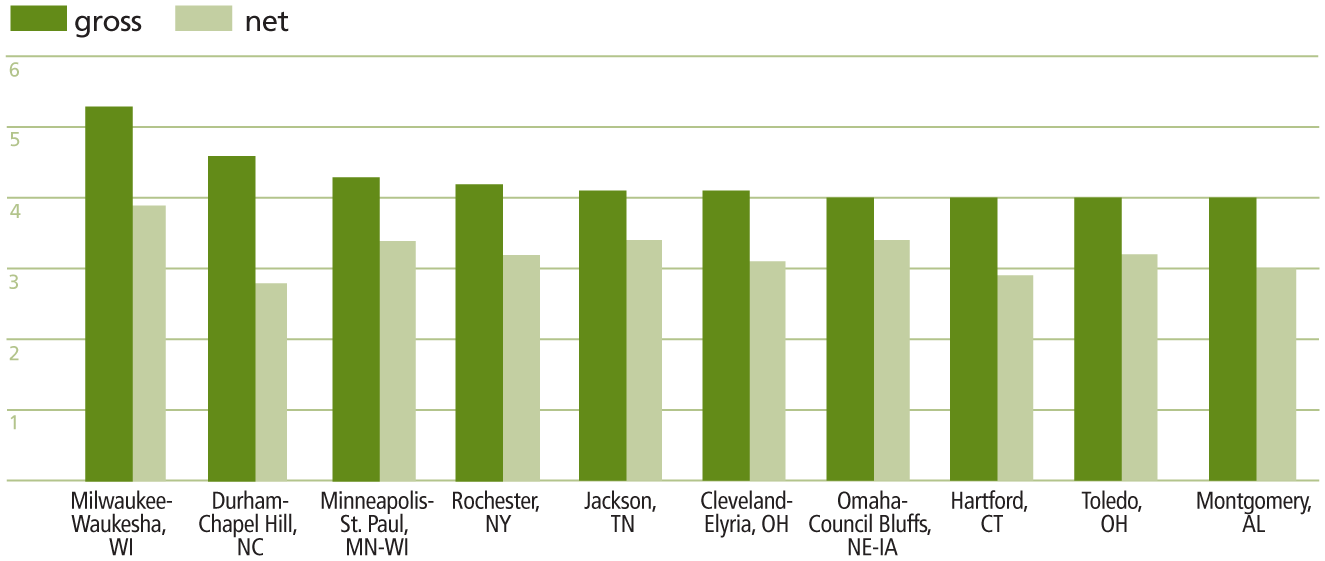
Where race matters most*: the White odds of employment are __ times as great as the Black odds of employment
*based on the calculated ratio of the White odds of employment to the Black odds of employment in each metropolitan area. In 2010-14 the White odds of employment were 5.3 times as great as the Black odds of employment in Milwaukee-Waukesha, WI. The lighter bars depict net racial differentials in the odds of employment when age and education are held constant. In 2010-14, the White odds of employment were 3.9 times as great as the odds of employment of Black workers of the same age and education level in Milwaukee-Waukesha, WI.
Source: 2010-14 American Community Survey aggregate file courtesy of the Minnesota Population Center (IPUMS 2015).
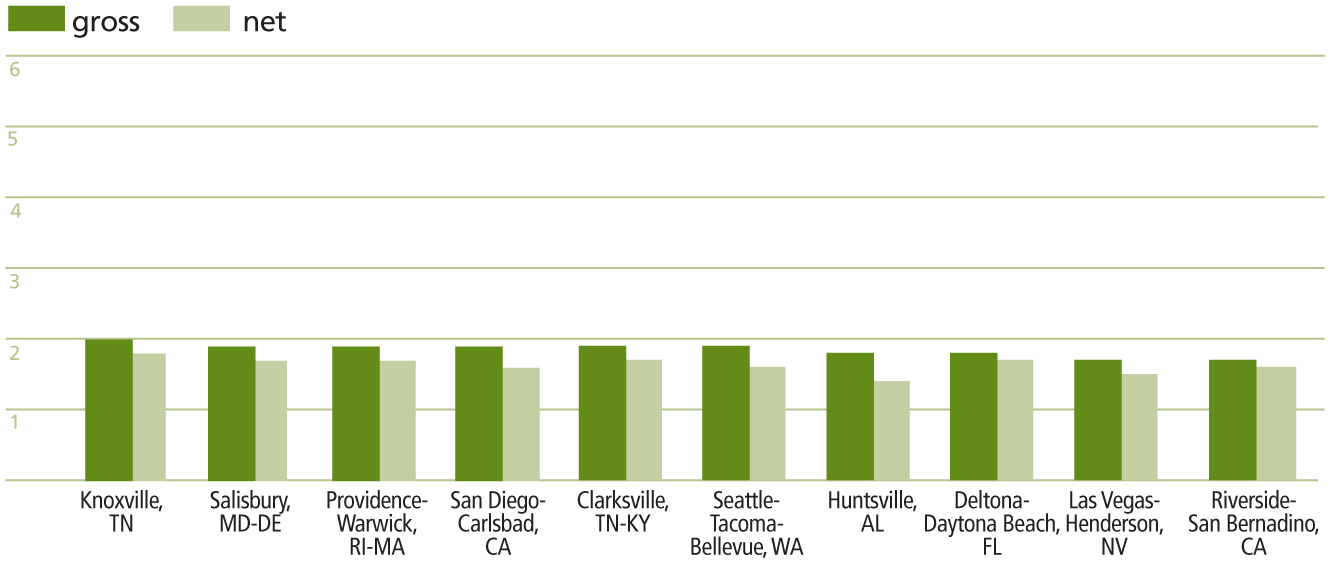
Where race matters least*: the White odds of employment are __ times as great as the Black odds of employment
*based on the calculated ratio of the White odds of employment to the Black odds of employment in each metropolitan area. In 2010-14 the White odds of employment were 1.7 times as great as the Black odds of employment in Riverside-San Bernardino, CA. The lighter bars depict net racial differentials in the odds of employment when age and education are held constant. In 2010-14, the White odds of employment were 1.4 times as great as the odds of employment of Black workers of the same age and education level in Huntsville, AL.
Source: 2010-14 American Community Survey aggregate file courtesy of the Minnesota Population Center (IPUMS 2015).
The median value of the White-Black odds ratios across U.S. metropolitan areas was 2.5 in 1980 and 2.8 in 2010-14, suggesting that, just as was true a generational earlier, White workers have odds of employment that were two and a half (or more) times as great as those of their Black peers in the typical U.S. city. In the ten metropolitan areas listed, White workers have odds of employment that are at least four times as great as those of their Black counterparts and three times as great as Black counterparts with identical education attainment and ages. The exceptions to this are Durham-Chapel Hill, NC and Hartford, CT. In those two places, the racial employment gaps are substantially reduced when education and age are held constant. So, what is it about Milwaukee, Minneapolis-St. Paul, Rochester, and the other cities listed that would explain the large racial employment gaps evidenced in them?
So, what is it about Milwaukee, Minneapolis-St. Paul, Rochester, and the others that would explain the large racial employment gaps evidenced there? How might their social, cultural, demographic, legal, and political regimes lend to our understanding of racial employment gaps everywhere? Of course, an examination of metropolitan areas where racial exclusion is most pronounced will provide incomplete answers.
Sociologists have long thought that where members of minority groups are most numerous, efforts to exclude them would be most intense—the case of Chicago supports this view, but the case of Huntsville, AL offers a curious counterpoint.
To understand racial employment gaps more completely we must answer another seldom-asked question: Where are White advantage and Black disadvantage least pronounced? Answers are offered in the second figure on p. 73 below. In these places, the White odds of employment ranged from 1.7 to 2.0 times as great as those of Black workers. The list includes a diverse set of metropolitan areas spread across the country and raises interesting questions. What might Clarksville, Tennessee have in common with Seattle or San Diego? What might Las Vegas have in common with Huntsville, AL?
What Kinds of Labor Markets Distribute Job Opportunities Equitably?
Most of the cities where race matters most are located in the Midwest and have large Black populations, but the fact that this is not true of some of them—Hartford, CT, for instance—suggests that racial exclusion is not simply a matter of geography or racial composition.
Sociologists have long thought that where members of minority groups are most numerous, efforts to exclude them would be most intense—the case of Chicago supports this view, with its large Black population (18%) and relatively high level of Black exclusion. However, the case of Huntsville, AL offers a curious counterpoint with its large Black population (22%) and low level of Black exclusion. There are myriad other metropolitan area characteristics that may lead to more or less racial exclusion in labor markets—rates of economic growth, levels of segregation, public transportation infrastructure, political will, and Equal Employment Opportunity enforcement, to name a few. Considering contextual characteristics like these may shed new light patterns of Black exclusion that continue to diminish the quantity and quality of Black lives in the U.S.