
Abstract
Americans feel more stressed than ever, but data shows more free time and steadily high rates of happiness.
The portrait of the harried, overscheduled, and overstressed American family is familiar. Between soccer practice, piano lessons, and math tutors, today’s children are left with little “down time” to develop naturally. Meanwhile, their parents work long hours, provide a personal taxi service to their kids, and, when asked how they feel, a typical response is “swamped.” A growing cadre of bestselling books with titles like Overwhelmed, Maxed Out, and Busier Than Ever tells the story of overcommitted, stressed out Americans. But how much do typical Americans themselves actually agree with that stereotype?
If our time use seems less hectic, how do we explain the popular view that we’re suffering a national “time famine”?
So Where Does Our Time Go?
In 1965, the noted Hungarian mathematician Alexander Szalai pioneered a 12-nation “time-diary” project to measure things that people actually do with their time. A quick perusal of these diaries revealed that Americans were distinctive in several respects—we did less housework but spent more time shopping. We spent less time sleeping and eating, but more time on religion. Altogether, we had a bit more “free time”, particularly for two activities that separated the U.S. from our European counterparts—namely greater time spent socializing and even more time spent watching television. By 1965 U.S. TV (barely a decade since its inception) had already captured a third of the 35 weekly hours of the 168 hours diary analysts classified as “free time.”
When we were able to repeat these studies a decade later, we were surprised to find that by 1975 the U.S. lead in these activities had shrunk, mainly because people in other countries now had more TV sets and also socialized more often. But the U.S. had changed as well. Included in that American 1975 shift was a 5-hour weekly increase in TV time, which meant that TV was now capturing nearly 40% of our free time. (Closer analyses of these 1965-75 changes suggest that the increase was not due to increased numbers of channels or longer broadcast days but to the enhanced picture quality of newer color TV sets).
Martha Soukup, Flickr CC
Fast-forward four decades: our latest 2014 time-diary shifts have been far less dramatic, continuing to move in a parallel less-hectic direction. Now collected officially by the U.S. Census Bureau in its Americans Time-U.S. Survey (ATUS), the data are now comprised of more than 150,000 respondent diaries. These document a further increase in people’s free time, mainly reflecting more than an hour of increased TV time (TV now appears to consume more than 50% of our free time). Along with that increase in viewing is another ATUS indicator of a less hectic society, namely another hour of increased sleep time.
While it is plausible to link such surprising time trends to the Great Recession’s employment dips and an aging population sometimes forced into earlier retirements, much of the same conclusion is supported within our working-age population of those aged 18-64: more sleep and more TV in more free time.
Feeling More Stressed?
If our time use seems less hectic, how do we explain the popular view that we’re suffering a national “time famine”? It’s possible that we perceive ourselves as busy even as our schedules become less hectic. To test this mismatch between peoples’ behaviors and attitudes, our initial 1965 time-diary study included some questions on perceptions of time, in terms of whether our respondents felt “rushed” or had unwanted time on their hands. Between 1965 and 2004, public responses to these attitude questions did show an increase in the more rushed or stressed direction—and countered their more “objective” time-diary accounts registering more TV and more free time.
When we repeated these 1965 questions in the General Social Survey (GSS) (the leading monitor of U.S. social trends) in 2010, we were startled to find that “rushed” responses were 5-7 points lower than in 2004. Moreover, that decrease was also found in a separate 2009 academic survey of the same questions. This was not due to more unemployed respondents in these surveys, since employed respondents were actually reporting a decrease in feeling rushed and not having unwanted time. The trend is in Figure 1.
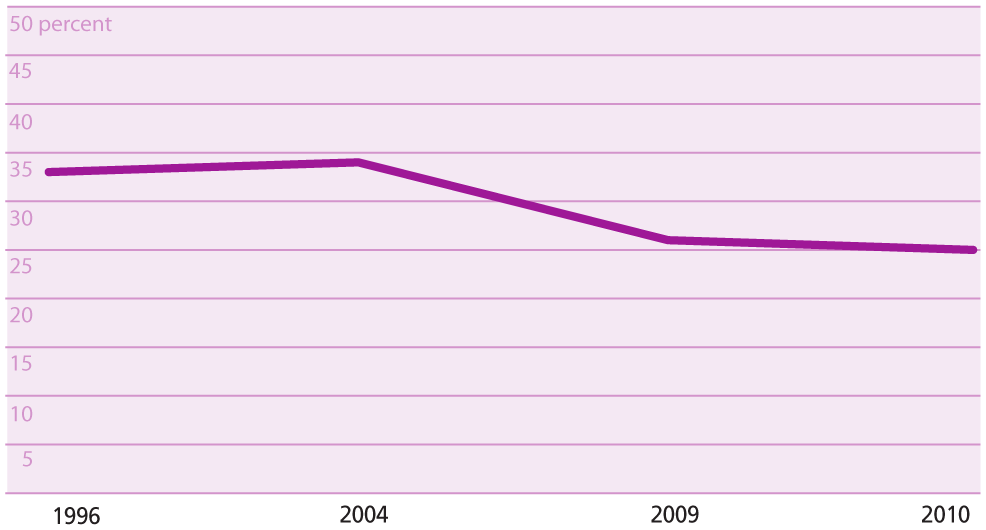
Always rushed, ages 18-64, 1996-2010
We have found parallel declines in the few surveys that have been consistently tracking stress with national probability samples. For example, the GSS has asked respondents about stress at their workplace since 1989, and Figure 2 shows a decline in work stress since 2000. In addition, the American Psychological Association (APA) has initiated its own useful studies of stress in the population. Although based on self-selected Internet samples (which might attract more stressed members of the public), their trends in Figure 3 are also moving in a less-stressed direction, despite the APA’s ultimate interest in helping to reduce public stress—and despite these APA respondents’ feeding into the popular perception by reporting (to a separate perception question) that their own stress levels had increased. To look at a biological metric, we note that researchers at the National Institutes of Health (NIH) have reported no increase in the public’s blood pressure levels between 1998 and 2008 (or in more recent years).
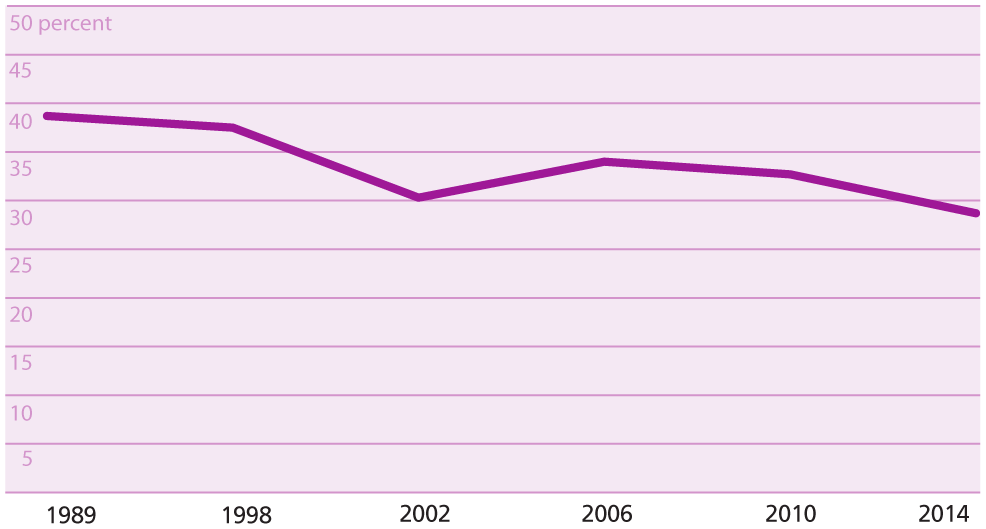
Stressed at work, ages 18-64, 1989-2014
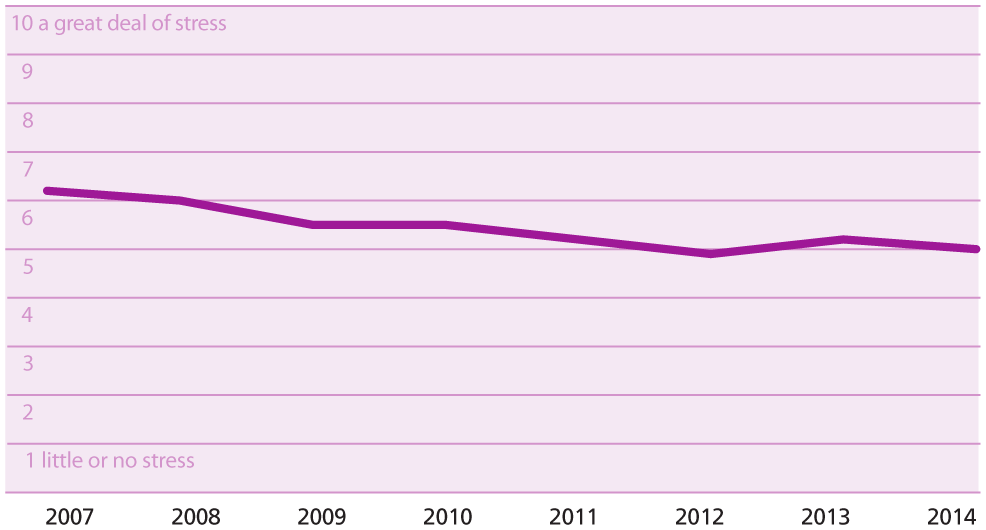
Stress levels reported by APA, 2007-2014
So, the conventional wisdom tells us that at least everybody feels that they’re “running out of time.” Some, like Craig Lambert in Shadow Work, lay the blame on smartphones and apps that allow us to do inadvertent “work” away from the office. Another best-seller, Overwhelmed by Bridget Schulte, points to the unique burdens placed on women through time-deprived modern motherhood. This time famine is undoubtedly the fate of many Americans (and who would challenge anyone who claims that they’re “too busy” or “don’t have time”?), especially working parents of young children.
It seems we may actually have precious time on our hands to help and share with the less time-fortunate.
For the rest of us, it seems more of a verbal badge of honor. After all, if we have more time for sleep or TV, it seems we may actually have precious time on our hands to help and share with the less time-fortunate. Ironically, perhaps the largest relative decline in the ATUS since 2003 has been in the weekly hour or so we spend helping people who live in other households—a prime indicator of how much time Americans commit to charitable work and volunteerism.
Along with the decrease in feeling rushed or stressed, this shift is what many social observers consider the gold standard of subjective measure of quality of life: the public’s level of happiness. As results from the GSS show, happiness has remained at about the same stubborn 32% since the 1960s. It took a nosedive to almost its lowest recorded level (28%) in the midst of the Great Recession in 2010, but it has since rebounded. That 32% statistic is perhaps the best indicator yet that our lives aren’t quite as hectic as we seem to believe.