
Abstract
Background:
Clinical glioblastoma treatment mostly focuses on the contrast-enhancing tumor mass. Amino acid positron emission tomography (PET) can detect additional, nonenhancing glioblastoma-infiltrated brain regions that are difficult to distinguish on conventional magnetic resonance imaging (MRI). We combined MRI with perfusion imaging and amino acid PET to evaluate such nonenhancing glioblastoma regions.
Methods:
Structural MRI, relative cerebral blood volume (rCBV) maps from perfusion MRI, and α-[11C]-methyl-
Results:
Thirteen (65%) tumors showed robust heterogeneity in nonenhancing T2/FLAIR hyperintense areas on AMT-PET, whereas the nonenhancing regions in the remaining 7 cases had homogeneous AMT uptake (low in 6, high in 1). AMT and rCBV T/N ratios showed only a moderate correlation in the nonenhancing regions (r = 0.41, P = .017), but regions with very low rCBV (<0.79 T/N ratio) had invariably low AMT uptake.
Conclusions:
The findings demonstrate the metabolic and perfusion heterogeneity of nonenhancing T2/FLAIR hyperintense glioblastoma regions. Amino acid PET imaging of such regions can detect glioma-infiltrated brain for treatment targeting; however, very low rCBV values outside the contrast-enhancing tumor mass make increased AMT uptake in nonenhancing glioblastoma regions unlikely.
Introduction
Glioblastomas are the most common primary malignant brain tumors in adults with a bleak 15-month overall survival, despite aggressive multimodal treatment. 1,2 Isocitrate dehydrogenase-1 (IDH1) wild-type (primary) glioblastomas have even worse prognosis. 3 The diagnosis, treatment planning, and follow-up of glioblastomas are mostly based on conventional magnetic resonance imaging (MRI) characteristics, including T1-weighted gadolinium-enhanced (T1-Gad), T2-weighted, and fluid-attenuated inversion recovery (FLAIR) sequences. 4 The contrast-enhancing tumor mass is the primary target of glioblastoma treatment, including resective surgery and fractionated radiotherapy. 4 However, glioblastomas are highly infiltrative with tumor cells extending well beyond the contrast-enhancing tumor mass. Glioma-infiltrated nonenhancing regions commonly show high signal intensity on T2/FLAIR sequences but cannot be differentiated accurately from pure vasogenic edema that shows similar signal changes on MRI. 5 Therefore, nonenhancing glioblastoma-infiltrated regions are difficult to detect, and they may be undertreated. On posttreatment MRI, progressive contrast enhancement can indicate glioblastoma progression or radiation injury, 6 but these 2 pathologies (which can coexist) are difficult to differentiate by conventional MRI.
Advanced imaging techniques, such as perfusion-weighted imaging (PWI) and positron emission tomography (PET), can improve detection of high-grade gliomas and their differentiation from nontumorous lesions, edema, or therapy-related changes.
6
Amino acid PET is increasingly used in the evaluation of newly diagnosed and recurrent gliomas.
7
Commonly used amino acid PET tracers,
8
-14
including α-[11C]-methyl-
Although amino acid PET is able to detect nonenhancing tumor portions in high-grade gliomas, this modality is not widely available and remains expensive. Perfusion MRI is more readily available, as the additional sequence can be easily incorporated as part of a clinical/diagnostic MRI acquisition. Previous studies comparing tumoral amino acid uptake and relative cerebral blood volume (rCBV; reviewed in Filss et al 25 ) showed variable results. While some investigators found a good concordance between the 2 imaging modalities, 8,9 others reported poor spatial overlap between high rCBV and increased amino acid uptake in gliomas. 11,12 However, these studies mostly focused on contrast-enhancing or high-perfusion tumor regions, while the critical nonenhancing glioma-infiltrated areas were not assessed.
In this multimodal imaging study, the main goal was to evaluate how well rCBV obtained from perfusion MRI can identify nonenhancing tumor-infiltrated regions as defined by AMT-PET. We tested this in both newly diagnosed and recurrent glioblastomas and explored if low rCBV values in nonenhancing tumor regions can predict low amino acid uptake values, thus indicating the lack of robust tumor infiltration for treatment targeting.
Materials and Methods
Patients
Twenty patients (13 males; mean age: 58 years, range: 28-79 years) with histologically verified IDH1 wild-type glioblastoma who underwent multimodal neuroimaging, including MRI with PWI and AMT-PET, were included in the study (Table 1). Ten patients with newly diagnosed glioblastoma completed pretreatment AMT-PET imaging followed by tumor resection and histopathological analysis. The other 10 patients had a history of glioblastoma resection followed by standard chemoradiation 26 and underwent AMT-PET scanning after suspected tumor progression based on radiographic worsening on MRI as defined by the RANO criteria. 27 None of the patients received antiangiogenic treatment before AMT-PET and perfusion MRI. In the 10 patients with posttreatment recurrent glioblastoma, all contrast-enhancing lesions showed high AMT uptake consistent with tumor progression based on our previous study. 28 Recurrent tumor was also verified histopathologically from a second resective surgery following the AMT-PET in 3 cases and by post-PET clinical and serial MRI follow-up in the remaining 7 patients. Key prognostic glioblastoma markers were evaluated from the initial surgery both in the newly diagnosed and the recurrent tumors. All glioblastomas were IDH wild type; 6 tumors showed O-6-methylguanine-DNA methyltransferase (MGMT) promoter hypermethylation, 11 cases were unmethylated, and 3 had unknown MGMT methylation status. The study was approved by the Wayne State University Institutional Review Board, and written informed consent was obtained from all study participants.
Clinical Data and Imaging Results of the 20 Patients With Glioblastoma.

Abbreviations: AMT, α-[11C]-methyl-
Magnetic Resonance Imaging Acquisition
Diagnostic MRIs were performed on a Philips Achieva TX 3.0 T scanner (Philips Medical Systems Inc, Da Best, The Netherlands). T1, T2, and FLAIR images were acquired followed by postcontrast PWI and T1. The MRIs closest in time to the AMT-PET (mean time interval: 3 ± 4 days) were used for co-registration and analysis. For PWI, a PRESTO sequence 29 (dynamic T2*-weighted 3-dimensional gradient-echo echo-planar imaging [EPI] with echo shifting and compressed Sensitivity Encoding [SENSE], with 3.5 mm slice thickness, 0 gap, 3.0 mm × 3.0 mm × 3.5 mm voxel size, 240 mm field of view, 80 × 56 acquisition matrix, 17 milliseconds repetition time, 25 milliseconds echo time, flip angle 7°, EPI factor 19, SENSE factor 1.5, 60 dynamic scans at 1.7 seconds each) was acquired after injection of a gadolinium-based contrast agent (0.2 mL/kg gadobenate dimeglumine or 0.1 mL/kg gadobutrol). The acquired images were postprocessed on a Philips Extended MR Workspace 2.6.3.2 utilizing Neuroperfusion software to generate rCBV maps that had been used for both clinical image interpretation and regional analysis along with the PET images for this study.
α-[11C]-methyl-l -Tryptophan Positron Emission Tomography Scanning Protocol
All PET studies were performed using a GE Discovery STE PET/CT scanner (GE Medical Systems, Milwaukee, Wisconsin) at the PET Center, Children’s Hospital of Michigan, Detroit Medical Center. The PET image in-plane resolution was 7.5 ± 0.4 mm at full-width half-maximum (FWHM) and 7.0 ± 0.5 mm FWHM in the axial direction and a slice thickness of 3.125 mm. The procedure for AMT-PET scanning has been described previously. 13,28,30 -32 In brief, after 6 hours of fasting, a slow bolus of AMT (37 MBq/kg) was injected via a venous line. At 25 minutes after AMT injection, a dynamic emission scan of the brain (7× 5 minutes) was acquired. Measured attenuation correction, scatter, and decay correction were applied to all PET images. For measurement of AMT uptake, averaged activity images 30 to 55 minutes postinjection were created and converted to an AMT standardized uptake value (SUV) image.
Multimodal Image Analysis
First, the AMT-PET, T2/FLAIR images, and rCBV maps were registered to the axial T1-Gad images using the semiautomatic registration tool of the AMIDE software (A Medical Image Data Examiner, version 1.0.4), 33 performing linear registration including shifts and rotations. Additional minor manual correction was performed if needed, especially in cases where PET contours were not perfectly aligned with MRI, likely due to the low background brain activity on the PET images.
For multimodal image analysis, noncontrast-enhancing T2/FLAIR hyperintense regions surrounding the contrast-enhancing tumor mass were delineated; in 1 patient (#5), the entire tumor mass was nonenhancing. These nonenhancing regions were classified as having homogeneous versus heterogeneous AMT uptake. For homogeneous regions, a single oval-shaped region of interest (ROI) was placed in the center of the T2/FLAIR hyperintense region in at least 2 consecutive axial planes to measure AMT SUV and rCBV on the co-registered PET images and rCBV maps, respectively. In tumors with heterogeneous nonenhancing T2/FLAIR hyperintense regions, 2 separate, nonoverlapping ROIs were placed: one centered over the region with high AMT SUV (“hot spot” with suspected tumor infiltration) and another one with low AMT uptake (consistent with vasogenic edema; Figure 1), again, in at least 2 consecutive axial image planes. Regions of interest belonging to the same region were averaged to create a volume of interest (mean VOI volume: 406 ± 253 mm3). In the presumed tumor regions with high AMT uptake, ROI size was adjusted to encompass the area with voxels exceeding the 1.36 cutoff threshold; this was sometimes smaller (as illustrated in Figure 1) and in other cases larger than the low-uptake ROI, this contributed to size variability of the ROIs. Regions of interest of similar shape and size were placed in the contralateral normal cortex, localized to the same lobe as the main tumor mass and adjusted to the cortical contours (visualized on the co-registered MRI), and mean voxel values of the created VOIs were used to calculate AMT tumor/normal [T/N] cortex uptake ratios. The AMT T/N ratios in all VOIs from “hot spots” exceeded a 1.36 threshold, thus supporting that they are in tumor-infiltrated nonenhancing areas as defined by histopathological comparison in our previous study. 14 For defining control regions for rCBV, white matter was used for normalization in order to be consistent with previous studies. 8,9,34,35 Oval ROIs were placed on the normal-appearing contralateral white matter focused on the lobe(s) homotopic to the tumor locations, and mean voxel values were calculated to create rCBV T/N white matter ratios. All ROIs were carefully placed to avoid bony structures, ventricles, areas of necrosis, and suspected artifacts.
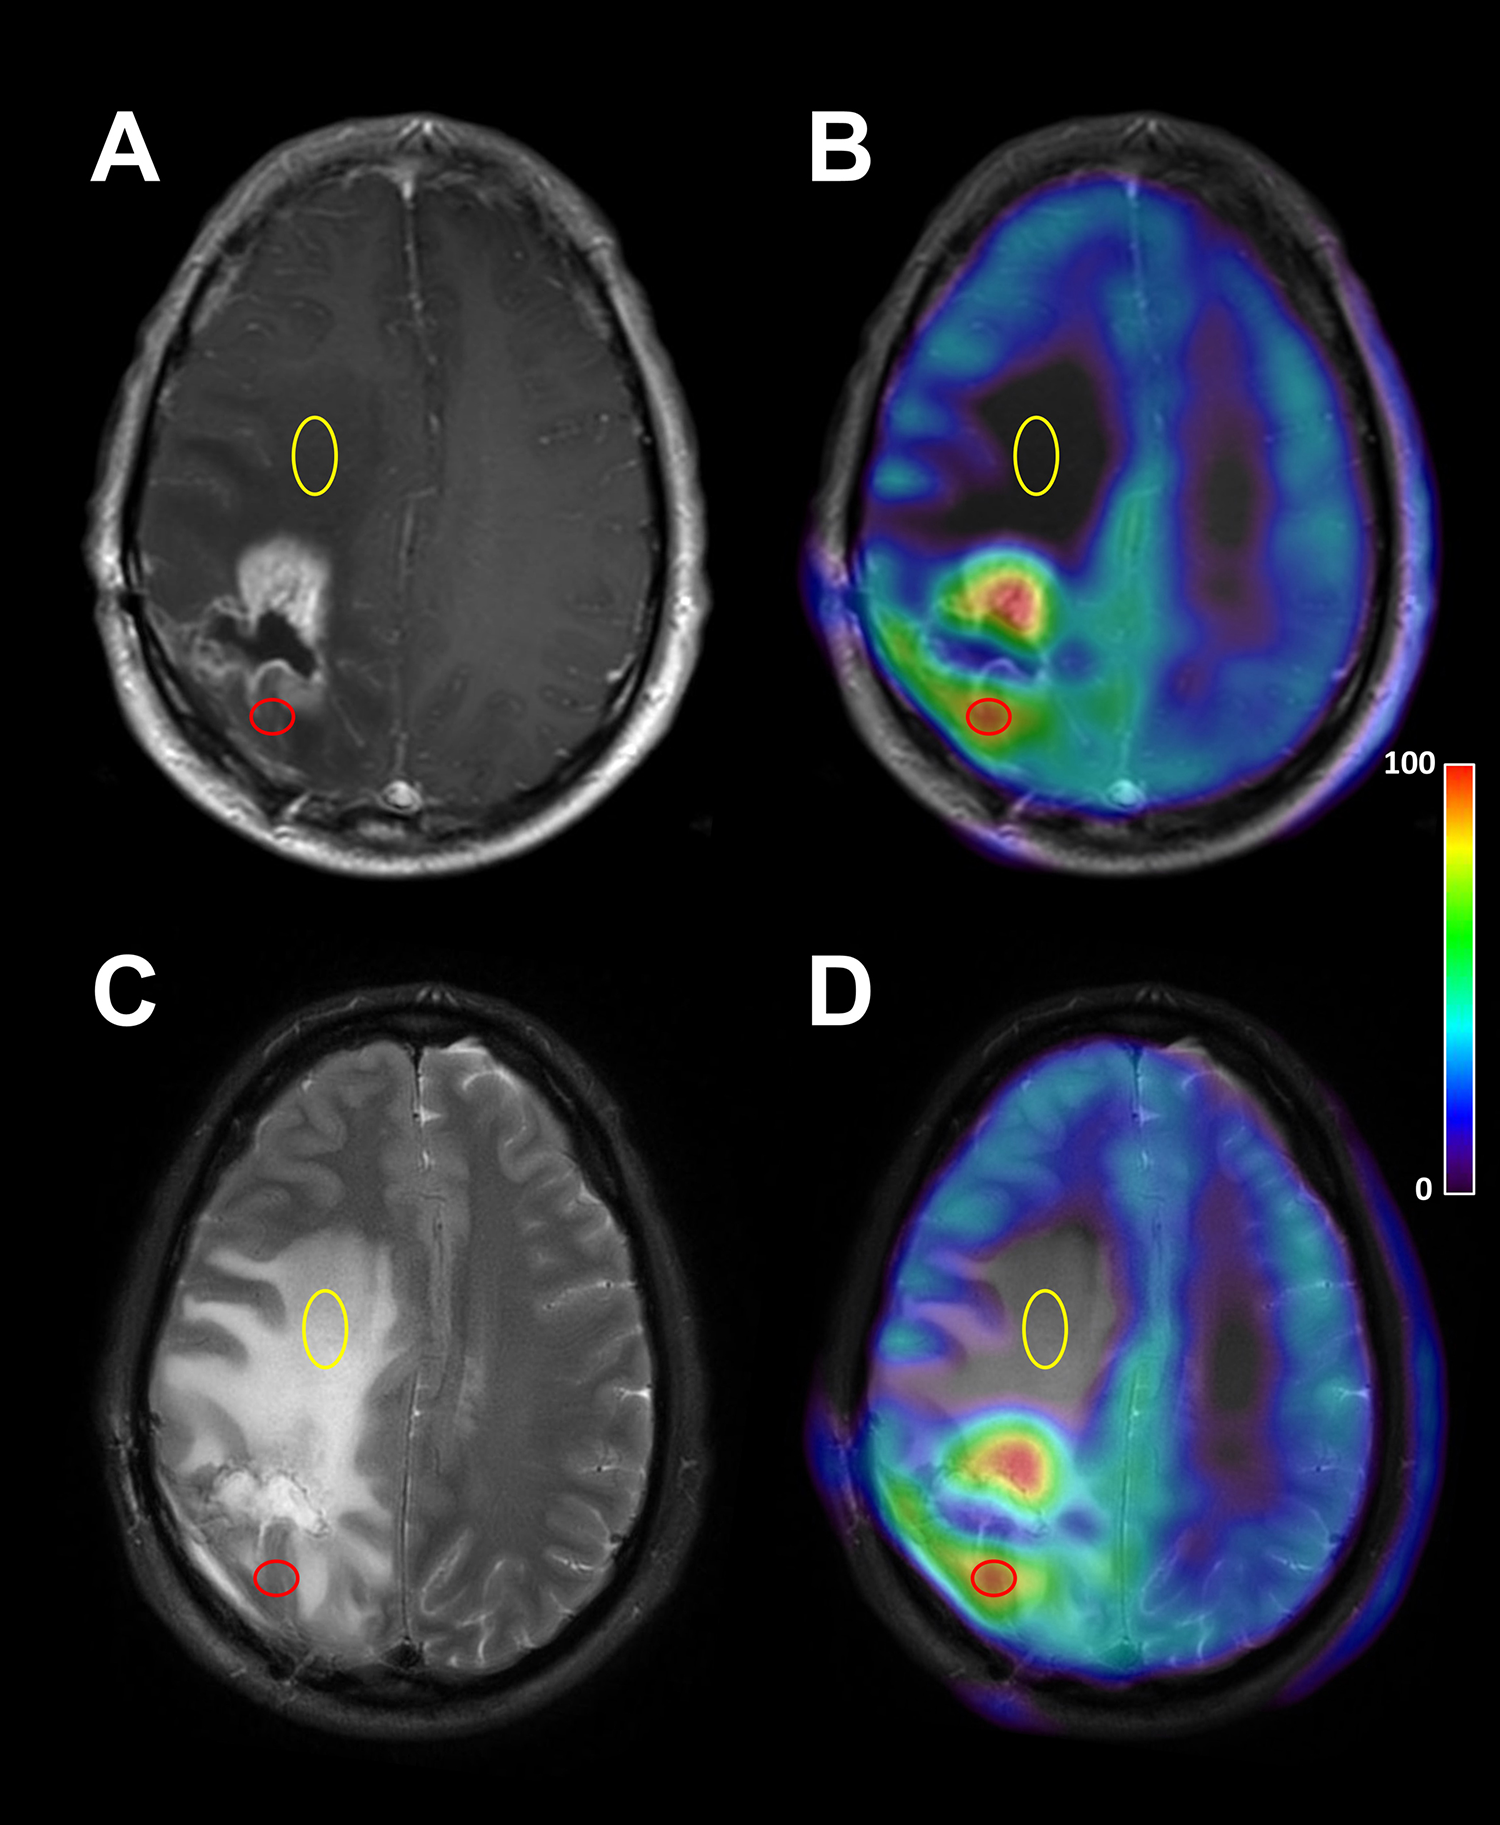
Peritumoral nonenhancing region with heterogeneous α-[11C]-methyl-
Statistical Analysis
Regional rCBV and AMT T/N ratios obtained from the same VOIs were correlated using Spearman rank correlation both in the whole group and subgroups (newly diagnosed and recurrent tumors; high and low AMT-uptake regions). Relative CBV T/N ratios between high and low AMT uptake regions of the 13 heterogeneous tumors were compared using the Wilcoxon signed-rank test. All statistical analyses were carried out using SPSS Statistics 24.0 software (IBM Corp, Armonk, New York). A P value <.05 was considered to be significant.
Results
α-[11C]-methyl-l -Tryptophan Uptake in Nonenhancing Tumor Regions
Thirteen (65%) tumors showed a robust heterogeneity in nonenhancing T2/FLAIR hyperintense tumor areas on AMT-PET suggesting the presence of both tumor-infiltrated and vasogenic (nontumorous) edema (with separate VOIs evaluated in each of these 2 regions); the remaining 7 patients showed homogeneous AMT uptake in the nonenhancing regions (one VOI evaluated in each) (Table 1). Of the 7 homogeneous T2/FLAIR hyperintense regions, AMT T/N ratios were high (exceeding the 1.36 threshold indicating glioma infiltration) in one tumor (patient #9, T/N ratio: 3.01) and were low (<1.36 threshold) in the remaining 6 cases (range: 0.59-1.01), indicating vasogenic edema. In the other 13 tumors with heterogeneous nonenhancing T2/FLAIR hyperintense regions, AMT T/N ratios in the “hot” uptake regions ranged between 1.57 and 3.31 (mean: 2.36 ± 0.55), while the regions with low AMT uptake in the same tumors had values ranging between 0.50 and 1.26 (mean: 0.77 ± 0.22).
Correlations Between AMT and rCBV T/N Ratios
In the whole set of nonenhancing T2/FLAIR hyperintense tumor regions, a moderate positive correlation was found between AMT and rCBV T/N ratios (r = 0.41, P = .017, Figure 2). Inspection of the scatter plot indicated that rCBV T/N ratios below 0.79 were all associated with low AMT uptake (≤1.0), consistent with vasogenic edema (Figure 2). In contrast, in regions with rCBV T/N ratios ≥0.79, the AMT T/N ratios were highly variable, ranging from very low (<0.6) to very high (>3.0) values, with no association between rCBV and AMT T/N ratios (Figure 3). When recurrent tumors were analyzed separately, this rCBV T/N ratio cutoff value was higher (1.16). AMT and rCBV T/N ratios showed a moderate correlation only in the low AMT regions (n = 19, r = 0.47, P = .043) but not in the high AMT regions (n = 14, r = −0.15, P = .62).
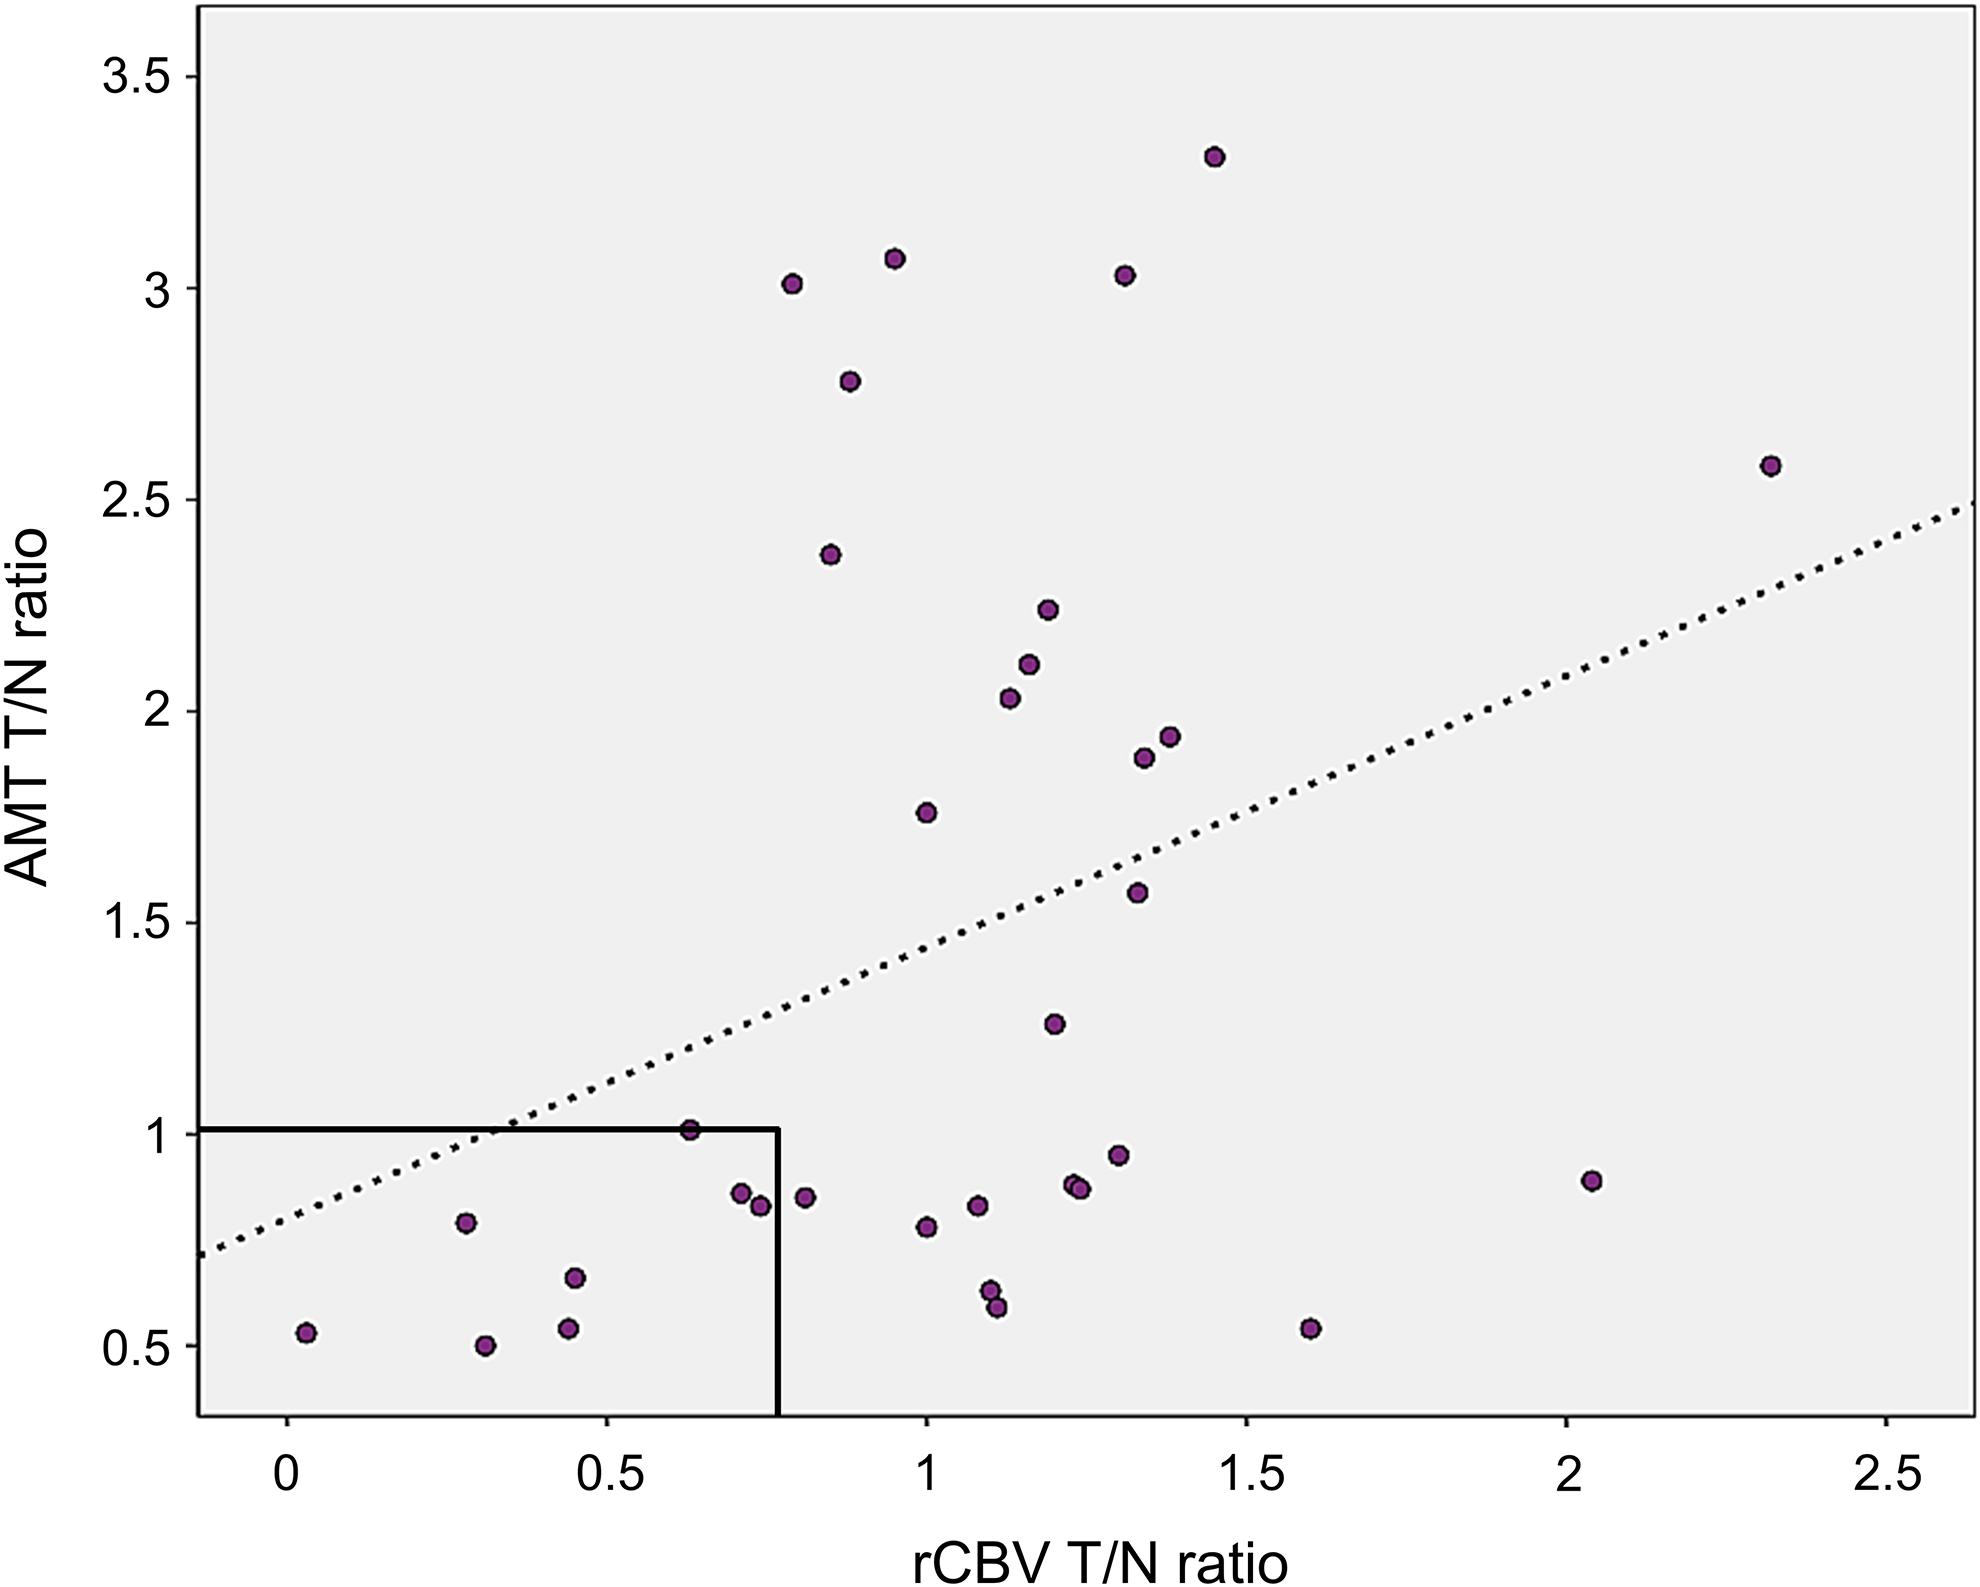
Moderate positive correlation between α-[11C]-methyl-
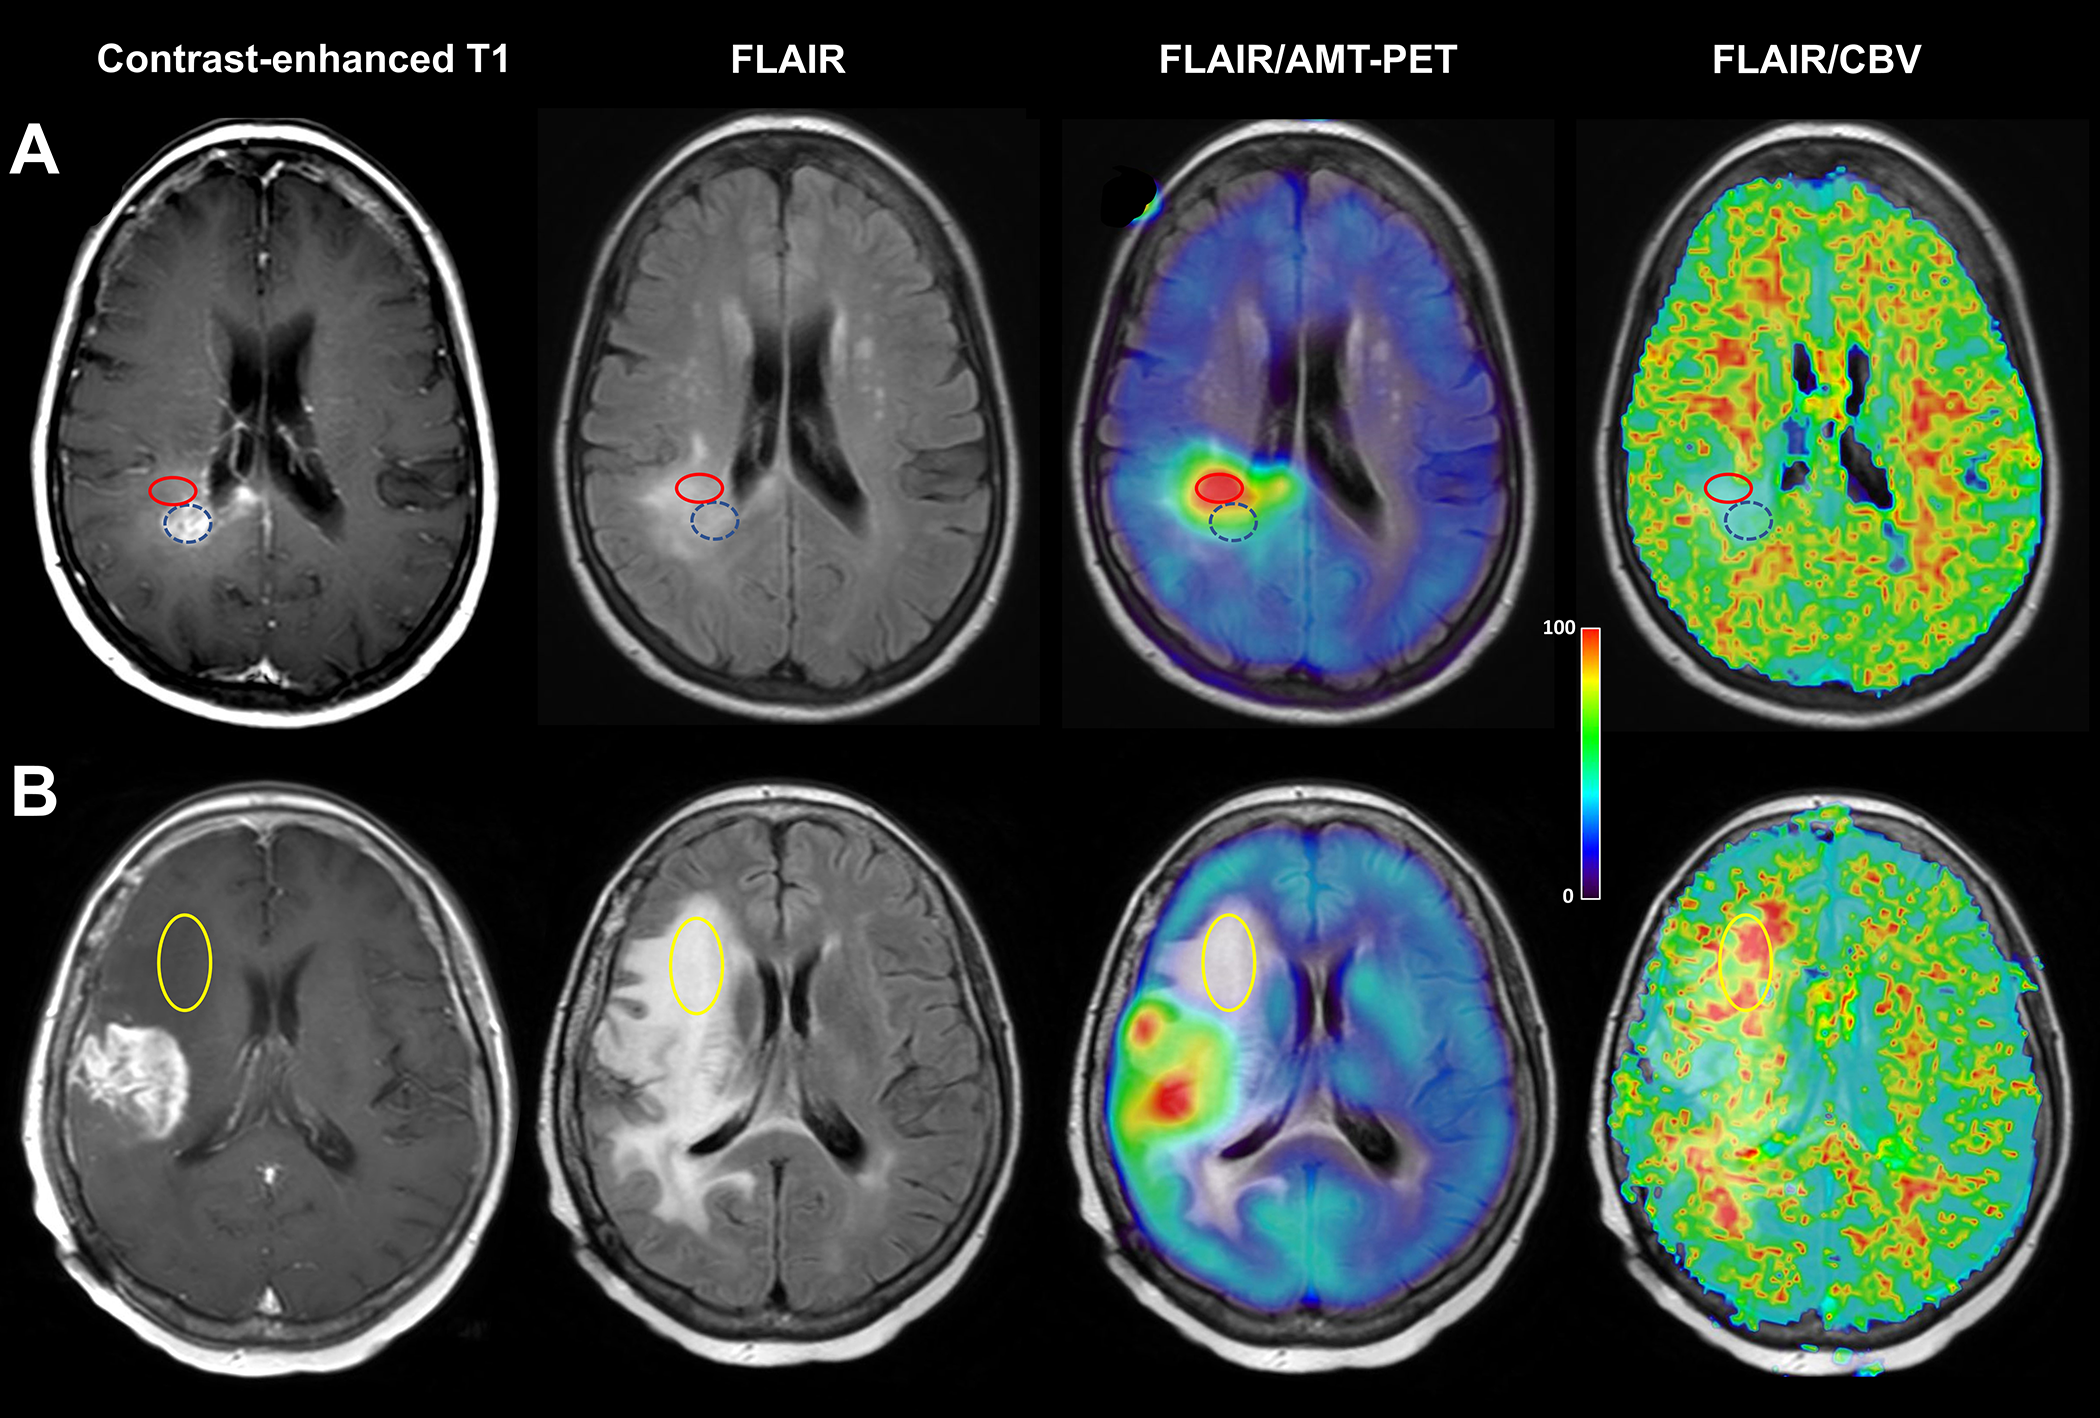
Examples of α-[11C]-methyl-
When newly diagnosed and recurrent tumors were analyzed separately in the whole set of regions, the correlation between AMT and rCBV T/N ratios was significant in the recurrent tumor group (r = 0.55, P = .034) but not in newly diagnosed glioblastomas (r = 0.23, P = .37).
Finally, in tumors where both high and low AMT uptake regions were present, rCBV T/N ratios were not different between these 2 types of regions in the whole patient group (mean: 1.25 ± 0.38 vs 0.91 ± 0.59, respectively, P = .12).
Discussion
Glioblastomas are highly infiltrative brain tumors with an almost invariable extension beyond the contrast-enhancing tumor mass. Insufficient pretreatment detection of such glioma-infiltrated brain regions may lead to an error in defining the optimal field of treatment (surgery and radiation). The present study demonstrates that such nonenhancing glioblastoma regions can show heterogeneous amino acid uptake with both high- and low-uptake areas, indicating a combination of tumor-infiltrated brain and vasogenic edema, respectively. Our previous studies demonstrated that high AMT uptake in nonenhancing glioma regions is a reliable indicator of tumor infiltration 14,24 and that nonresection of such regions can be a source of posttreatment glioblastoma progression. 24 On the other hand, low AMT uptake in nonenhancing T2/FLAIR hyperintense tumor regions strongly suggests vasogenic edema with no or minimal tumor cell infiltration. 14,24 In addition, the present study also demonstrates that very low rCBV values (below 0.79 in the present cohort) outside the contrast-enhancing tumor mass makes it unlikely that AMT-PET (and, possibly, other amino acid PET) would find high-uptake areas for treatment targeting. This finding may have high clinical value, as PWI is almost invariably done before PET imaging is being considered.
Some previous studies reported positive correlations between glioma perfusion, vascular density, and amino acid uptake,
8,36
-38
possibly because high tumoral perfusion may increase amino acid availability for transport from blood to tumor tissue. The moderate overall correlation between AMT uptake and rCBV values measured in the nonenhancing T2/FLAIR hyperintense brain regions in the present study suggests that high perfusion is not the main driver of increased tryptophan uptake in nonenhancing glioma-infiltrated areas. Some previous studies also suggested a poor spatial overlap between areas of high rCBV and high amino acid uptake.
10
-12
A recent O-2-[18F]-fluoroethyl-
Subgroup analysis of the low and high AMT uptake regions provided further clues regarding the perfusion/metabolic differences within nonenhancing glioblastoma regions. High AMT uptake regions were associated with a wide range of rCBV values, including those with low perfusion. Tryptophan accumulation in these nonenhancing tumor-infiltrated regions can be driven by at least 2 mechanisms: (1) upregulation of the LAT1 transporter and (2) increased tryptophan metabolism and trapping via the kynurenine pathway. Increased LAT1 expression has been demonstrated in nonenhancing low-grade gliomas and glioneuronal tumors that commonly show a moderate increase in AMT (and other amino acid tracer) uptake.
39
-41
Although stronger LAT1 expression was associated with higher methionine uptake on PET,
42
intensity of LAT1 expression was not sufficient to explain variations of 3,4-dihydroxy-6-18F-fluoro-
On the other hand, we found that very low rCBV (below a 0.79 T/N ratio or below 1.16 in recurrent tumors) in nonenhancing T2/FLAIR hyperintense tumor regions was invariably associated with low AMT uptake (typically below 1.0 T/N ratios). This finding indicates that such low rCBV values outside the contrast-enhancing tumor area are likely consistent with vasogenic edema without amino acid accumulation (excluding a nonspecific low uptake). In clinical practice, MRI with PWI is usually performed before deciding on PET imaging, and the detection of uniformly low rCBV values outside the contrast-enhancing mass may make it unlikely that amino acid PET would detect high uptake in the same region. Thus, the lack of above-threshold rCBV regions by perfusion MRI outside the contrast-enhancing tumor core may argue against performing amino acid PET in this subgroup of patients.
The observed moderate correlation between AMT and rCBV T/N ratios in low-uptake regions is also intriguing, and its reason can only be speculated. One possible mechanism is that, in such edematous, poorly perfused brain regions, both blood flow and radiotracer uptake values are limited by and related to the severity of edema. Nevertheless, the combination of low amino acid uptake and low rCBV appears to be a strong imaging marker correlating with the lack of major tumor infiltration, although neither imaging modalities (nor any other current neuroimaging approaches for that matter) can completely exclude the presence of scarce glioma cell infiltration in such regions.
Finally, we also found a few examples of high rCBV regions coupled with no contrast enhancement and low AMT uptake (see Figure 3B). One could speculate that such regions may represent tumor portions with increased microvessel density, perhaps due to neovascularization in the peritumoral tissue, yet before massive glioma cell infiltration has occurred in these areas. 45 Alternatively, such unexpected high perfusion values may represent errors in rCBV estimates.
Our study has several limitations, including the limited patient number and the lack of histopathological confirmation of the analyzed tumor regions. Indeed, it would take multimodal imaging-guided stereotactic tumor biopsies to determine whether the above hypotheses are true. However, previous studies provided solid evidence, including histopathological confirmation, that high amino acid (including AMT) uptake is a reliable imaging marker of glioma infiltration in nonenhancing tumor regions. 8,14,23 In addition, our MRI analyses relied on clinically acquired perfusion data, where rCBV maps were created by an Food and Drug Administration–approved software used for clinical perfusion studies. Perfusion acquisition and processing techniques in the literature are somewhat heterogeneous, and the field lacks standardized approaches for neuro-oncology imaging 46 ; comparison of various software packages have shown some dependency of rCBV values on bolus transit time for all algorithms. 47 Thus, the reproducibility and generalizability of any technique used for CBV analysis remain to be determined. Therefore, our results, similar to most other perfusion MRI studies, cannot be readily generalized to other studies, and the obtained cutoff threshold values may be different when using different perfusion acquisition or analytic protocols.
Conclusions
This study demonstrates the heterogeneity of nonenhancing T2/FLAIR hyperintense regions of newly diagnosed and recurrent glioblastomas on multimodal imaging. AMT-PET detected both tumor-infiltrated and vasogenic edema in the majority of tumors, but the uptake values showed only weak associations with rCBV measured in the same regions. However, areas with very low rCBV were invariably associated with low tryptophan uptake, indicative of vasogenic edema rather than active infiltrating tumor. Amino acid PET imaging of nonenhancing glioblastoma regions may be useful to evaluate glioma-infiltrated brain for treatment targeting, unless perfusion MRI shows very low rCBV values in such areas.
Footnotes
Acknowledgments
The authors thank William J. Kupsky, MD, who performed the clinical histopathology evaluation of the tumor specimens. The authors are grateful to the entire staff at the PET Center, Children’s Hospital of Michigan, Detroit Medical Center, who provided invaluable technical help in patient scheduling and performing the PET scans.
Declaration of Conflicting Interests
The author(s) declared no potential conflicts of interest with respect to the research, authorship, and/or publication of this article.
Funding
The author(s) disclosed receipt of the following financial support for the research, authorship, and/or publication of this article: This study was supported by grants from the National Cancer Institute (R01 CA123451 and P30 CA022453).