
Abstract
One-third of patients with heart disease develop heart failure, which is diagnosed through imaging and detection of circulating biomarkers. Imaging strategies reveal morphologic and functional changes but fall short of detecting molecular abnormalities that can lead to heart failure, and circulating biomarkers are not cardiac specific. Thus, there is critical need for biomarkers that are endogenous to myocardial tissues. The cardiac growth hormone secretagogue receptor 1a (GHSR1a), which binds the hormone ghrelin, is a potential biomarker for heart failure. We have synthesized and characterized a novel ghrelin peptidomimetic tracer, an 18F-labeled analogue of G-7039, for positron emission tomography (PET) imaging of cardiac GHSR1a. In vitro analysis showed enhanced serum stability compared to natural ghrelin and significantly increased cellular uptake in GHSR1a-expressing OVCAR cells. Biodistribution studies in mice showed that tissue uptake of the tracer was independent of circulating ghrelin levels, and there was negligible cardiac uptake and high uptake in the liver, intestines, and kidneys. Specificity of tracer uptake was assessed using ghsr −/− mice; both static and dynamic PET imaging revealed no difference in cardiac uptake, and there was no significant correlation between cardiac standardized uptake values and GHSR1a expression. Our study lays the groundwork for further refinement of peptidomimetic PET tracers targeting cardiac GHSR1a.
Introduction
While there are established clinical protocols to diagnose, monitor, and treat heart failure (HF), clinical imaging modalities such as chest radiography, echocardiography, and computed tomography (CT) largely report changes to anatomic structure and pathologic function in the heart, which occur after HF has developed. Circulating biomarkers, such as natriuretic peptide type B (BNP) and its N-terminal fragment, NT-proBNP, indicate myocardial injury and can be useful in predicting outcomes and guiding HF management with a simple blood test. 1 However, there may be discordance between tissue and circulating levels of these biomarkers. Molecular imaging of biomarkers expressed in the myocardium will enable insight into the metabolic and molecular changes that characterize the development and progression of cardiomyopathies prior to gross structural and physiologic abnormalities that characterize HF. 2
In the pursuit of discovering biomarkers for the detection and diagnosis HF, there is growing interest in the hormone ghrelin and its receptor, the growth hormone secretagogue receptor (GHSR1a). While GHSR1a is expressed in other organs such as the brain, anterior pituitary, pancreatic islets, the intestine, thyroid, and adipose tissue, it is now well established there is a ghrelin/GHSR1a system in the heart, which functions in cardiomyocyte survival, contractility, and metabolism. 3,4 In patients with heart failure, high plasma ghrelin concentrations can be linked to favorable outcomes in patients with HF, 5 and myocardial GHSR1a expression is dramatically elevated. 6 As such, cardiac GHS-R1a has the potential to be a powerful cardiac-localized biomarker for diagnosis and monitoring in patients with HF.
Our group has developed novel fluorescent imaging tools for the detection of GHSR1a in situ with microscopy by incorporating fluorescent dyes into the structure of a truncated analog of ghrelin containing an unnatural octanoyl linkage to improve its serum stability (Dpr3(octanoyl), Lys19(Cy5sulfo)]ghrelin(1-19) amide). We have used these tools to detect changes in GHSR1a during cardiomyocyte differentiation 7 and the development of diabetic cardiomyopathy in mice. 8 Previous work from our group has shown that the structure of ghrelin can also be highly modified to accommodate radionuclide imaging agents for single-photon emission computerized tomography (SPECT) or PET with high affinity to GHSR1a. 9 -11 We have now developed third-generation ghrelin analogs from the structure of growth hormone secretagogues (GHS), a class of low-molecular-weight peptidomimetics with vastly improved in vivo stability that bind to the GHSR1a with high affinity. These highly stable small molecules can also be modified to contain 18F and represent an alternate class of reagents for PET, compared to other small molecules designed to be labeled with 68Ga 12 or 11C 13 or with the 18F-labeled peptide, ghrelin(1-8). 10 Our lead candidate, [1-Nal4, Lys5(4-[18F]-FB)]G-7039, was determined to have an half-maximal inhibitory concentration (IC50) of 69 nmol/L and an half-maximal effective concentration (EC50) of 1.1 nmol/L, 14 indicating a high receptor binding affinity and agonist activity. In this study, we characterized its specificity and sensitivity for imaging myocardial GHSR1a.
Materials and Methods
Radiosynthesis of [1-Nal4, Lys5(4-[18F]-FB)]G-7039
All the reagents and solvents used for radiosynthesis were purchased from Sigma-Aldrich (St Louis, Missouri) unless otherwise stated. Synthesis of [1-Nal4, Lys5(4-[18F]-FB)]G-7039 was performed as described previously. 14 18F-fluoride was produced via the 18O(p, n) 18F reaction in a GE PETtrace 880 cyclotron at the Lawson Health Research Institute. A Waters high-performance liquid chromatography (HPLC, Waters Co. Milford MA, USA) with 2 detectors (Waters 2487 Dual λ absorbance detector set at 254 nm and a radioactive flow count detector) was used for product analysis and purification using a Waters 1525 binary pump system, Waters Co, Milford MA, USA (acetonitrile as solvent A and H2O as solvent B). Analytical column (Agilent Eclipse XDB-C18, 4.6 × 150 mm, 5 μm, Agilent Technologies Inc, Santa Clara CA, USA) was used for the calculation of radiochemical purity and specific activity of [1-Nal4, Lys5(4-[18F]-FB)]G-7039 using solvent A/B containing 0.1% TFA as mobile phase with a gradient of 45%/55% to 55%/45%(v/v) at 0 to 10 minutes at a flow rate of 1.5 mL/min. The semipreparative column (Agilent Zorbax SB-C18, 9.4 × 150 mm, 5 μm, Agilent Technologies Inc, Santa Clara CA, USA) was used for purification of [18F]SFB and [1-Nal4, Lys5(4-[18F]-FB)]G-7039. The HPLC conditions were as follows: (1) for [18F]SFB purification, using solvent A/B of 36%/64%(v/v) as mobile phase at a flow rate of 4 mL/min; (2) for the purification of [1-Nal4, Lys5(4-[18F]-FB)]G-7039, using solvent A/B containing 0.1% TFA as mobile phase with gradient of 40%/60% to 50%/50%(v/v), at 0 to 15 minutes; 50%/50%(v/v) at 15 to 20 minutes at a flow rate of 4 mL/min.
As described in Figure 1, [18F]FBA was prepared on the GE tracer lab FXN. Aqueous [18F]fluoride solution was trapped on the Sep-Pak Accell plus carbonated QMA light cartridge, Waters Co. Milford MA, USA. One mL of acetonitrile/H2O (80%/20%; v/v) solution containing potassium carbonate (1 mg) and kryptofix 2.2.2 (7 mg) was used to elute [18F]fluoride into the reaction vial (Figure 1Ai). The solvent was removed azeotropically in vacuum under a helium flow at 75°C. [18F]fluoride was dried twice by adding 1 mL of anhydrous acetonitrile, respectively, under the abovementioned conditions. Five hundred μL of anhydrous dimethyl sulfoxide (DMSO) containing 5 mg of 4-(tert-butoxycarbonyl)-N, N, N-trimethylbenzenammonium triflate salt was added into dried [18F]F under helium atmosphere (Figure 1Aii). The reaction vial was sealed and heated at 120°C for 8 minutes. The reaction mixture was cooled down to 40°C, and 1 mL of 5 mol/L HCl was added to reaction vial. The reaction mixture was heated for 3 minutes at 100°C for hydrolysis of esters and then cooled down to 40°C. The reaction mixture was diluted with 2.5 mL of H2O, and the product was trapped on a Sep-Pak C18 light cartridge (Waters) and washed with 0.5 mL of H2O. The product was then eluted with 2.5 mL anhydrous acetonitrile and passed through a drying cartridge filled with anhydrous Na2SO4 to provide [18F]FBA.

Radiosynthesis of [1-Nal4, Lys5(4-[18F]-FB)]G-7039. Reagents and conditions: (A) (i) 18F-, K2CO3, Krypofix 222, DMSO, 120°C, 8 minutes, (ii) HCl (5 mol/L), 100°C, 3 minutes; (B) NHS, EDC, acetonitrile, RT, 15 minutes; (C) DIPEA, acetonitrile/h2O, 85°C, 15 minutes.
The solution of [18F]FBA in 1 mL of acetonitrile was added into a vial containing 20 mg NHS (N-hydroxysuccinimide) and 50 mg 1-ethyl-3-(3-dimethylaminopropyl)carbodiimide (EDC). The reaction was performed at room temperature for 8 minutes, and then an additional 50 mg of EDC was added. The solvent was removed in a V-10 evaporator (Biotage Inc, Uppsala, Sweden) after additional 7 minutes. One mL of 36% acetonitrile/H2O mixture was added into the reaction vial. The raw product was purified on semipreparative HPLC column. The solvent was removed on a V-10 evaporator to provide dried [18F]SFB (radiochemical purity >99%).
A solution of 1 mg of [1-Nal4]G-7039 in 500 μL acetonitrile and 100 μL H2O was added into the abovementioned [18F]SFB vial, followed by the addition of 5 μL DIPEA (N, N-diisopropylethylamine; Figure 1c). The reaction mixture was heated at 85°C for 15 minutes, and 500 μL H2O was added into reaction vial after cooling down to room temperature. The reaction mixture was purified by directly injecting onto a C18 semipreparative column (with guard column attached) to get [1-Nal4, Lys5(4-[18F]-FB)]G-7039 with a decay-corrected radiochemical yield of 39%, radiochemical purity ≥ 99%, and a molar activity of > 4.7 GBq/μmol after 81 minutes.
Serum Stability
[1-Nal4, Lys5(4-[18F]-FB)]G-7039 (1 mmol/L final concentration) was incubated in a mixture of 25% human serum (Sigma-Aldrich; Male type AB cat# H4522) in phosphate buffered solution (PBS; pH 7.4, 450 µL final volume, DMSO final concentration 0.5%) at 37°C. This concentration of human serum was chosen based on standard protocols observed in the literature and ease of peptide extraction. 15 At 20, 60, 240, 420, and 1440 minutes after incubation, aliquots of peptide solution were removed and mixed with either acidic solution (4% phosphoric acid, pH 1-2) or basic solution (4% ammonium hydroxide, pH 11-13) to dissociate peptide interactions with components of human serum. Peptide was isolated from human serum by column separation on Oasis sorbent 96-well Elution plates, Waters Co, Milford MA, USA (HLB- amphiphilic resin and MCX-cation exchange resin) and manifold. The extracted peptide was quantified on an Acquity UHPLC-MS system, Waters Co, Milford MA, USA. Peptide was quantified by measuring the peak area of a peptide-specific M+n ion peak and averaged over 3 replicates. Percentage of abundance of peptide peak area relative to abundance at T0 was plotted as a function of time. Peptide half-life was calculated by optimized curve fitting (linear, 2-parameter, or 3-parameter exponential decay curve) on SigmaPlot v.12 and solving for time at 50% peptide peak abundance.
Cell Uptake
Both wild-type (wt) OVCAR8 cells (courtesy of Dr Trevor Shepherd, Western University, London, Canada) and OVCAR8 cells stably transfected with GHSR1a (OVCAR8/GHSR1a) were grown in RPMI containing 10% fetal bovine serum. Prior to uptake experiments, cells were plated in 6-well plates at a cell density of 5 × 10⁵ cells/well. The cells were incubated for 48 hours, after which media were removed and cells were rinsed 3 times with warm PBS. Cells were then incubated in PBS containing 0.1 to 0.5 MBq [1-Nal4, Lys5(4-[18F]-FB)]G-7039 in 100% ethanol (final ethanol concentration of ≤ 1%). After 20- and 60-minute incubation periods, media were removed, and the cells were washed 3 times with warm PBS and detached from the plate with 0.5 mol/L EDTA (pH 8). Activities in both media and cells were counted in a high-purity Ge gamma counter as described previously. 16 The radioactivity was calculated in becquerels (Bq) and decay corrected to the time of incubation with the probe. Probe uptake was calculated as a percentage relative to incubated dose (%ID).
Mice
All mice were treated in accordance with ethical guidelines set by the Canadian Council on Animal Care (CCAC). Animal protocol #2015-041 was approved by the Animal Use Subcommittee at Western University (Western University) for the experiments described herein.
For biodistribution studies, female C57BL/6 mice were obtained from Charles River Laboratories (Wilmington, Massachusetts) at 7 to 9 weeks of age and euthanized between 8 to 18 weeks. For imaging studies, we used both male and female ghsr−/− mice (a kind gift from Dr. Alfonso Abizaid, Carleton University, Ottawa, Ontario, Canada) 17 and wt littermates at 16 to 23 weeks of age. All mice were fed a diet of standard rodent chow and water and group housed in a temperature-controlled room (23°C) with a 12-hour light–dark cycle with lights on at 07:00 hours for the study’s duration.
Biodistribution
Female C57BL/6 mice were randomly assigned to fasted or fed groups and assessed at 1, 2, or 4 hours postinjection time points (n ≥ 6 for each time point in each group). The fasted group had no access to food 4 hours prior to injection and throughout the biodistribution studies. Fed mice had access to food ad libitum throughout experiments. Both the groups had access to water.
Mice were anaesthetized under 3% isoflurane and ventilated under 1.5% to 2% isoflurane and injected via tail vein with 5.23 to 26.4 MBq of [1-Nal4, Lys5(4-[18F]-FB)]G-7039. Mice were allowed to recover and then were euthanized at the indicated time points. The heart and other organs of interest were resected whole with the exception of bone, sampled from the right tibia, and muscle taken from the left quadriceps. Organs were weighed, and their radioactivity was counted in a high-purity Ge gamma counter. All excised hearts were fixed in 4% paraformaldehyde (in PBS) prior to counting. The radioactivity (Bq) in sampled tissues was decay corrected to the time of injection, and probe uptake was calculated as percentage of injected dose per gram of tissue (%ID/g) as described previously. 16,18
Positron Emission Tomography/CT Imaging
Mice were anesthetized as described earlier and placed onto the bed of an Inveon preclinical PET scanner (Siemens Medical Solutions, Erlangen, Germany). After insertion of a tail vein catheter, 90-minute dynamic emission scans were initiated 30 seconds before wt (n = 6) and ghsr−/− (n = 6) mice were injected with 5.6 to 15.9 MBq of the tracer. Images were acquired using scanner software. Once the PET imaging session concluded, the mouse and bed were removed together and transported to the CT scanner, taking care to maintain the mouse’s position on the bed and the same anesthetic conditions during the transfer. The CT acquisitions were performed on a clinical Revolution CT scanner (General Electric, Schenectady, New York) with settings of 4.0 cm field of view (FOV), 120 kV, 300 mA, and 192 slices of 0.625 mm thickness. Total scan time was 1.0 seconds after which the mice were euthanized.
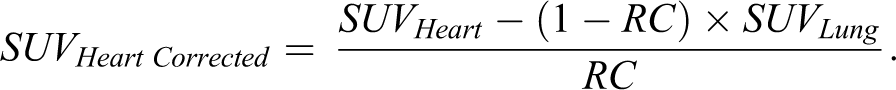
Dynamic PET imaging data were binned into 13 imaging frames of 12 frames × 5 minutes and 1 frame × 30 minutes (2.5× zoom and Nyquist filter applied). Data were decay corrected to the time of injection, and images were corrected for dead time, random, and scatter coincidences prior to reconstruction using an ordered subset expectation maximization algorithm (OSEM3D; 2 iterations of 16 subsets) followed by maximum a priori reconstruction (MAP; 18 iterations) with vendor-supplied software and analysis in 3D Slicer (v. 4.6.2). Standardized uptake values (SUVs) were calculated using Equation 1 from volumes of interest (VOIs) drawn around volumes corresponding to the heart, lungs, and abdomen on PET images overlaid with CT images. Heart uptake was corrected for spillover activity from the lungs using Equation 2, where RC is the recovery coefficient (which we have set to 0.93 for the mouse heart, based on values for a phantom of similar size 19 ).

Termination of Plasma Hormone Levels
During biodistribution and after imaging studies, whole blood was collected into heparinized syringes by cardiac puncture. Aliquots of 75 µL were dispensed into tubes containing Complete Mini protease inhibitors (Sigma-Aldrich) in PBS, gently mixed, and stored on ice. Tubes were centrifuged at 3000 rpm for 10 minutes at 4°C, and 50-µL aliquots of plasma were collected and stored at −80°C until assayed. Levels of ghrelin, glucagon, glucagon-like peptide-1 (GLP-1), and insulin were determined by enzyme-linked immunosorbent assay (ELISA; LUMINEX 200 multiplex assay, Luminex Corporation, Austin, Texas), and concentrations were calculated as pg/mL.
Fluorescence Microscopy
The excised hearts from fasted and fed mice killed at 1 hour postinjection and wt and ghsr−/− mice were frozen and embedded in OCT and cryosectioned at 7 µm for microscopy as described previously. 8 Four sections per mouse were used for microscopy analysis. To visualize ghrelin, SERCA2a, CD36, and GLUT4, primary and secondary antibodies were used as shown in Table 1. To detect GHSR1a, SulfoCy5-ghrelin(1-19) was used as described previously. 7,8 Coverslips were then mounted with ProLong Gold liquid mountant containing DAPI nuclear stain (ThermoFisher Scientific, Waltham, Massachusetts).
Primary Antibodies Used for Immunofluorescence Microscopy.
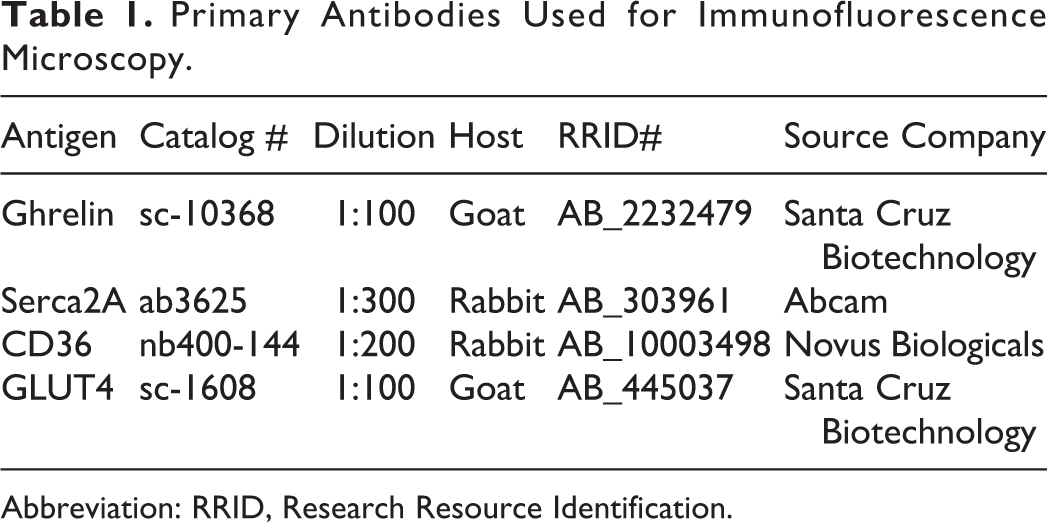
Abbreviation: RRID, Research Resource Identification.
Five random FOVs per section were acquired at 20× magnification (Nikon NIS Elements v. BR 4.50.00; Shinagawa, Tokyo, Japan). Images were imported for analysis into FIJI v. 1.49v, a distribution of ImageJ (National Institutes of Health, Bethesda, Maryland). Fluorescence was quantified using a custom FIJI script that measures fluorescence intensity, which represents protein levels, across an image and returns the raw integrated density as done previously. 7,8,20,21
Statistical Analyses
Statistical analyses were conducted, and graphs were plotted using GraphPad Prism v. 7.00 (GraphPad Software, Inc, San Diego, California). Differences in cell uptake were analyzed using 2-way repeated measures analysis of variance (ANOVA) and Bonferroni post hoc test. For biodistributions, within-group differences between organs sampled and between time points in fasted, fed, wt, and ghsr−/− mice were determined using 2-way ANOVA followed by Tukey multiple comparisons test. Between-group differences in fasted and fed mice in matching organs at the same time point were analyzed by 2-way ANOVA and Bonferronis multiple comparisons test. Two-way ANOVA was also used to assess differences in plasma proteins evaluated by ELISA. Data from dynamic PET SUVs were evaluated using 2-way repeated measures ANOVA followed by Bonferroni multiple comparison test for between-group differences and Tukey multiple comparison test for within-group differences. Static PET SUVs and between-group comparisons of plasma protein levels from ELISA measurements were evaluated using unpaired 2-tailed Student t test. For immunofluorescence microscopy images, differences in mean fluorescence between fasted and fed mice and between wt and ghsr−/− mice were determined by 2-way ANOVA and Bonferroni multiple comparisons test. Grubb test was used to address outliers in plasma protein and fluorescence data. Outliers were removed from the final analysis. For correlations, linear regression analysis was used. Significance was set at P < .05 for all statistical tests.
Results
Physicochemical Characteristics of [1-Nal4, Lys5(4-[18F]-FB)]G-7039
The chemical structure of [1-Nal4, Lys5(4-[18F]-FB)]G-7039 is shown in Figure 2. The binding affinity, as evaluated by IC50, is 69 nmol/L, and receptor activation, as determined by EC50, is 1.1 nm compared to human ghrelin (IC50 = 7.63 nmol/L and EC50 = 1.6 nmol/L). 14 The partition coefficient (logP) was calculated using ACD/LogP software to assess [1-Nal4, Lys5(4-[18F]-FB)]G-7039 lipophilicity and was found to be 8.76 ± 0.88. We calculated stability in 25% human serum to be 730.8 minutes (12.2 hours).
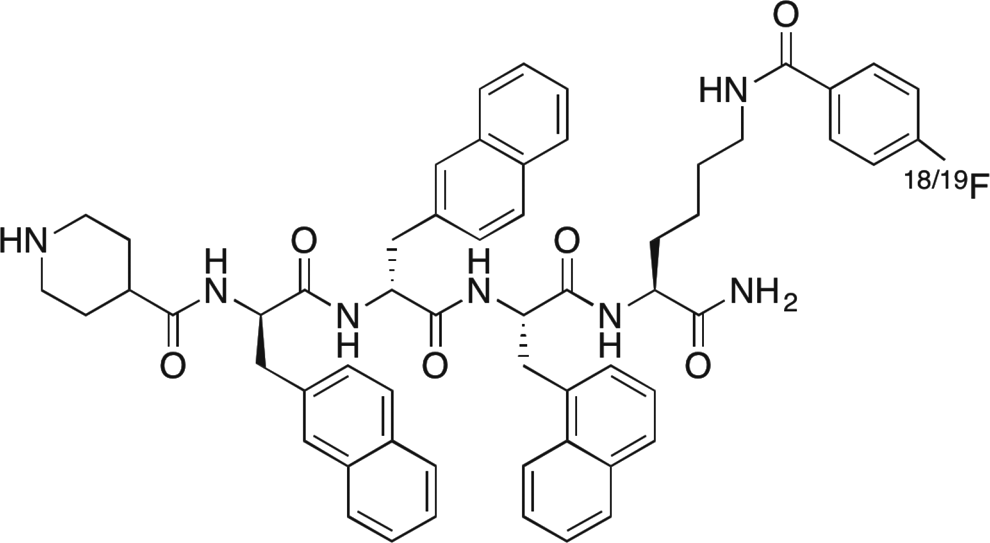
Chemical Structure of [1-Nal4, Lys5(4-[18F]-FB)]G-7039.
Cellular Uptake of [1-Nal4, Lys5(4-[18F]-FB)]G-7039
Uptake of [1-Nal4, Lys5(4-[18F]-FB)]G-7039 was determined in wt OVCAR8 cells and OVCAR/GHSR1a cells (Figure 3). Two-way repeated measures ANOVA determined that there were differences with respect to time point (P < .01) and cell type (P < .05). Uptake in cells expressing GHSR1a was significantly higher at both the 20- and 60-minute time points, indicating that uptake of the tracer was specific and receptor-dependent (Figure 3).

Cell Uptake of [1-Nal4, Lys5(4-[18F]-FB)]G-7039. Both wild-type (wt) OVCAR and OVCAR/GHSR1a cells were incubated at the indicated time points with 0.1 to 0.5 MBq of [1-Nal4, Lys5(4-18FB)]G-7039. Values are means ± standard error of the mean (SEM; n = 6). *(P < .05; P = .0357) between transfected and wt for 20 minutes uptake and **(p<0.01; p = 0.0061) between transfected and wt for 60 minutes uptake.
Ex Vivo Biodistribution in Fasted and Fed Mice
To determine the pharmacokinetics of [1-Nal4, Lys5(4-[18F]-FB)]G-7039, biodistribution was assessed at 1, 2, and 4 hours postinjection in both fed and fasted female C57BL/6 mice. The uptake profiles in fasted and fed mice were similar (Figure 4). Negligible heart uptake was observed in both the groups. The probe was distributed primarily to the lung, spleen, liver, and urine. Differences between fed and fasted mice at the same time point were not significant except in urine at 2 hours (P < .05). Within groups, the differences in uptake were observed between time points in the same organ and between organs at the same time point.

Biodistribution profile of [1-Nal4, Lys5(4-[18F]-FB)]G-7039. Fasted (A) and fed (B) female C57BL/6 mice were injected with 5.23-26.4 MBq [1-Nal4, Lys5(4-[18F]-FB)]G-7039 and killed 1, 2, and 4 hours postinjection. Insets show values from organs with low uptake on a more appropriate y axis. All values are means ± standard error of the mean (SEM). A, *P < .05 in liver at 2 hours versus all tissues (except spleen), ****P < .0001 in urine at 2 hours versus all other tissues. (B) *P < .05 in liver at 1 hour versus all tissues (except spleen, tail, and urine) and in urine at 1 hour versus all tissues (except liver), **P < .01 in Urine at 2 hours versus all tissues.
Plasma Concentrations of Ghrelin, Glucagon, GLP-1, and Insulin in Fasted and Fed Mice
To establish whether the response of circulating ghrelin to nutritional status may interfere with uptake of the probe, plasma levels of ghrelin, along with other hormones known to change with nutritional status (glucagon, glucagon-like peptide-1 [GLP-1], and insulin) in fasted and fed mice were assessed by ELISA (Figure 5). Plasma ghrelin levels were independent of time point or nutritional state as evaluated by ANOVA. No differences between fasted and fed mice were observed in other time point–matched plasma protein concentrations.

Plasma concentration of ghrelin, GLP-1, glucagon, and insulin in fasted and fed mice. Blood plasma concentrations of (A) ghrelin, (B) glucagon-like peptide-1 (GLP-1), (C) glucagon, and (D) insulin in fasted and fed mice killed 1, 2, and 4 hours postinjection of [1-Nal4, Lys5(4-[18F]-FB)]G-7039. Values are shown as mean concentration in pg/mL ± standard error of the mean (SEM).
Growth Hormone Secretagogue Receptor 1a, Ghrelin, and Markers of Cardiac Metabolism in Fed and Fasted Mice
Tissue sections of hearts excised from fasted (n = 8) and fed (n = 6) mice killed 1 hour postinjection were imaged using fluorescence microscopy to evaluate expression of cardiac GHSR1a, ghrelin, and markers of cardiac contractility (SERCA2a), and glucose and fatty acid metabolism (GLUT4 and CD36, respectively). As shown in Figure 6, levels of ghrelin (P < .05) and GLUT4 (P < .01) were significantly higher in fed mice compared to fasted mice. Levels of SERCA2a and CD36 did not change.

Metabolic profiles in cardiac tissue from fasted and fed mice. Levels of GHSR1a, ghrelin, and the indicated metabolic markers were assessed in fasted and fed mice killed 1 hour postinjection by fluorescence microscopy. Values are given in raw integrated density (Arbitrary Units) of fluorescence. Each point represents average fluorescence intensity from 1 mouse. The middle line represents the mean value and the bars indicate standard error of the mean (SEM). *P < .05, **P < .01
In Vivo µPET-CT Imaging: Static Acquisition
To determine the specificity of [1-Nal4, Lys5(4-[18F]-FB)]G-7039 for GHSR1a in vivo, wt C57BL/6 J and global receptor knockout (ghsr−/− ) mice were imaged in list-mode for 60 minutes followed by a 30-minute static scan. The PET images indicated that the regions with greatest signal intensity corresponded to the lungs and abdomen (Figure 7, top panel), but images revealed no appreciable signal in the heart, aside from the 5-minute frame. Upon calculation of the SUVs for VOIs in the heart, lungs and abdomen in the static scan, and correcting the heart SUVs for lung spillover, there were no significant differences in SUVs between wt and ghsr−/− mice for heart, lung, or abdomen (Figure 7, bottom panel).
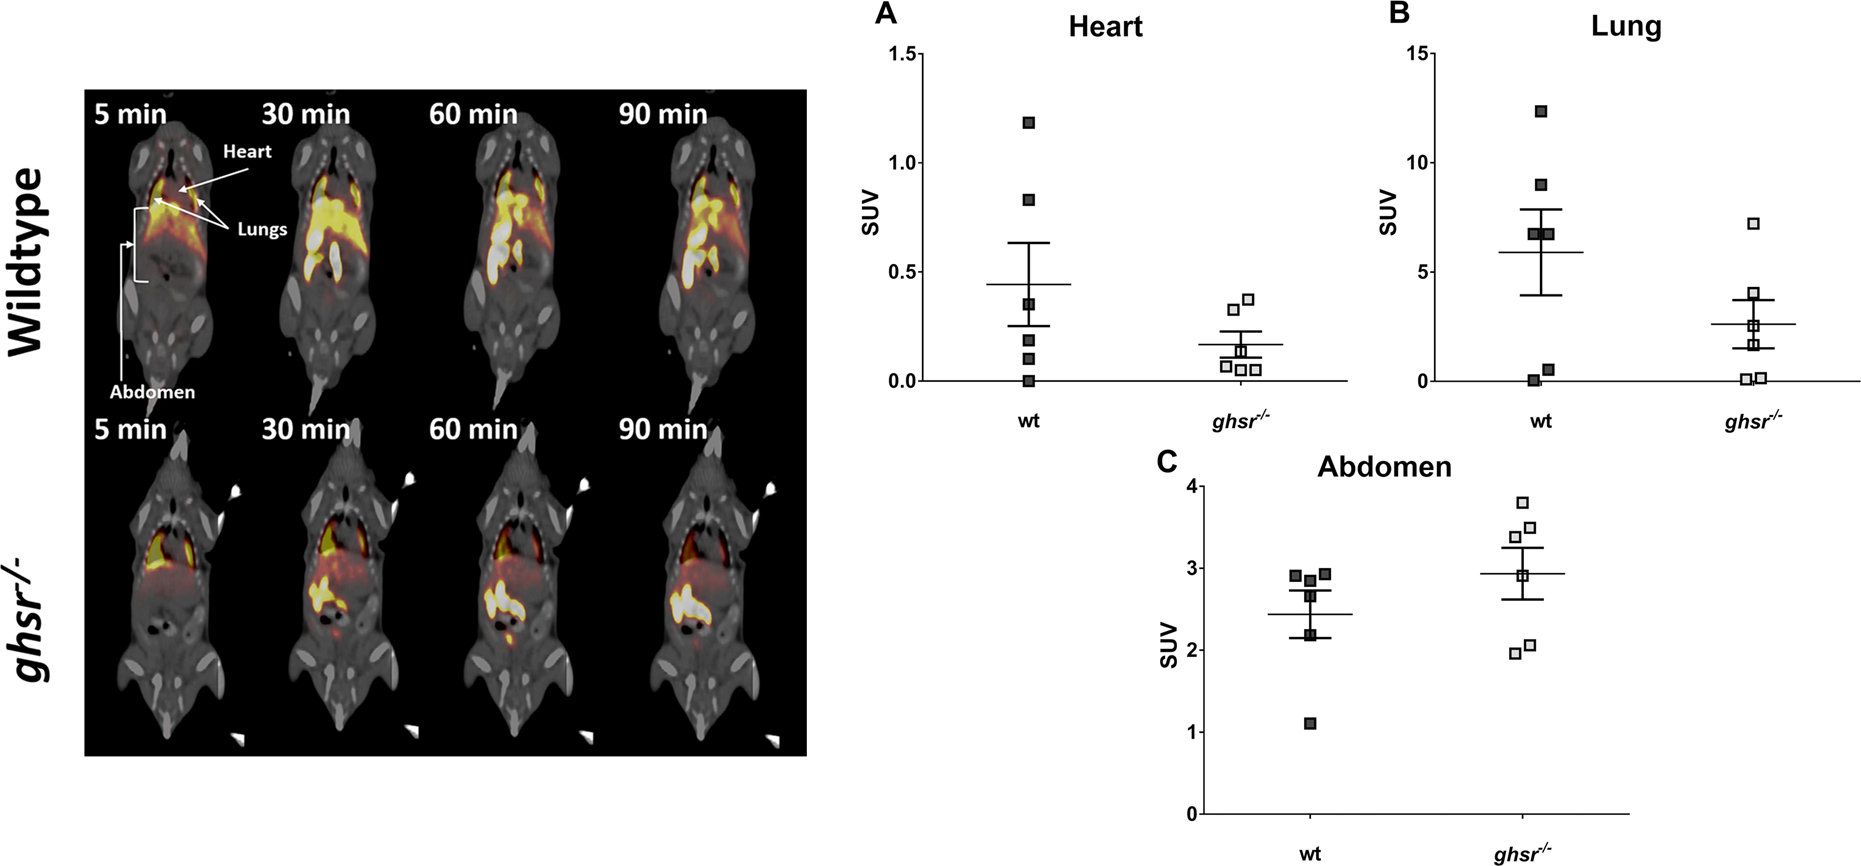
Positron emission tomography computed tomography (PET-CT) imaging in wild-type (wt) and ghsr−− Mice. Top Panel: Uptake of [1-Nal4, Lys5(4-[18F]-FB)]G-7039 in wt (top) and ghsr−/− (bottom) mice. All frames were integrated over a 5-minute time period except the 90-minute frame that was integrated over 30 minutes. Coronal slices through the mouse body at the section of liver are shown with view from anterior. The arrows indicated regions where volumes of interest (VOIs) were drawn. Bottom Panel: standardized uptake values (SUVs) Calculated from VOIs of spillover corrected heart (A), lung (B), and abdomen (C) 60 minutes postinjection and over a 30-minute time frame. Each point represents the average SUV calculated from an individual mouse VOI. No differences between wt and ghsr−/− mice were observed in any VOIs.
In Vivo µPET-CT Imaging: Dynamic Acquisition
During the 60-minute acquisition time, images were acquired every 5 minutes, and time–activity curves were generated for the heart, the heart minus lung spillover, the lungs and abdomen for both wt and ghsr−/− mice (Figure 8). After correcting for lung spillover, the curves for both wt and ghsr−/− mice showed a washout pattern in the heart. However, there appeared to be a slower washout in the wt mice when compared with ghsr−/− mice in the first 15 minutes (Figure 8A). There was a much more gradual washout pattern in the lungs for both the groups (Figure 8B), and an accumulation of the tracer over time in the abdominal area (Figure 8C). While there were differences in SUVs over time within each group, there were no overall differences in SUVs between the groups.
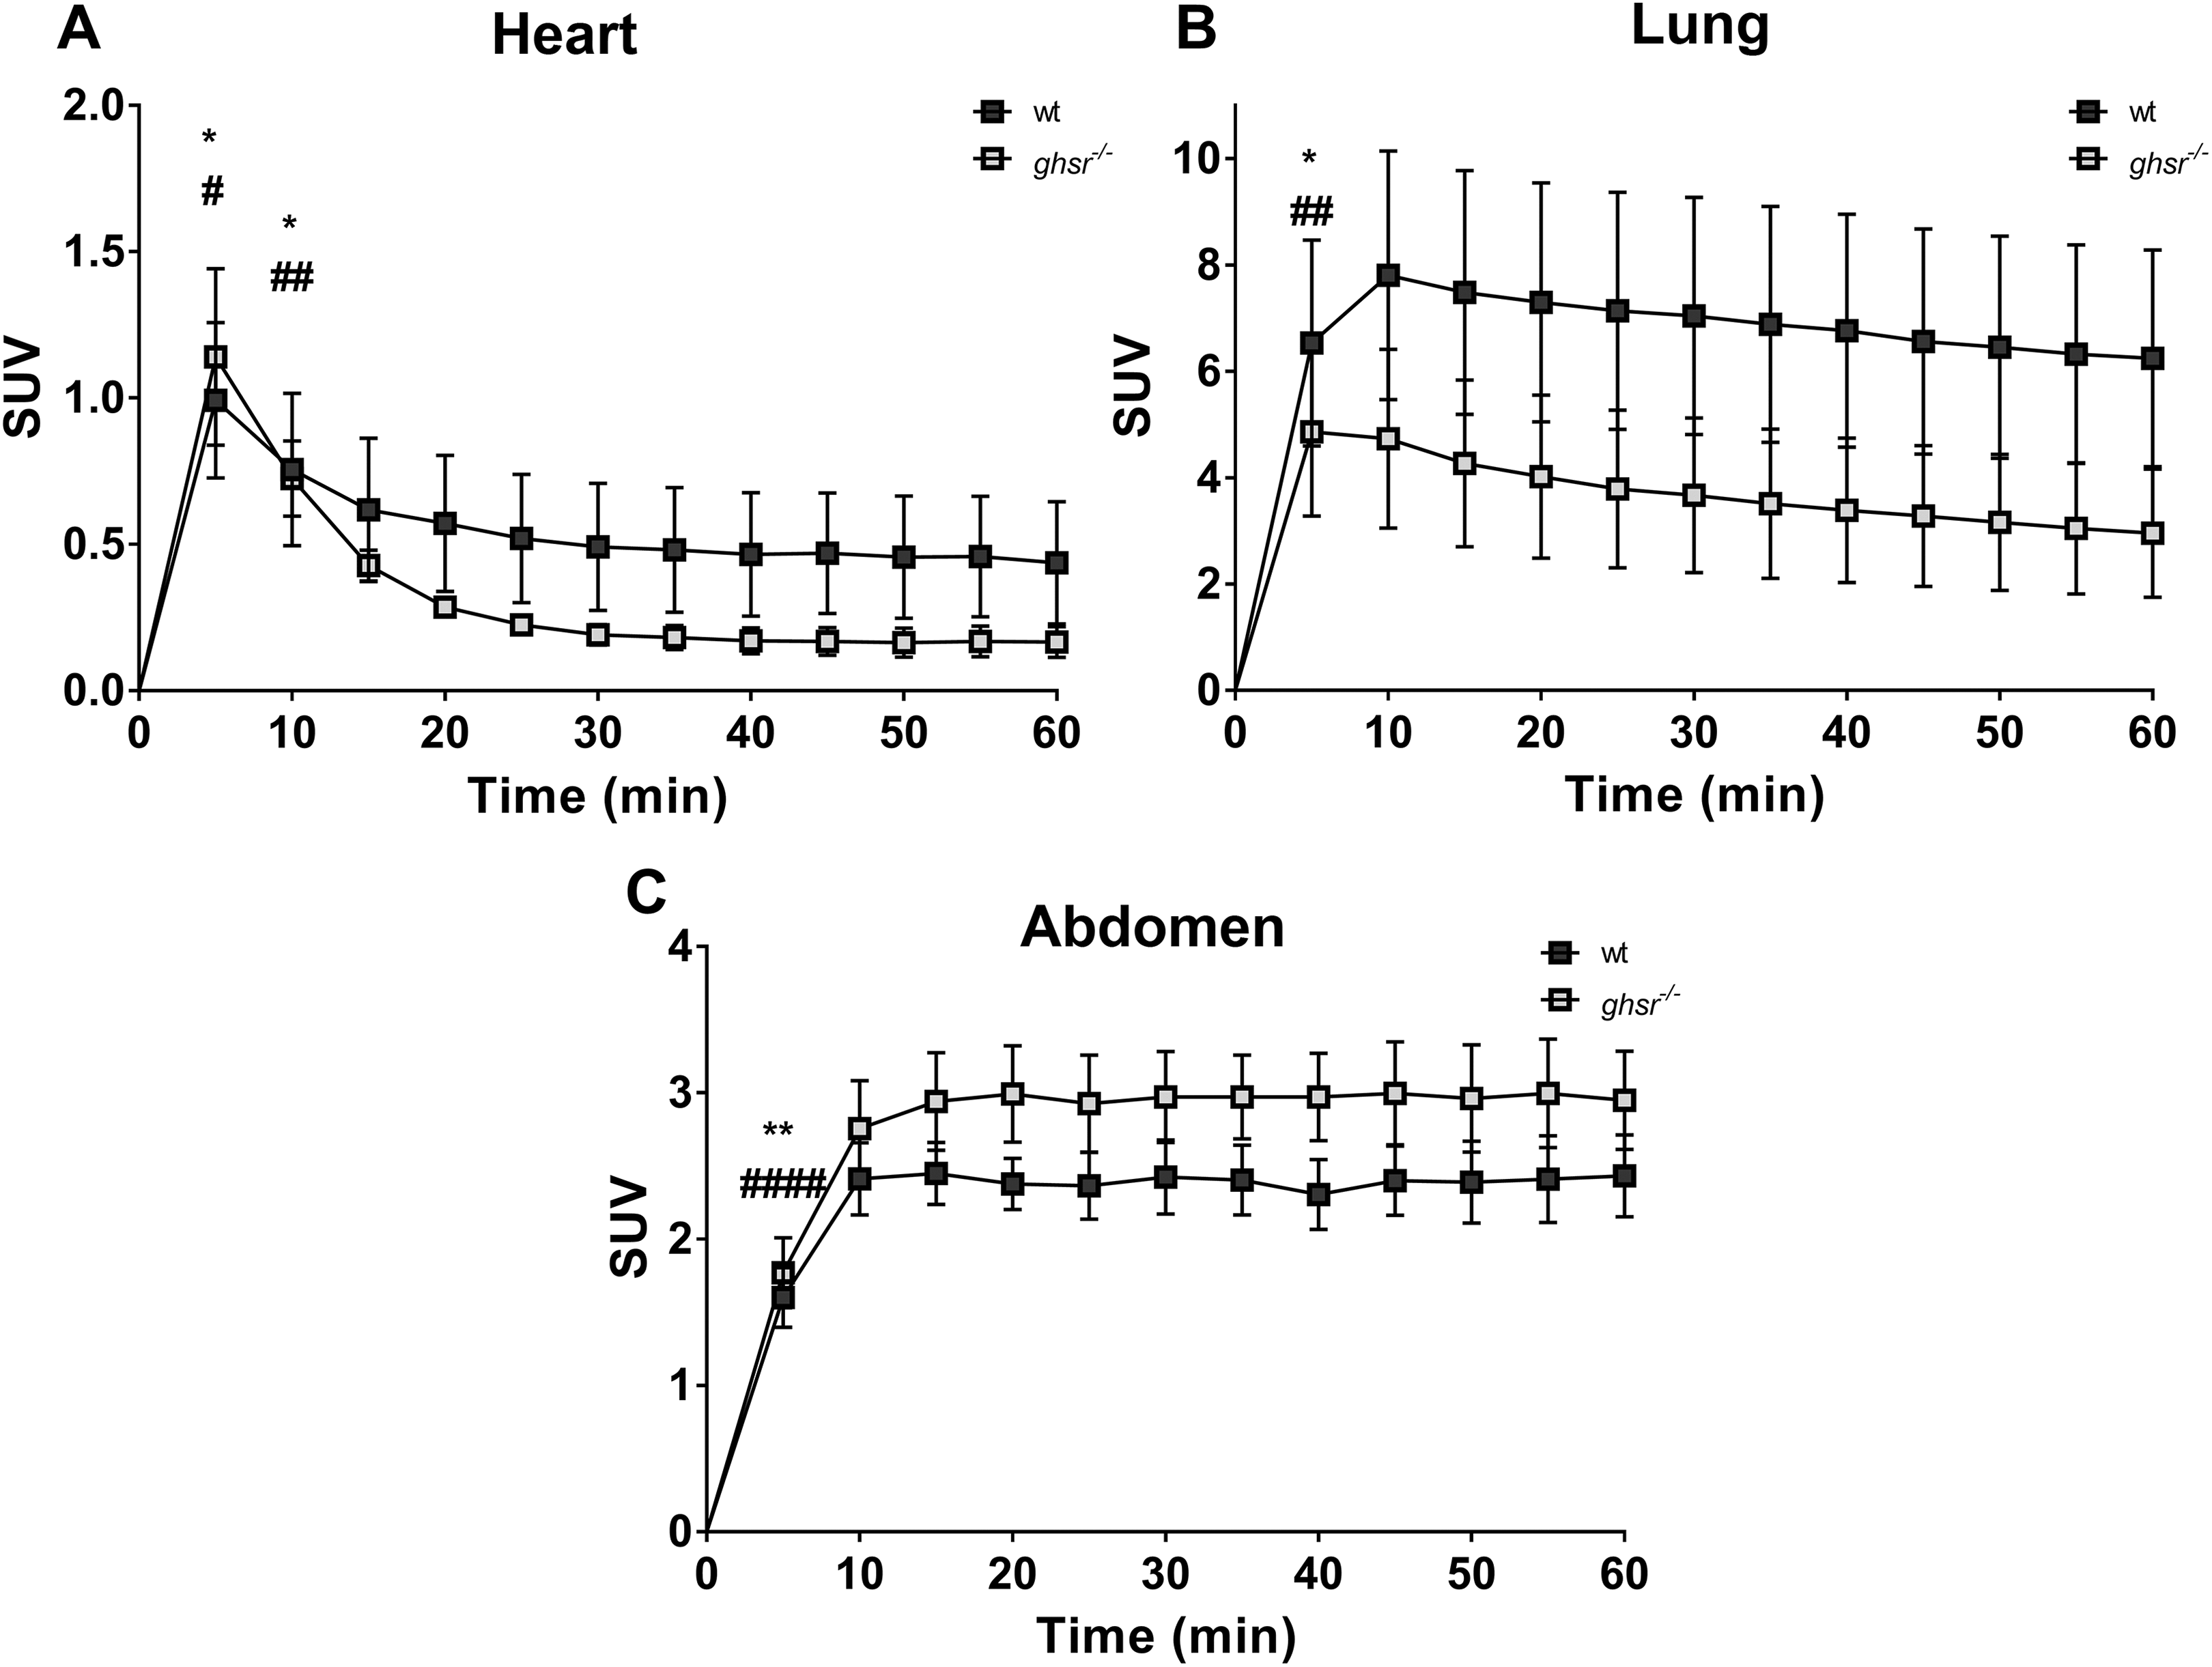
Time-activity curves for [1-Nal4, Lys5(4-[18F]-FB)]G-7039 uptake in wild-type (wt) and ghsr−/− Mice. Spillover corrected heart (A), lung (B), and abdomen (C) uptake of [1-Nal4, Lys5(4-[18F]-FB)]G-7039. Values are means ± standard error of the mean (SEM; n = 6 for wt and n = 6 for ghsr−/− ). All significant differences were only within groups. (A) *P < .05 and # P < .05 at 5 and 10 minutes versus all time points (except 15 minutes). (B) *P < .05 and ## P < .01 at 5 minutes versus all time points. (C) **P < .01 and #### P < .0001 at 5 minutes versus all time points.
Sensitivity of [1-Nal4, Lys5(4-[18F]-FB)]G-7039 for GHSR1a Detection
Corrected static SUVs from the heart were plotted as a function of cardiac GHSR1a expression and plasma ghrelin levels to assess the probe sensitivity for GHSR1a expression as well as for circulating levels of ghrelin (Figure 9). No significant correlations were observed between heart SUV and GHSR1a expression (Figure 9A) or plasma ghrelin (Figure 9B).

Correlations of heart SUV and plasma ghrelin with cardiac GHSR1a expression. (A) Static standardized uptake values (SUVs) from volumes of interest (VOIs) assigned to heart in wild-type (wt; n = 5) and ghsr−/− (n = 6) mice plotted as a function of GHSR1a expression. (B) Static SUVs from VOIs assigned to heart in wt (n=5) and ghsr−/− (n = 6) mice plotted as a function of plasma ghrelin concentrations. Each point represents a value from an individual mouse.
Discussion
Our study provides insight into development of a PET tracer for imaging myocardial GHSR1a. The tracer that we synthesized, [1-Nal4, Lys5(4-[18F]-FB)]G-7039, demonstrated in vitro stability and high affinity for the ghrelin receptor. 22 In this study, we characterized its ex vivo biodistribution in mice under fed and fasting states and showed that uptake into all organs studied was independent of circulating ghrelin concentrations as well as levels of myocardial ghrelin. In vivo static and dynamic PET image analysis of tracer specificity using wt and ghsr−/− mice determined that tracer uptake in the heart, lungs, and abdominal area was independent of GHSR1a expression. There was negligible uptake in the heart and high uptake in the liver and lungs. Finally, uptake of the tracer did not correlate significantly with either myocardial GHSR1a expression or with plasma ghrelin levels. Our results indicate that the peptidomimetic ghrelin tracer, [1-Nal4, Lys5(4-[18F]-FB)]G-7039, may not be a suitably specific or sensitive probe for the PET imaging of myocardial GHSR1a in normal mouse heart.
The biological half-life of [1-Nal4, Lys5(4-FB)]G-7039 was tested in human serum to assess its stability and help in establishing a time frame for imaging. Imaging experiments and biodistributions at 1 and 2 hours were well within 1 half-life, and 4-hour biodistributions were within 2 half-lives. Native ghrelin has been reported to have an in vitro half-life of 4 hours in human serum and 30 minutes in rat serum.
23
The greater biological half-life observed for [1-Nal4, Lys5(4-FB)]G-7039 compared to ghrelin may be explained by the presence of unnatural
Ghrelin has a higher binding affinity for GHSR1a than [1-Nal4, Lys5(4-[18F]-FB)]G-7039, 14 and its circulating levels are high in fasting state. There is therefore a possibility that the fasting state may interfere with the binding of [1-Nal4, Lys5(4-[18F]-FB)]G-7039 to GHS-R1a. After a 4-hour fast, there were no differences in plasma concentrations of ghrelin, GLP-1, glucagon, and insulin, which were selected because their circulating concentrations are dependent on nutritional state. Such a brief fast may not have been long enough to induce measurable metabolic changes. Others have found that fasting for 24 hours resulted in elevated plasma ghrelin levels in C57BL/6 mice, 25 so this may be a more appropriate fasting time period. A decrease in the tissue levels of the insulin-dependent glucose transporter, GLUT4, in the fasted state is expected, but the unaltered expression of SERCA2a, a marker of excitation–contraction coupling that is modulated by ghrelin, 26 and CD36, a fatty acid transporter to which growth hormone secretagogues may bind, 27 indicates that neither contractile function nor fatty acid uptake interfered with Nal 4 , Lys5(4-[18F]-FB)]G-7039 uptake. Interestingly, we found that ghrelin levels in heart tissue were decreased after a 4-hour fast, suggesting a discordance between circulating and cardiac tissue levels of ghrelin that may be important when testing and validating future radioligands that target cardiac GHS-R1a.
While cell uptake studies indicated specific, receptor-dependent uptake of [1-Nal4, Lys5(4-[18F]-FB)]G-7039, there were no significant differences in probe uptake in the heart, lung, or abdominal area in mice lacking ghsr. Despite our findings of high GHSR1a levels in the heart when compared to other tissues in mice 28 and good receptor binding affinity and receptor-dependent cell uptake of [1-Nal4, Lys5(4-[18F]-FB)]G-7039, we could not demonstrate specificity of binding to myocardial tissue in vivo. It is unlikely that the tracer binds with a different affinity to the mouse GHSR1a, since human and mouse GHSR1a align with a 95% identity in their amino acid sequences. These results could be due to the unfavorable logP value of the compound that reflect its lipophilic properties. Favorable values for drugs and imaging agents are in the range of 1 to 3, and higher logP values can impact absorption, distribution, metabolism, excretion, and toxicity of a compound. 29 However, calculated logP values alone are not necessarily a predictor of in vivo behavior, as other physiochemical properties also impact the pharmacokinetics of any given PET tracer. 30 Therefore, it is important to characterize and validate promising lead compounds in vivo in addition to calculating its lipophilic and receptor-binding parameters.
The lipophilic nature of ghrelin-derived analogs may determine its binding to GHSR1a and therefore must be preserved in the design and synthesis of radioligands. Our group has developed ghrelin analogs 10 and small molecules 11 that bind to GHS-R1a with an affinity that is comparable to, or even exceeds, that of natural ghrelin. Computational modeling has shown that the binding of these putative imaging agents to GHSR1a is dependent on interaction with hydrophobic binding pockets. 22 Other groups have also developed similar types of tracers that can be labeled with 18F or 11C for PET 13,31,32 or 99mTc for SPECT. 24 Similar to the results from the present study, blocking experiments either did not show much displacement 13 or showed very little displacement, 31 illustrating the difficulty in determining in vivo specificity of tracers that target GHSR1a.
Despite these difficulties, there is a need to develop imaging agents to detect changes in GHSR1a in the heart. Early studies showed GHSR1a binding sites increased in density in coronary artery disease, 33 indicating changes in GHSR1a may reflect heart disease progression in humans. There are also changes in myocardial GHSR1a levels and messenger RNA in congestive heart failure in humans. 8 We 8 and others 34 have shown that myocardial GHSR1a decreases during the progression of diabetic cardiomyopathy, with a negative correlation between GHSR1a and development of impaired glucose tolerance.8 Therefore, GHSR1a may be a biomarker for cardiomyopathies or heart failure, and developing radioligand-based imaging agents that target GHSR1a may complement existing imaging modalities in the detection of changes in heart function that may indicate onset of heart disease or heart failure.
Footnotes
Acknowledgments
The authors wish to thank Ms Jennifer Hadway, Ms Lise Desjardins and Ms Laura Morrison for their assistance in mouse handling and PET-CT imaging.
Declaration of Conflicting Interests
The author(s) declared no potential conflicts of interest with respect to the research, authorship, and/or publication of this article.
Funding
The author(s) disclosed receipt of the following financial support for the research, authorship, and/or publication of this article:This work was supported by an Ontario Graduate Scholarship and a Canadian Institutes of Health Research CGS-M studentship to AA, and by operating grants from the Canadian Institutes of Health Research and the Natural Sciences and Engineering Research Council to LL and SD.