
Abstract
Keywords
Introduction
Hepatocellular carcinoma (HCC), a prevalent form of primary liver cancer, stands as sixth most common neoplasm and third leading cause of cancer-related deaths. 1 A World Health Organization report underscores HCC’s emergence as a significant contemporary health challenge, with its incidence on the rise. 2 In 2018, it was approximated that there were ~1 million new cases of liver cancer and ~0.7 million associated deaths globally. 3 By 2022, the morbidity and mortality of HCC reached a pinnacle worldwide. 4 Regions such as East and Southeast Asia, along with Middle and Western Africa, exhibit the highest rates of HCC compared to other parts of the world. 5 While HCC traditionally carries a poor prognosis, early detection through ultrasonography surveillance provides a glimmer of hope by identifying HCC at its early stage (single tumors or up to 3 nodules ≤3 cm). 6 At this stage, interventions like resection, liver transplantation, or ablation offer the potential for curing the tumor, with a 5-year survival rate exceeding 50%.7,8 However, for patients in intermediate or advanced stages of HCC, palliative measures such as transcatheter hepatic arterial chemoembolization (TACE) or intravenous chemotherapy become viable options. 9 These approaches, however, are limited by their associated toxicities, drug resistance, and various adverse effects, particularly for patients in the advanced stages, and their survival benefits remain uncertain.10,11 Recognizing the limitations of conventional therapies for HCC, there has been a growing trend toward the utilization of complementary and alternative medicine in managing the disease over recent decades. Presently, the integration of traditional Chinese medicine into modern comprehensive therapy is emerging as a significant aspect in the research and treatment landscape of HCC.12,13 Numerous studies demonstrated the therapeutic efficacy of Chinese medicine and its ability to complement Western medical treatments.14,15 Scholars have suggested that combining Chinese and Western medical approaches represents the future direction for innovative HCC management.14,15 For example, the compound Phyllanthus Urinaria L. is effective in attenuating the progression of HBV-associated cirrhosis to HCC. 16 Additionally, a combination of Phyllanthus urinaria and lenvatinib was found to inhibit HCC progression. 17 Ginsenosides (GS), the active constituents of ginseng, have been noted for their anticancer properties 18 and their ability to mitigate chemotherapy-induced adverse drug reactions. 19 As a result, they have been recommended as adjuncts to Western medical approaches for treating HCC. 19 However, observations regarding efficacy and safety of this combined therapy are contentious or even contradictory. 20 Additionally, the duration of ginsenosides treatment has varied widely, ranging from 1 week to 26 weeks, 21 with the impact of treatment duration on combination therapy effectiveness remaining uncertain. Moreover, 4 GS regimens—total ginsenosides (GS), compound K (CK), Rh2, and Rg3—used clinically used in combination therapy, but it remains inconclusive which regimen offers the highest efficacy. 22 Thus, there is an urgent need to objectively assess whether combining Western medical approaches with GS is more effective than Western medical approaches alone for treating HCC, and to determine the optimal GS regimen for maximal efficiency. This study conducts meta-analyses to evaluate the efficacy of combining Western medical approaches (TACE, chemotherapy, and surgery) with GS therapy for HCC.
Methods
Study Design
This systematic review and meta-analysis were conducted in accordance with the standard guideline of “Preferred Reporting Items for Systematic Reviews and Meta-Analyses (PRISMA)”
Search Strategy
A literature search was conducted across China National Knowledge Infrastructure (CNKI), Wanfang Data, PubMed, Cochrane Library, Embase, Web of Science up until May 2024 for clinical randomized controlled trials (RCTs) on the adjuvant treatment of HCC with GS. The search terms included “ginsenoside,” “Shenyi capsule,” “ginsenoside Rg3,” “hepatocellular carcinoma,” “hepatocellular carcinomas,” “liver cell carcinomas,” “liver cell carcinoma,” “liver cancers,” and “liver Cancer.” The search formula was: (ginsenoside OR ginsenoside Rg3 OR Shenyi Capsule) AND (Hepatocellular Carcinoma OR Hepatocellular Carcinomas OR Liver Cell Carcinomas OR Liver Cell Carcinoma OR Liver Cancers OR Liver Cancer).
Inclusion and Exclusion Criteria
The inclusion criteria were as follows: (1) Study type was a randomized controlled trial (RCT); (2) Study population include patients diagnosed with primary liver cancer confirmed by imaging, pathology, or cytology; (3) For the intervention, experimental group received treatment with GS combined with Western medicine methods (TACE, surgery, chemotherapy), while the control group received Western medicine treatment methods (TACE, surgery, chemotherapy); (4) Outcome measures: Near-term objective efficacy was evaluated according to the Response Evaluation Criteria in Solid Tumors (RECIST), including objective response rate (ORR), disease control rate, Karnofsky Performance Status (KPS) score improvement rate, overall survival rate, alpha-fetoprotein (AFP) reduction rate, and incidence rate of adverse reactions.
The exclusion criteria were as follows: (1) Non-RCT studies; (2) Experimental studies or reviews; (3) Studies not observing the efficacy of GS in the treatment of liver cancer; (4) Studies lacking outcome measures; (5) Duplicate publications retained one article.
Data Extraction and Quality Assessment
For each eligible study, data sheets were used for the independent collection of extracted information by 2 investigators (RZ and YL). Any disparities were addressed through discussion or by consulting other investigators (YG, HT, SW, and QZ). The extracted information covered various aspects, including study characteristics such as treatment strategies, follow-up duration, and primary outcomes; patient details, including case numbers; clinical intervention characteristics like different chemotherapy/surgeries for HCC; and the specific components of GS (total GS, Rg3, Rh2, CK) utilized in the RCTs, as well as distinctions between GS group and GS-free group.
Bias risk assessment in included studies was conducted using the Cochrane Collaboration’s tool. The evaluation criteria consisted of 7 items: random sequence generation, allocation concealment, blinding of participants and personnel, blinding of outcome assessment, incomplete outcome data, selective reporting, and other potential sources of bias. Each item was classified as “yes” (indicating a low risk of bias), “unclear” (suggesting an uncertain risk of bias), or “no” (indicating a high risk of bias).
Data Analysis and Statistical Methods
Extracted data underwent analysis using Review Manager 5.4 software from the Cochrane Library. To illustrate efficacy analysis statistics for continuous data, the mean difference (MD) and 95% confidence interval (CI) were utilized, with a significance level set at P < .05. Heterogeneity among the studies was evaluated using the Cochrane Q-test and I 2 statistics (where P < .10 indicates significance, and I² > 50% indicates high heterogeneity). When minimal or no heterogeneity was detected among the included studies (P ≥ .10, I 2 ≤ 50%), the fixed-effect model was employed for analysis. Conversely, in cases of significant heterogeneity among the included results (P < .10, I 2 > 50%), the random effects model was utilized for analysis, accompanied by subgroup analyses. During subgroup analysis, if data in one or more subgroups displayed notable heterogeneity (P < .10, I 2 > 50%), the random effects statistical model was employed for overall data analysis.
Results
Literature Search and Selection
Figure 1 shows study flow. During the initial search phase, a comprehensive exploration of multiple databases, including “Embase,” “PubMed,” “CNKI,” “WOS,” “Wanfang,” and “Cochrane library,” yielded a total of 1578 records. Subsequent screening led to the exclusion of 776 records, primarily due to duplication. The remaining 802 articles underwent further examination. Among these, 133 articles were excluded for various reasons, including review, studies presenting graphical data only, and some articles lacking complete data or a control group, non-clinical studies, other liver diseases. Ultimately, 19 studies meeting the inclusion criteria were selected for meta-analysis.

Flow diagram of the meta-analysis.
Study Characteristics
Over a span of 12 years, from 2005 to 2019, 19 independent studies were published, collectively evaluating the efficacy and safety of GS as adjuvant therapy for primary liver cancer. The detailed study characteristics are succinctly summarized in Table 1.
Study Characteristics of Included Studies.

Risk of Bias Assessment for Eligible Studies
The assessment of bias risk revealed varying levels of uncertainty and potential bias across the eligible studies. Specifically, 9 studies were labeled with an “unclear risk” of selection bias due to insufficient descriptions of random sequence generation. Similarly, 15 studies were designated with an “unclear risk” of selection bias, and one study was marked as having a “high risk” of selection bias due to ambiguity regarding allocation concealment. Fifteen studies were classified with an “unclear risk,” primarily due to inadequate details concerning blinding of participants and personnel. Seventeen studies were considered to have an “unclear risk” of detection bias because of incomplete information regarding blinding of outcomes assessment. Two studies were categorized with an “unclear risk” of attrition bias due to incomplete outcome data. Lastly, 18 studies were identified as having an “unclear risk” of reporting bias due to potential selective reporting. It is important to note that 10 studies were labeled with an “unclear risk” of other forms of bias. A visual representation of quality assessment was shown in Figure 2.
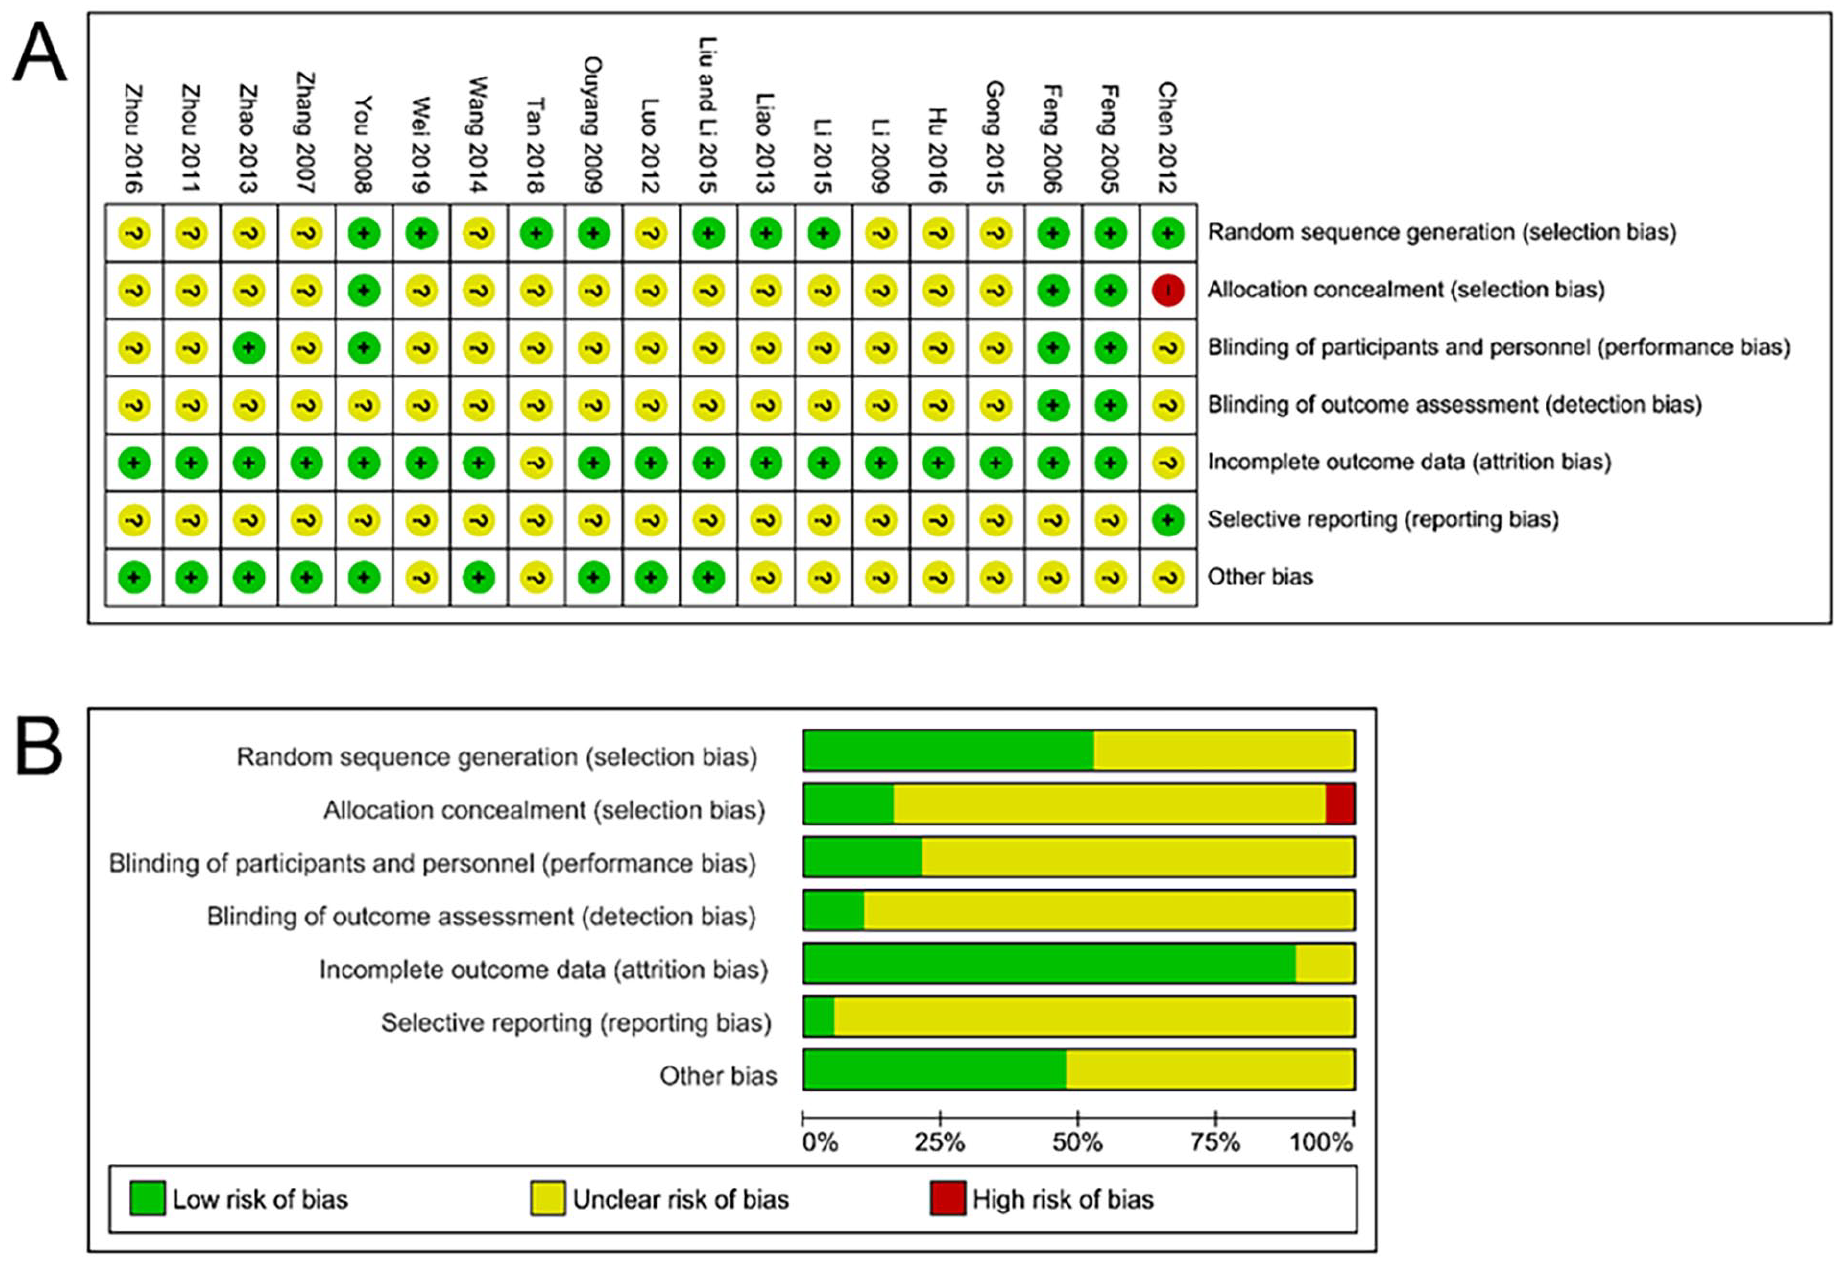
The risk of study bias. (A) Risk of bias summary. (B) Risk of bias graph.
Meta-Analysis of Disease Control Rate
For disease control rate, 14 studies were included, comprising 602 patients in experimental group and 519 controls. Heterogeneity analysis indicated no heterogeneity among studies. Therefore, fixed effects were employed (Figure 3A). Meta-analysis revealed that GS treatment improved disease control rate compared to controls (RR = 1.42, 95% CI [1.26, 1.60], P < .001; Figure 3A). Evaluation of funnel plots generated from the included studies displayed no noticeable irregularities, signifying the absence of publication bias (Supplemental Figure S5A).

Forest plot of meta-analysis of disease control rate (A) response rate(B) and life quality (C).
Subgroup analyses based on whether patients received TACE or other treatments were presented in Supplemental Figure S1A. In the TACE subgroup, GS treatment significantly enhanced disease control rate compared to controls (RR = 1.15, 95% CI [1.04, 1.27], P = .005; Supplemental Figure S1A), while in the “without TACE” subgroup, GS treatment improved disease control rate compared to controls (RR = 1.37, 95% CI [1.12, 1.67], P = .002; Supplemental Figure S1A).
Further subgroup based on components of GS was conducted (Supplemental Figure S1B). In the Rg3 subgroup, Rg3 treatment significantly enhanced the disease control rate compared to controls (RR = 1.23, 95% CI [1.14, 1.33], P < .001; Supplemental Figure S1B). Conversely, in the CK subgroup, CK treatment did not improve disease control rate (RR = 1.09, 95% CI [0.95, 1.24], P = .24; Supplemental Figure S1B), and in the Rh2 subgroup, Rh2 treatment failed to improve disease control rate (RR = 0.93, 95% CI [0.82, 1.05], P = .22; Supplemental Figure S1B).
Meta-Analysis of Objective Response Rate
For the analysis of objective response rate, 14 studies were included, comprising 603 patients in experimental group and 520 controls. Heterogeneity analysis suggested no significant heterogeneity among studies; therefore, fixed effects were employed (Figure 3B). Meta-analysis revealed that GS treatment improved objective response rate comparing with controls (RR = 1.20, 95% CI [1.09, 1.32], P < .001; Figure 3B). Evaluation of funnel plots generated from the included studies displayed no noticeable irregularities, indicating the absence of publication bias (Supplemental Figure S5B).
Subgroup analyses based on whether patients received TACE or other treatments were presented in Supplemental Figure S2A. In the TACE subgroup, GS treatment significantly enhanced objective response rate compared to controls (RR = 1.42, 95% CI [1.22, 1.65], P < .001; Supplemental Figure S2A), while in the “without TACE” subgroup, GS treatment also significantly improved the objective response rate compared to controls (RR = 1.39, 95% CI [1.12, 1.72], P = .003; Supplemental Figure S2A).
Further subgroup analyses based on components of GS were conducted (Supplemental Figure S2B). In the Rg3 subgroup, Rg3 treatment significantly improved objective response rate compared to controls (RR = 1.47, 95% CI [1.26, 1.71], P < .001; Supplemental Figure S2B). Conversely, in the CK subgroup, CK treatment failed to improve objective response rate (RR = 1.43, 95% CI [0.96, 2.13], P = .08; Supplemental Figure S2B), and in the Rh2 subgroup, Rh2 treatment did not improve objective response rate (RR = 1.19, 95% CI [0.95, 1.48], P = .13; Supplemental Figure S2B).
Meta-Analysis of Life Quality
For life quality, 7 studies were included, comprising 239 patients from experimental group and 237 controls. Heterogeneity analysis implied no significant heterogeneity among studies; therefore, fixed effects were employed (Figure 3C). GS treatment improved life quality compared to controls (RR = 1.49, 95% CI [1.23, 1.79], P < .001; Figure 3C). Evaluation of funnel plots generated from the included studies displayed no noticeable irregularities, indicating the absence of publication bias (Supplemental Figure S5C).
Subgroup analyses based on components of GS are presented in Supplemental Figure S3, with no heterogeneity detected in these subgroups (Supplemental Figure S3). In the Rg3 subgroup, Rg3 treatment significantly improved life quality compared to controls (RR = 1.38, 95% CI [1.12, 1.69], P = .002; Supplemental Figure S3). Conversely, in the CK subgroup, CK treatment failed to improve life quality (RR = 1.40, 95% CI [0.77, 2.53], P = .27; Supplemental Figure S3).
Meta-Analysis of Overall Survival
For the analysis of 6-month overall survival, 3 studies were included, comprising 215 patients from experimental group and 140 controls. Heterogeneity analysis implied no significant heterogeneity among studies. Therefore, fixed effects were employed (Figure 4A). However, GS treatment failed to improve 6-month overall survival rate compared to controls (RR = 1.07, 95% CI [0.99, 1.16], P = .09; Figure 4A). Evaluation of funnel plots generated from the included studies displayed no noticeable irregularities, signifying the absence of publication bias (Supplemental Figure S5D).
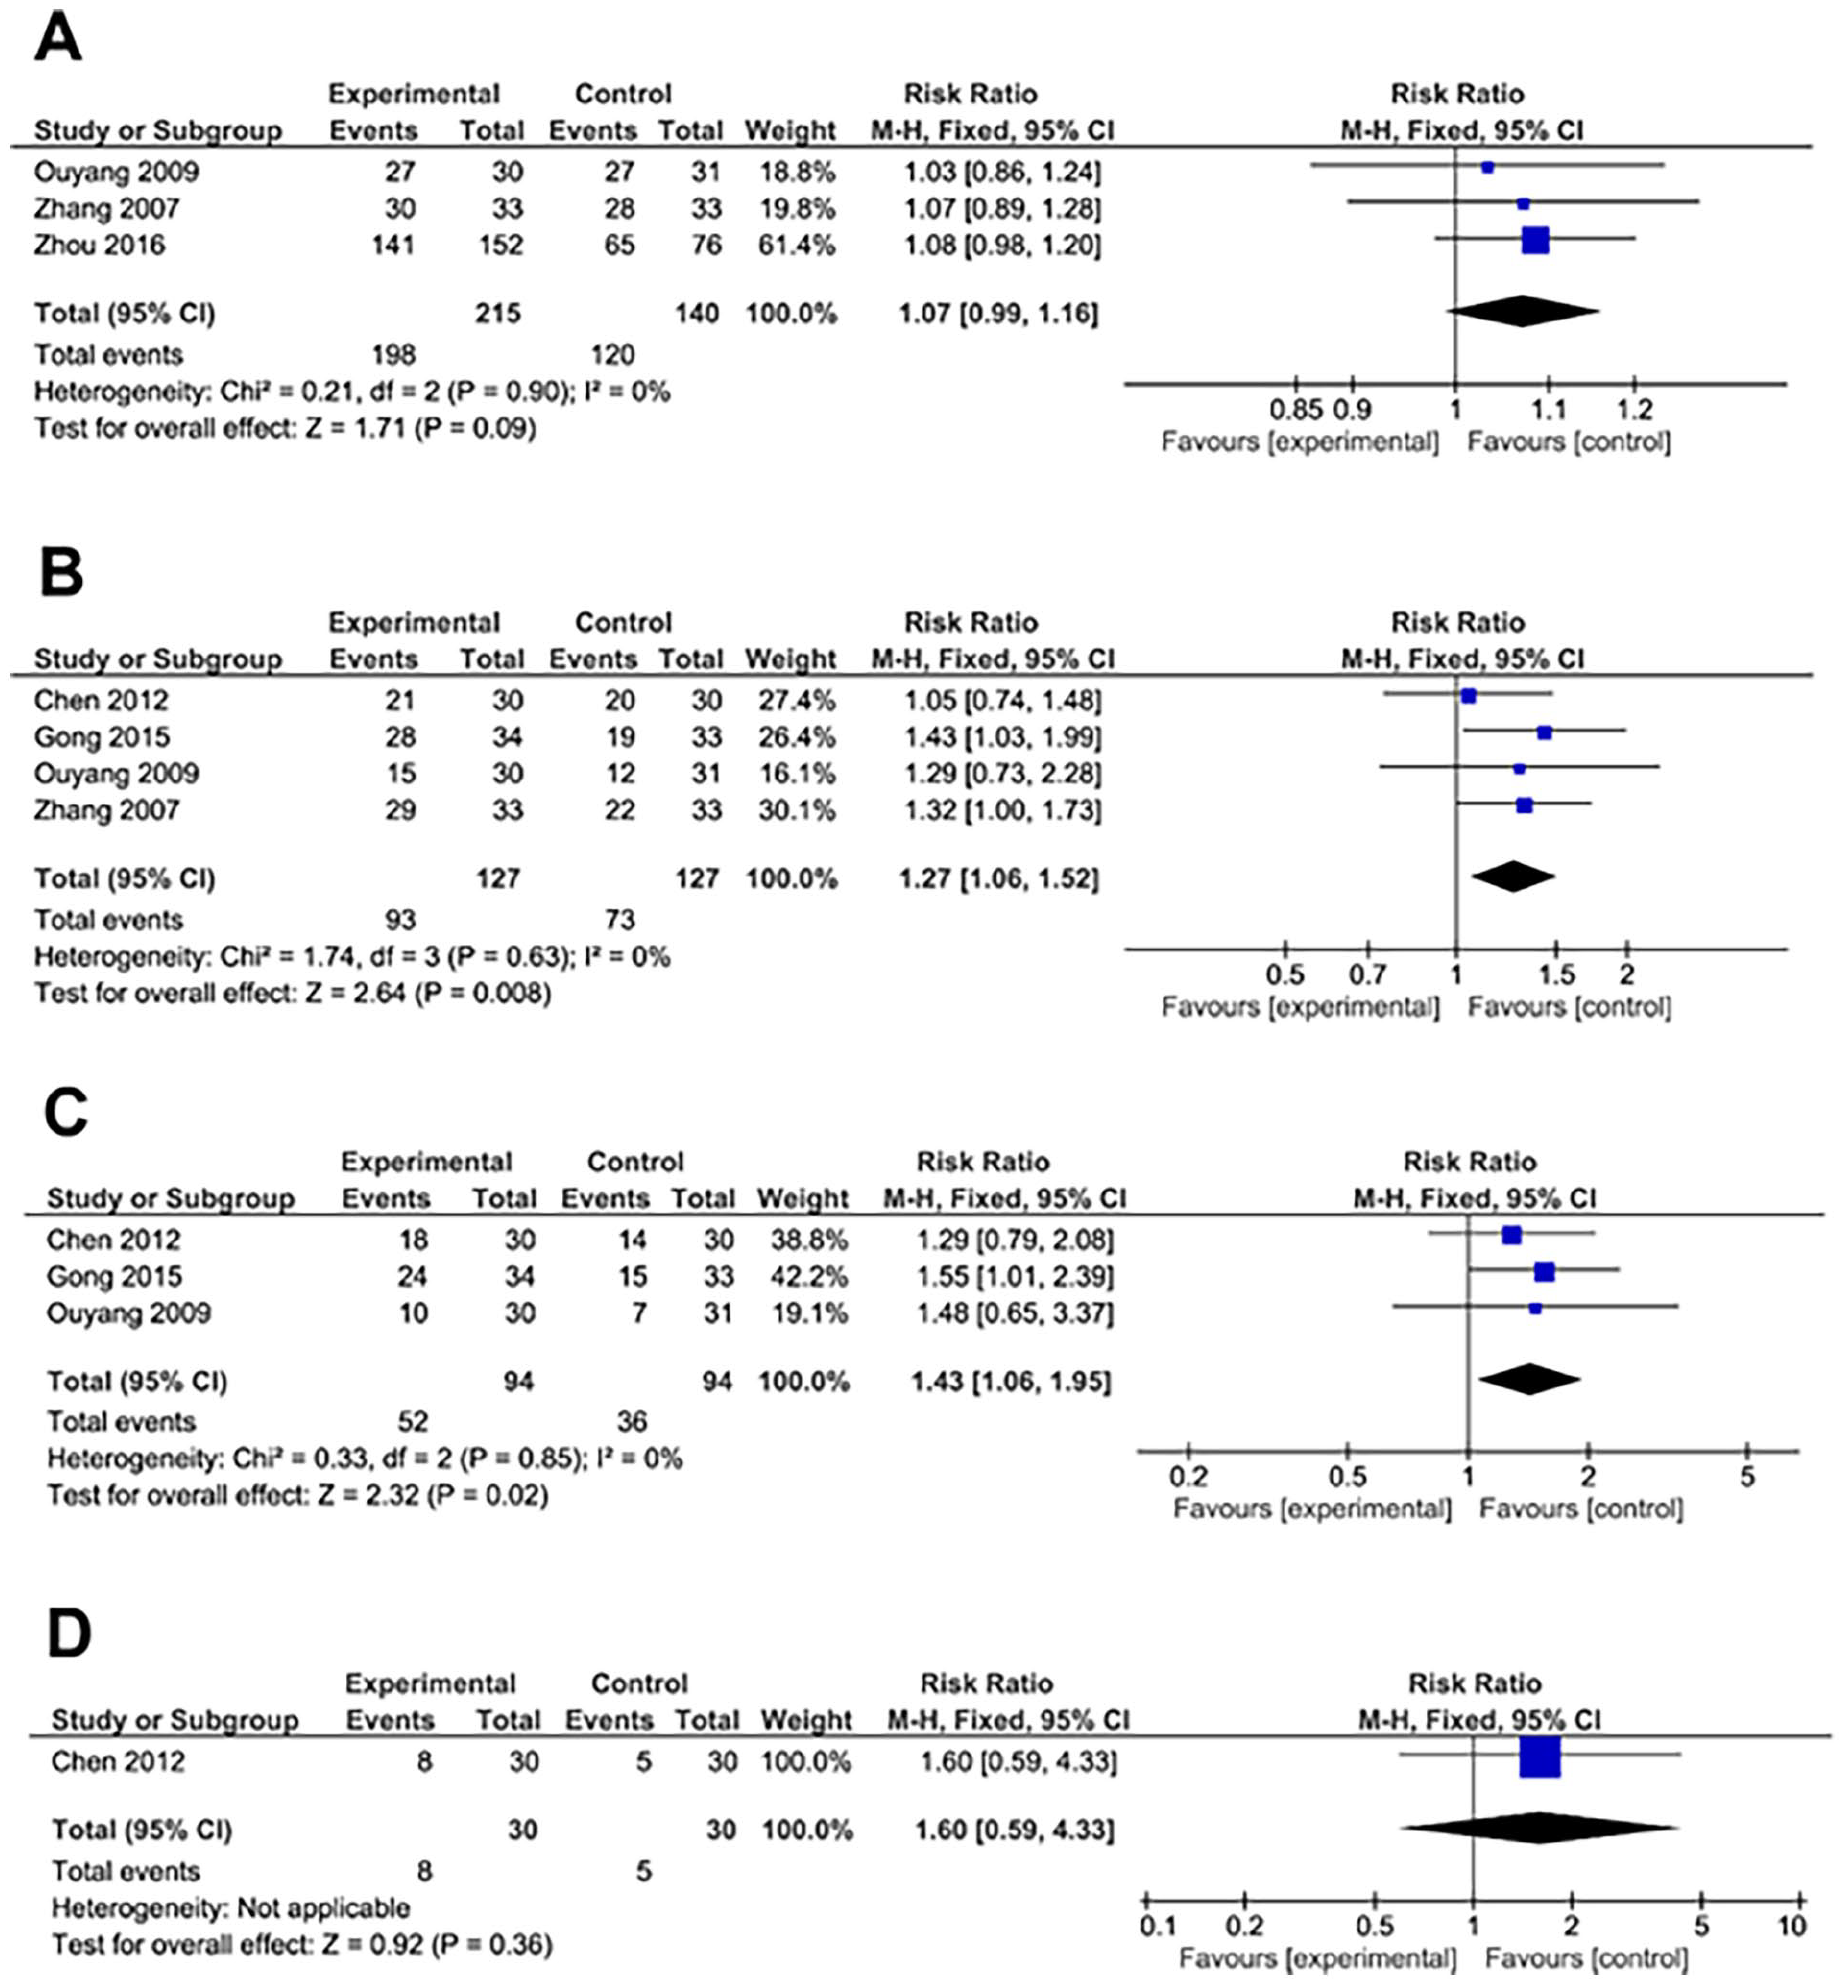
Forest plot of meta-analysis of 6-month overall survival rate (A), 1 year overall survival rate (B), 2 year overall survival rate (C) and 3 year overall survival rate (D).
For 1-year overall survival rate, 4 studies were included, comprising 127 patients from experimental group and 127 controls. Heterogeneity analysis implied no significant heterogeneity among studies. Therefore, fixed effects were employed (Figure 4B). In this analysis, GS treatment significantly improved 1-year overall survival rate compared to controls (RR = 1.27, 95% CI [1.06, 1.52], P = .008; Figure 4B). Evaluation of funnel plots generated from the included studies displayed no noticeable irregularities, signifying the absence of publication bias (Supplemental Figure S5E).
For 2-year overall survival rate, 3 studies were included, comprising 94 patients from experimental group and 94 controls. Heterogeneity analysis implied no significant heterogeneity among studies. Therefore, fixed effects were employed for the analysis (Figure 4C). In this analysis, GS treatment significantly improved 2-year overall survival rate compared to controls (RR = 1.43, 95% CI [1.06, 1.95], P = .02; Figure 4C). Evaluation of funnel plots generated from the included studies displayed no noticeable irregularities, indicating the absence of publication bias (Supplemental Figure S5F).
Regarding 3-year overall survival rate, only one study was included, with 30 patients from experimental group and 30 controls. However, GS treatment failed to improve 3-year overall survival rate compared to the control group (RR = 1.60, 95% CI [0.59, 4.33], P = .36; Figure 4D). Evaluation of funnel plots generated from the included studies displayed no noticeable irregularities, signifying the absence of publication bias (Supplemental Figure S5G).
Meta-Analysis of Nausea and Vomiting
For nausea and vomiting, 11 studies were included, comprising 477 patients from experimental group and 396 controls. Heterogeneity analysis indicated no significant heterogeneity among the included studies. Therefore, fixed effects were employed (Figure 5A). The meta-analysis demonstrated that GS treatment significantly reduced nausea and vomiting comparing with controls (RR = 0.66, 95% CI [0.57, 0.77], P < .001; Figure 5A). Evaluation of funnel plots generated from the included studies displayed no noticeable irregularities, indicating the absence of publication bias (Supplemental Figure S5H).

Forest plot of meta-analysis of nausea and vomiting (A), anorexia (B), leukopenia (C), and myelosuppression (D).
Subgroup analyses based on whether patients received TACE or other treatments were presented in Supplemental Figure S4A. In the TACE subgroup, GS treatment significantly reduced nausea and vomiting compared to controls (RR = 0.66, 95% CI [0.57, 0.77], P < .001; Supplemental Figure S4A). However, in the “without TACE” subgroup, GS failed to reduce nausea and vomiting compared to controls (RR = 0.22, 95% CI [0.28, 1.33], P = .22; Supplemental Figure S4A).
Further subgroup analyses based on components of GS were conducted (Supplemental Figure S4B). In the Rg3 subgroup, Rg3 treatment significantly reduced nausea and vomiting compared to controls (RR = 0.67, 95% CI [0.57, 0.79], P < .001; Supplemental Figure S4B). Similarly, in the Rh2 subgroup, Rh2 treatment also significantly reduced nausea and vomiting compared to controls (RR = 0.61, 95% CI [0.46, 0.82], P = .001; Supplemental Figure S4B).
Meta-Analysis of Anorexia
For anorexia, 2 studies were included, comprising 182 patients from experimental group and 106 controls. Heterogeneity analysis indicated no significant heterogeneity among studies; therefore, fixed effects were employed (Figure 5B). Meta-analysis demonstrated that GS reduced anorexia comparing with controls (RR = 0.33, 95% CI [0.21, 0.50], P < .001; Figure 5B). Evaluation of funnel plots generated from the included studies displayed no noticeable irregularities, indicating the absence of publication bias (Supplemental Figure S5I).
Meta-Analysis of Leukopenia
For leukopenia, 4 studies were included, comprising 263 patients from experimental group and 183 controls. Heterogeneity analysis indicated no significant heterogeneity among studies. Therefore, fixed effects were employed (Figure 5C). Meta-analysis revealed that GS reduced leukopenia compared to controls (RR = 0.55, 95% CI [0.46, 0.67], P < .001; Figure 5C). Evaluation of funnel plots generated from the included studies displayed no noticeable irregularities, indicating the absence of publication bias (Supplemental Figure S5J).
Meta-Analysis of Myelosuppression
For myelosuppression, 5 studies were included, comprising 179 patients from experimental group and 177 controls. Heterogeneity analysis suggested no significant heterogeneity among studies. Therefore, fixed effects were employed (Figure 5D). Meta-analysis revealed that GS treatment significantly reduced myelosuppression compared to controls (RR = 0.54, 95% CI [0.40, 0.74], P < .001; Figure 5D). Evaluation of funnel plots generated from the included studies displayed no noticeable irregularities, indicating the absence of publication bias (Supplemental Figure S5K).
Meta-Analysis of AFP and ALT
For AFP, 3 studies were included, comprising 105 patients from experimental group and 105 controls. Heterogeneity analysis showed significant heterogeneity among studies. Therefore, random effects were employed (Figure 6A). Meta-analysis revealed that GS treatment had no effects on AFP comparing with controls (RR = 1.78, 95% CI [0.69, 4.60], P = .23; Figure 6A). Evaluation of funnel plots generated from the included studies displayed no noticeable irregularities, signifying the absence of publication bias (Supplemental Figure S5L).

Forest plot of meta-analysis of AFP (A) and ALT (B).
For ALT, 5 studies were included, comprising 168 patients from experimental group and 168 controls. Heterogeneity analysis showed no significant heterogeneity among studies. Therefore, fixed effects were employed (Figure 6B). Meta-analysis revealed that GS treatment reduced ALT compared to controls (RR = 0.76, 95% CI [0.58, 0.98], P = .04; Figure 6B). Evaluation of funnel plots generated from the included studies displayed no noticeable irregularities, indicating the absence of publication bias (Supplemental Figure S5M).
Meta-Analysis of CD3+, CD4+, NKC, and CD4+/CD8+ Ratio
For CD3+, 2 studies were included comprising 55 patients from experimental group and 55 controls. Heterogeneity analysis showed heterogeneity among studies. Therefore, random effects were employed (Figure 7A). Meta-analysis revealed that GS treatment increased CD3+ levels compared to controls (MD = 8.81, 95% CI [3.91, 13.71], P < .001; Figure 7A). Evaluation of funnel plots generated from the included studies displayed no noticeable irregularities, indicating the absence of publication bias (Supplemental Figure S5N).

Forest plot of meta-analysis of CD3+ (A), CD4+ (B), NKC (C), and CD4+/CD8+ ratio (D).
For CD4+, 2 studies were included, comprising 55 patients from experimental group and 55 controls. Heterogeneity analysis indicated no heterogeneity. Therefore, fixed effects were employed (Figure 7B). Meta-analysis revealed that GS treatment increased CD4+ levels compared to controls (MD = 9.38, 95% CI [8.04, 10.72], P < .001; Figure 7B). Evaluation of funnel plots generated from the included studies displayed no noticeable irregularities, indicating the absence of publication bias (Supplemental Figure S5O).
For NKC, 2 studies were included, comprising 55 patients from experimental group and 55 controls. Heterogeneity analysis showed no significant heterogeneity among studies. Therefore, fixed effects were employed (Figure 7C). Meta-analysis revealed that GS treatment increased NKC ratio compared to controls (MD = 8.00, 95% CI [6.76, 9.24], P < .001; Figure 7C). Evaluation of funnel plots generated from the included studies displayed no noticeable irregularities, indicating the absence of publication bias (Supplemental Figure S5P).
For CD4+/CD8+ ratio, 2 studies were included, comprising 55 patients from experimental group and 55 controls. Heterogeneity analysis showed no heterogeneity among. Therefore, fixed effects were employed (Figure 7D). Meta-analysis revealed that GS treatment increased CD4+/CD8+ ratio compared to controls (MD = 0.50, 95% CI [0.47, 0.57], P < .001; Figure 7D). Evaluation of funnel plots generated from the included studies displayed no noticeable irregularities, indicating the absence of publication bias (Supplemental Figure S5Q).
Liver Function
For the analysis of Child-Pugh in A level, 6 studies were included, comprising 173 patients from experimental group and 173 controls. Heterogeneity analysis indicated no significant heterogeneity among the included studies; therefore, fixed effects were employed (Figure 8A). Meta-analysis revealed that GS treatment increased proportions of patients with Child-Pugh in A level compared to controls (RR = 1.59, 95% CI [1.08, 2.34], P = .02; Figure 8A). Evaluation of funnel plots generated from the included studies displayed no noticeable irregularities, indicating the absence of publication bias (Supplemental Figure S5R).

Forest plot of meta-analysis of Child-Pugh in A level (A), Child-Pugh in B level (B) and Child-Pugh in C level (C).
For Child-Pugh in B level, 6 studies were included, comprising 173 patients from experimental group and 173 controls. Heterogeneity analysis indicated no significant heterogeneity; therefore, fixed effects were employed (Figure 8B). Meta-analysis revealed that GS treatment increased proportions of patients with Child-Pugh in B level compared to controls (RR = 1.28, 95% CI [1.08, 1.52], P = .004; Figure 8B). Evaluation of funnel plots generated from the included studies displayed no noticeable irregularities, indicating the absence of publication bias (Supplemental Figure S5S).
For Child-Pugh in C level, 6 studies were included, comprising 173 from experimental group and 173 controls. Heterogeneity analysis indicated no significant heterogeneity. Therefore, fixed effects were employed (Figure 8C). In this analysis, GS treatment decreased proportions of patients with Child-Pugh in C level compared to controls (RR = 0.43, 95% CI [0.27, 0.68], P < .001; Figure 8C). Evaluation of funnel plots generated from the included studies displayed no noticeable irregularities, indicating the absence of publication bias (Supplemental Figure S5T).
Discussion
HCC is a prevalent malignant tumor of the digestive system, often manifesting insidiously without apparent symptoms in its early stages.2,40 By the time patients typically seek medical attention, the disease has usually progressed to intermediate or advanced stages, thus missing the optimal treatment window and resulting in a grim prognosis.2,40 The incidence-to-mortality ratio stands at 1:0.9, with a 5-year overall survival of ~18% in North American countries and regions, and a mere 12.1% in China, posing a grave threat to patients’ health and survival.2,40 This study conducted a meta-analysis to assess efficacy and safety of GS as an adjuvant therapy for HCC. The evaluation of outcome indicators is a prominent focus in international clinical medical research. When appraising treatment efficacy for diseases, internationally and domestically recognized outcome indicators should ideally be utilized to authentically reflect the study’s conclusions. 41 This study extracted all efficacy indicators from 19 included studies, encompassing treatment effectiveness rate, disease control rate, increased overall survival rate, quality of life, adverse reactions to anti-cancer drugs, liver function improvement and immune indicators (CD3+, CD4+, CD4+/CD8+ ratio, and NKC), which collectively represent current clinical efficacy evaluation indicators for HCC.
Our findings revealed that: (i) GS in combination with Western medicinal methods can effectively improve objective response rate and disease control rate; (ii) significant differences were noted in overall survival rate comparisons between the treatment and control groups, suggesting that GS can augment the 1-year, 2-year, and overall survival rates of intermediate and advanced liver cancer patients, albeit without statistical significance in the 6-month and 3-year overall survival periods; (iii) life quality, assessed using KPS score, indicated that GS notably enhances patient quality of life. (iv) Regarding adverse reactions, results exhibited notable differences in adverse reactions between the treatment and control groups, suggesting that GS can significantly mitigate the incidence of adverse reactions induced by anti-cancer drugs and TACE. (v) TACE has been shown to compromise liver function, particularly in Chinese liver cancer patients, most of whom have hepatitis B, rendering them vulnerable to this treatment.42 -44 This can lead to liver parenchymal damage, diminished liver compensatory function, and even liver atrophy, affecting patient treatment and long-term survival. Liver function assessment in this study employed the Child-Pugh classification evaluation method, with improvement, stability, and reduction serving as outcome indicators for efficacy evaluation. Statistical analysis unveiled significant differences in improvement, stability, and reduction between the treatment and control groups, indicating that GS can ameliorate and stabilize liver function impairment caused by TACE/chemotherapy and deter liver function deterioration. (vi) Qualitative analysis of alanine aminotransferase (ALT) displayed a statistically significant difference between the treatment and control groups, implying that ginsenosides aid in reducing ALT levels.
Ginsenoside Rg3, a trace compound of tetracyclic triterpene saponin found in ginseng, was initially identified at the molecular level by the esteemed Japanese pharmacist Kunio Hikino. 45 Subsequent research has uncovered its pharmacological effects, particularly its selective inhibition of tumor cell infiltration and metastasis. Basic experimental studies have demonstrated that ginsenoside Rg3 may hinder HepG2 cell progression by down-regulating the expression of alginate transferase IV. 46 Additionally, it inhibits neovascularization in liver cancer and modulates immunity, exhibiting inhibitory effects on mouse liver cancer xenografts. 47 Through down-regulating Bcl-2, up-regulating Bax, and activating caspase-3, Rg3 triggers apoptosis in human liver cancer cells. 48 By up-regulating caspase-3, down-regulating survivin, and reducing vascular endothelial growth factor, Rg3 induces apoptosis of mouse liver cancer cells and inhibits blood vessel formation in mouse liver cancer xenografts. 48 Moreover, combining ginsenoside Rg3 with oxaliplatin and sorafenib can expedite the apoptosis of human liver cancer cells. 48 Rg3 and sorafenib alleviate HCC progression by regulating HK2-mediated PI3K/Akt pathway. 46 Ginsenoside Rh2, another active component of GS, has also shown promise in inhibiting hepatocellular carcinoma. Yang et al demonstrated that ginsenoside Rh2 inhibits HCC through β-catenin and autophagy. 49 Additionally, ginsenoside Rh2 has been found to suppress HCC progression by modulating CDKN2A-2B by targeting EZH2. 50 Xu et al revealed that ginsenoside Rh2 inhibits HCC by suppressing angiogenesis and GPC3-mediated Wnt/β-catenin signaling pathway. 51 Ginsenoside compound K exerted apoptotic effects in HCC cells via Akt/mTOR/c-Myc signaling pathway 52 ; Zhang et al showed that ginsenoside CK inhibited hypoxia-induced HCC EMT through HIF-1α/NF-κB singaling pathway. 53 Recently, Zhang et al showed that CK ameliorated hepatic lipid accumulation via activating LKB1/AMPK pathway. 54 These results indicate that active components of ginsenosides showed the promising anti-tumor effects, while the underlying molecular mechanisms remain to be explored. Clinical studies have demonstrated that incorporating ginsenoside Rg3 as the primary ingredient in San Yi capsules alongside transarterial chemoembolization (TACE), surgery, and chemotherapy in HCC management can enhance clinical effectiveness, increase patient overall survival rates, improve life quality, and mitigate the occurrence of adverse reactions.24,25,27,30,34,36,37
This study has certain limitations: (1) The inclusion of 9 studies did not specify blinding methods, and most studies did not detail specific randomization methods. (2) The number of studies for each outcome indicator was fewer than 10, precluding analysis for publication bias. (3) There were a limited number of studies included for each outcome indicator, with a small sample size in each study, resulting in a restricted total sample size for meta-analysis. (4) There was a lack of reporting on progression-free survival, making it impossible to analyze progression-free survival of GS combined with Western medicine treatment for HCC.
Conclusions
In summary, GS combined with Western medicine methods (TACE, surgery, chemotherapy) for the treatment of primary liver cancer can improve clinical efficacy, increase overall survival rates, enhance patient life quality, and reduce the occurrence of bone marrow suppression adverse reactions. However, owing to generally low quality of included studies, more large-sample, multicenter, high-quality, RCTs are warranted to further validate these results.
Supplemental Material
sj-docx-1-ict-10.1177_15347354241293790 – Supplemental material for Evaluation of the Efficacy, Safety, and Clinical Outcomes of Ginsenosides as Adjuvant Therapy in Hepatocellular Carcinoma: A Meta-Analysis and Systematic Review
Supplemental material, sj-docx-1-ict-10.1177_15347354241293790 for Evaluation of the Efficacy, Safety, and Clinical Outcomes of Ginsenosides as Adjuvant Therapy in Hepatocellular Carcinoma: A Meta-Analysis and Systematic Review by Renjie Zhang, Yiling Liao, Yuan Gao, Hengyu Tian, Shenfeng Wu, Qingteng Zeng, Qinghua He, Ruikun Zhang, Chunshan Wei and Jialin Liu in Integrative Cancer Therapies
Footnotes
Acknowledgements
None.
Authors’ Contributions
RZ and YL collected the data and performed the analysis; YG, HT, SW, QZ, QH, RZ, and CW prepared the tables and figures; RZ, JL and CW review and edited the manuscript; RZ and JL wrote the manuscript; JL conceptualized the whole study. All the authors approved the manuscript for submission.
Data Availability
All the data are available upon request.
Declaration of Conflicting Interests
The author(s) declared no potential conflicts of interest with respect to the research, authorship, and/or publication of this article.
Funding
The author(s) disclosed receipt of the following financial support for the research, authorship, and/or publication of this article: This study was supported by Shenzhen Science and Technology Program (No. JCYJ20220531092202006).
Ethical Statement
Not applicable.
Supplemental Material
Supplemental material for this article is available online.
References
Supplementary Material
Please find the following supplemental material available below.
For Open Access articles published under a Creative Commons License, all supplemental material carries the same license as the article it is associated with.
For non-Open Access articles published, all supplemental material carries a non-exclusive license, and permission requests for re-use of supplemental material or any part of supplemental material shall be sent directly to the copyright owner as specified in the copyright notice associated with the article.