
Abstract
This study aims to evaluate the performance of an innovative in-shoe sensing device against the FScan system. Across five trials, the novel device demonstrated consistently strong correlations with FScan peak pressure readings (r = 0.801, r = 0.978, r = 0.813, r = 0.887, r = 0.944). Superimposed peak-pressure plots revealed highly similar waveform patterns between the two systems. Error-based metrics also supported this equivalence. Root Mean Squared Logarithmic Error values similarly suggested consistent predictive agreement. Temperature-sensing performance was assessed by comparing in-shoe sensor readings by the novel device with thermal-camera measurements. The thermal camera detected an average temperature change of 3.7°C, whereas the in-shoe sensor recorded an average change of 0.67°C. There was substantial variability in both systems, with higher variation observed in the in-shoe sensor than in the thermal camera. Despite variability, temperature and pressure measurements from the novel device were strongly correlated (r = 0.87). In conclusion, the new device provides pressure measurements comparable to the FScan system and appears promising for monitoring foot health.
Keywords
Diabetic foot ulcers (DFUs) represent one of the most severe and costly complications of diabetes mellitus, affecting up to 25% of individuals with diabetes over their lifetime and accounting for the majority of non-traumatic lower-limb amputations worldwide. 1 DFUs are associated with substantial morbidity, impaired quality of life, increased mortality, and significant healthcare expenditure. Despite advances in diabetes management, prevention of DFUs remains challenging, largely due to the multifactorial pathophysiology involving peripheral neuropathy, altered biomechanics, repetitive mechanical stress, and impaired tissue perfusion.
Several longitudinal studies have demonstrated that a focal increase in plantar skin temperature can precede ulcer formation up to a week prior to tissue breakdown, offering a valuable window for preventive intervention.2,3 Similarly, abnormal plantar pressure distributions during gait have been strongly linked to ulcer formation and recurrence. 4 However, the correlation between skin temperature and plantar pressures, and their role in the causation of diabetic foot ulcers, has only been investigated in a limited number of studies.5,6 Collectively, these findings suggest that combined assessment of plantar pressure and temperature may provide complementary and clinically meaningful biomarkers for DFU risk stratification. 7
To date, the clinician obtains temperature and pressure data separately using a thermographic camera and an in-shoe pressure device, a technique which can result as both expensive and time consuming, with both devices imposing high financial costs and lengthy assessment durations in clinical settings. A systematic review has identified that only a small number of studies (n = 5) investigated an in-shoe device built to measure both temperature and pressure simultaneously. Moreover, current evidence of a such an innovative device is not robust enough to confirm the reliability and validity such devices. 7
Consequently, a critical knowledge gap remains regarding the availability of a compact, affordable, and easy to use in-shoe system capable of simultaneously measure in-shoe plantar pressure and in-shoe skin temperature, while providing validated, site-specific data relevant to ulcer prevention. The clinical question guiding this study is whether the compact in-shoe pressure and temperature measuring device, specifically developed by the authors of this study, functions accurately when measuring pressure and temperature at anatomically relevant sites during gait, and that is comparable to established reference standards. We hypothesize that the proposed system will demonstrate strong agreement with gold-standard measurements and that its output will be facilitate clinical interpretation in a feasible manner for routine monitoring of the diabetic high-risk foot.
Materials and Methods
System Hardware
The in-shoe pressure and temperature measuring device was designed to combine portability, ease-of-use and functionality making it ideal for the measurement of both pressure and temperature at targeted anatomical landmarks within the shoe.
The wireless feature of this device permits the user to transmit the data collected to a personal computer on an online cloud which can be assessed solely by the user via the multi-purpose web-based dashboard. It also features the possibility to communicate with a smart phone application via Bluetooth permitting the user to carry out the assessment to the setting of choice such as clinical, laboratory or any other environment.
The device measures 60 mm in width, 75 mm in length and 10 mm in height giving its case a squarish and compact ensemble which makes it ideal to fit inconspicuously in pockets or over the shoe (Figure 1). Within the case of the device, the entire electronic components are hosted. This includes an operational amplifier, resistors, capacitors, and a microcontroller. Both pressure and temperature sensors extend from it so that only the sensors are placed under the desired anatomical landmark on the plantar aspect of the foot.
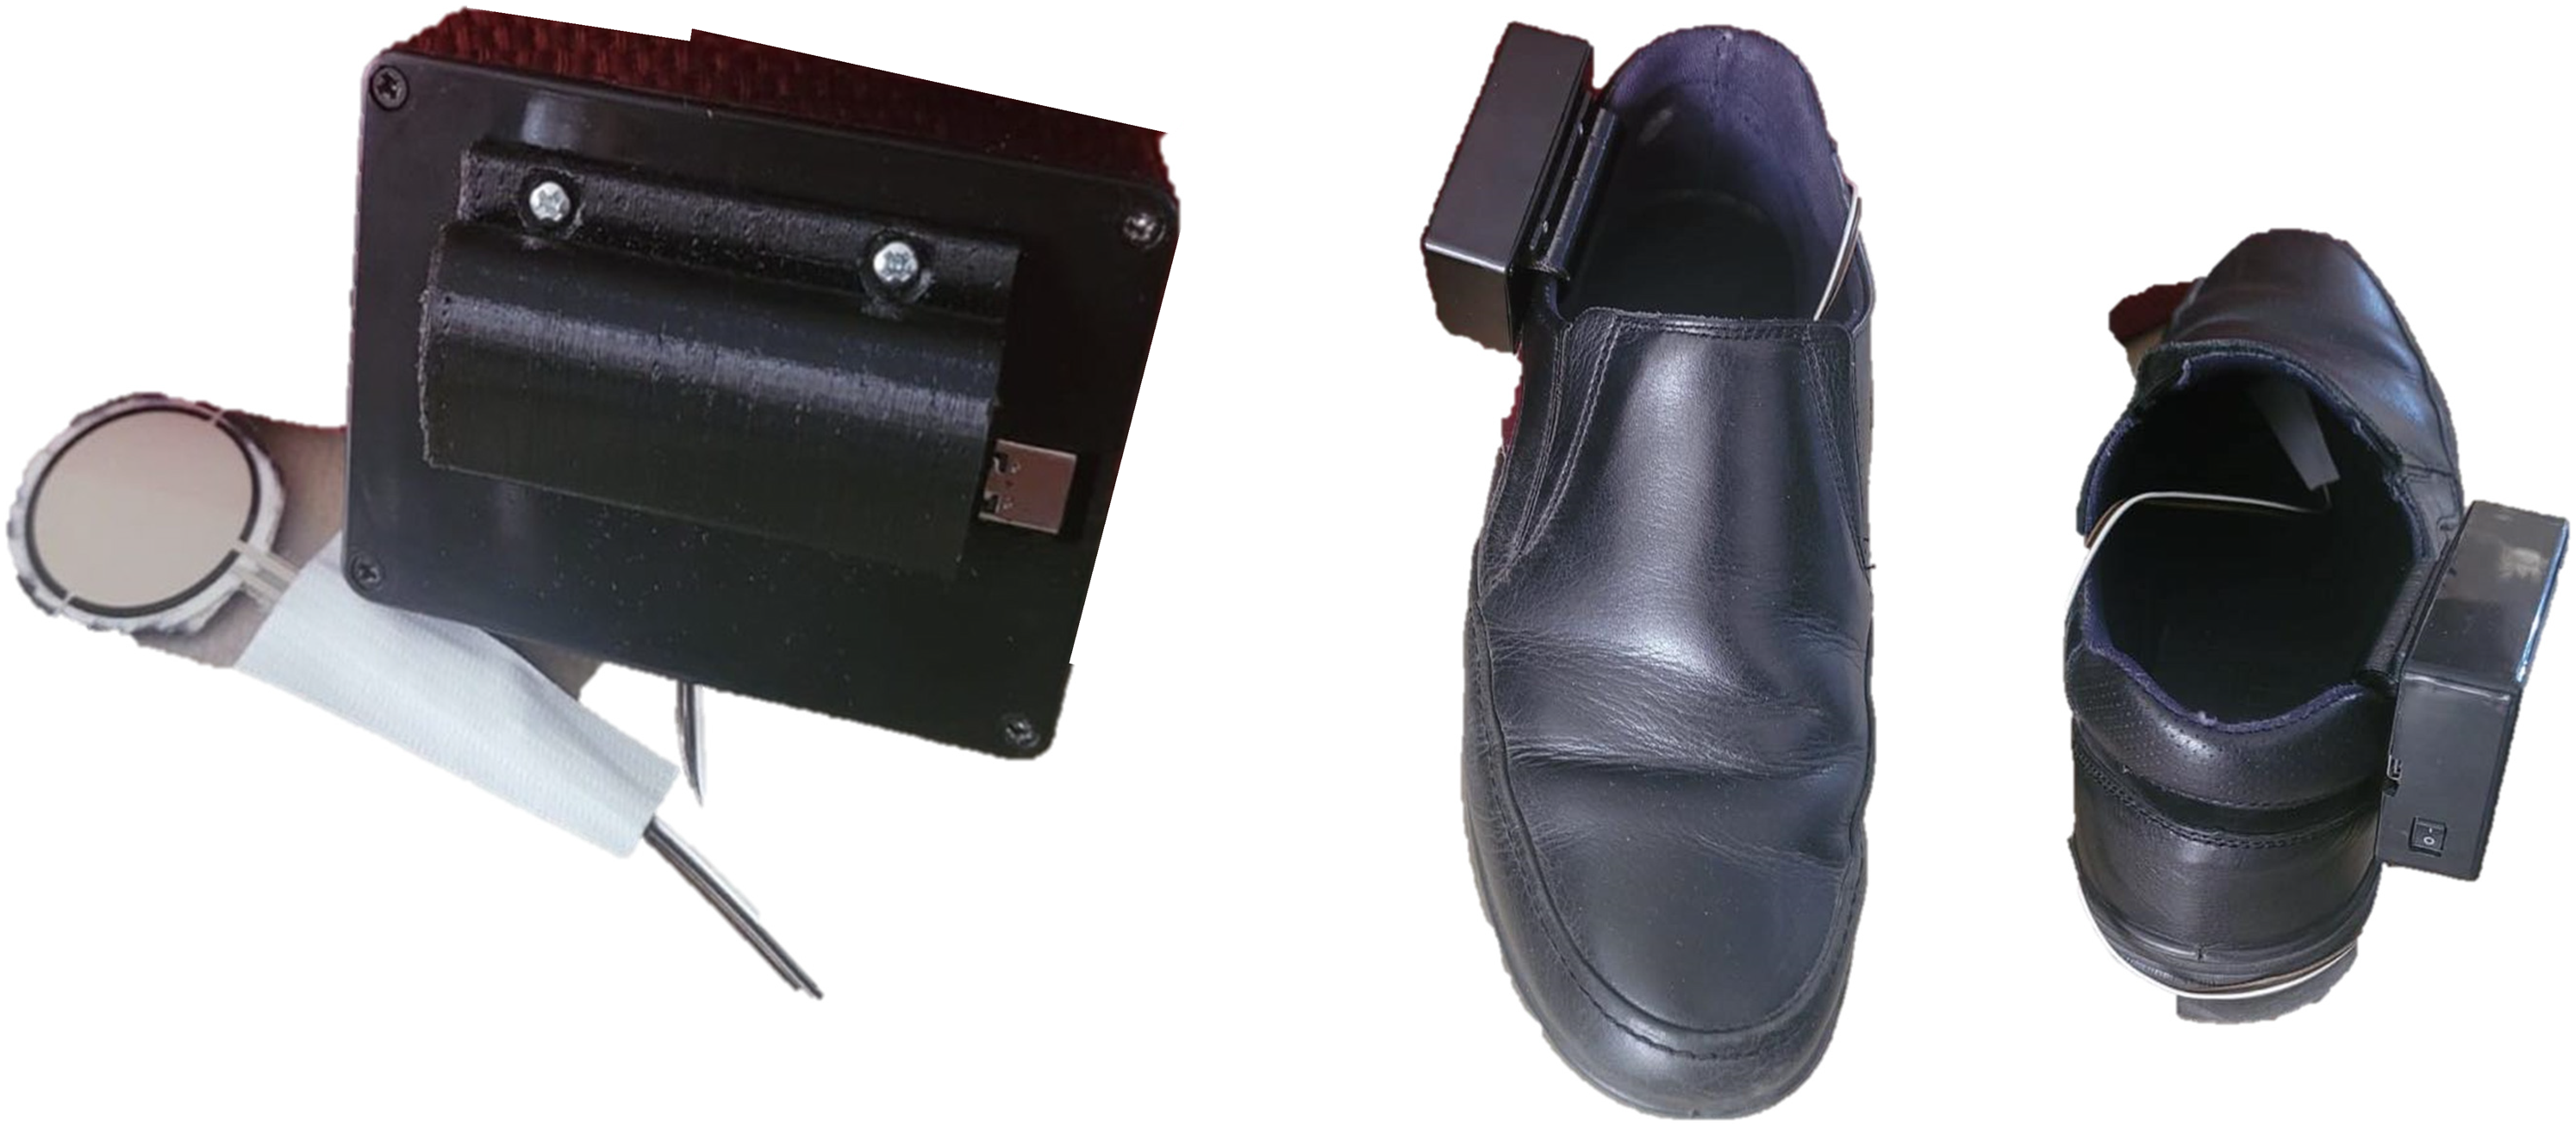
Prototype of the in-shoe pressure and temperature measuring device.
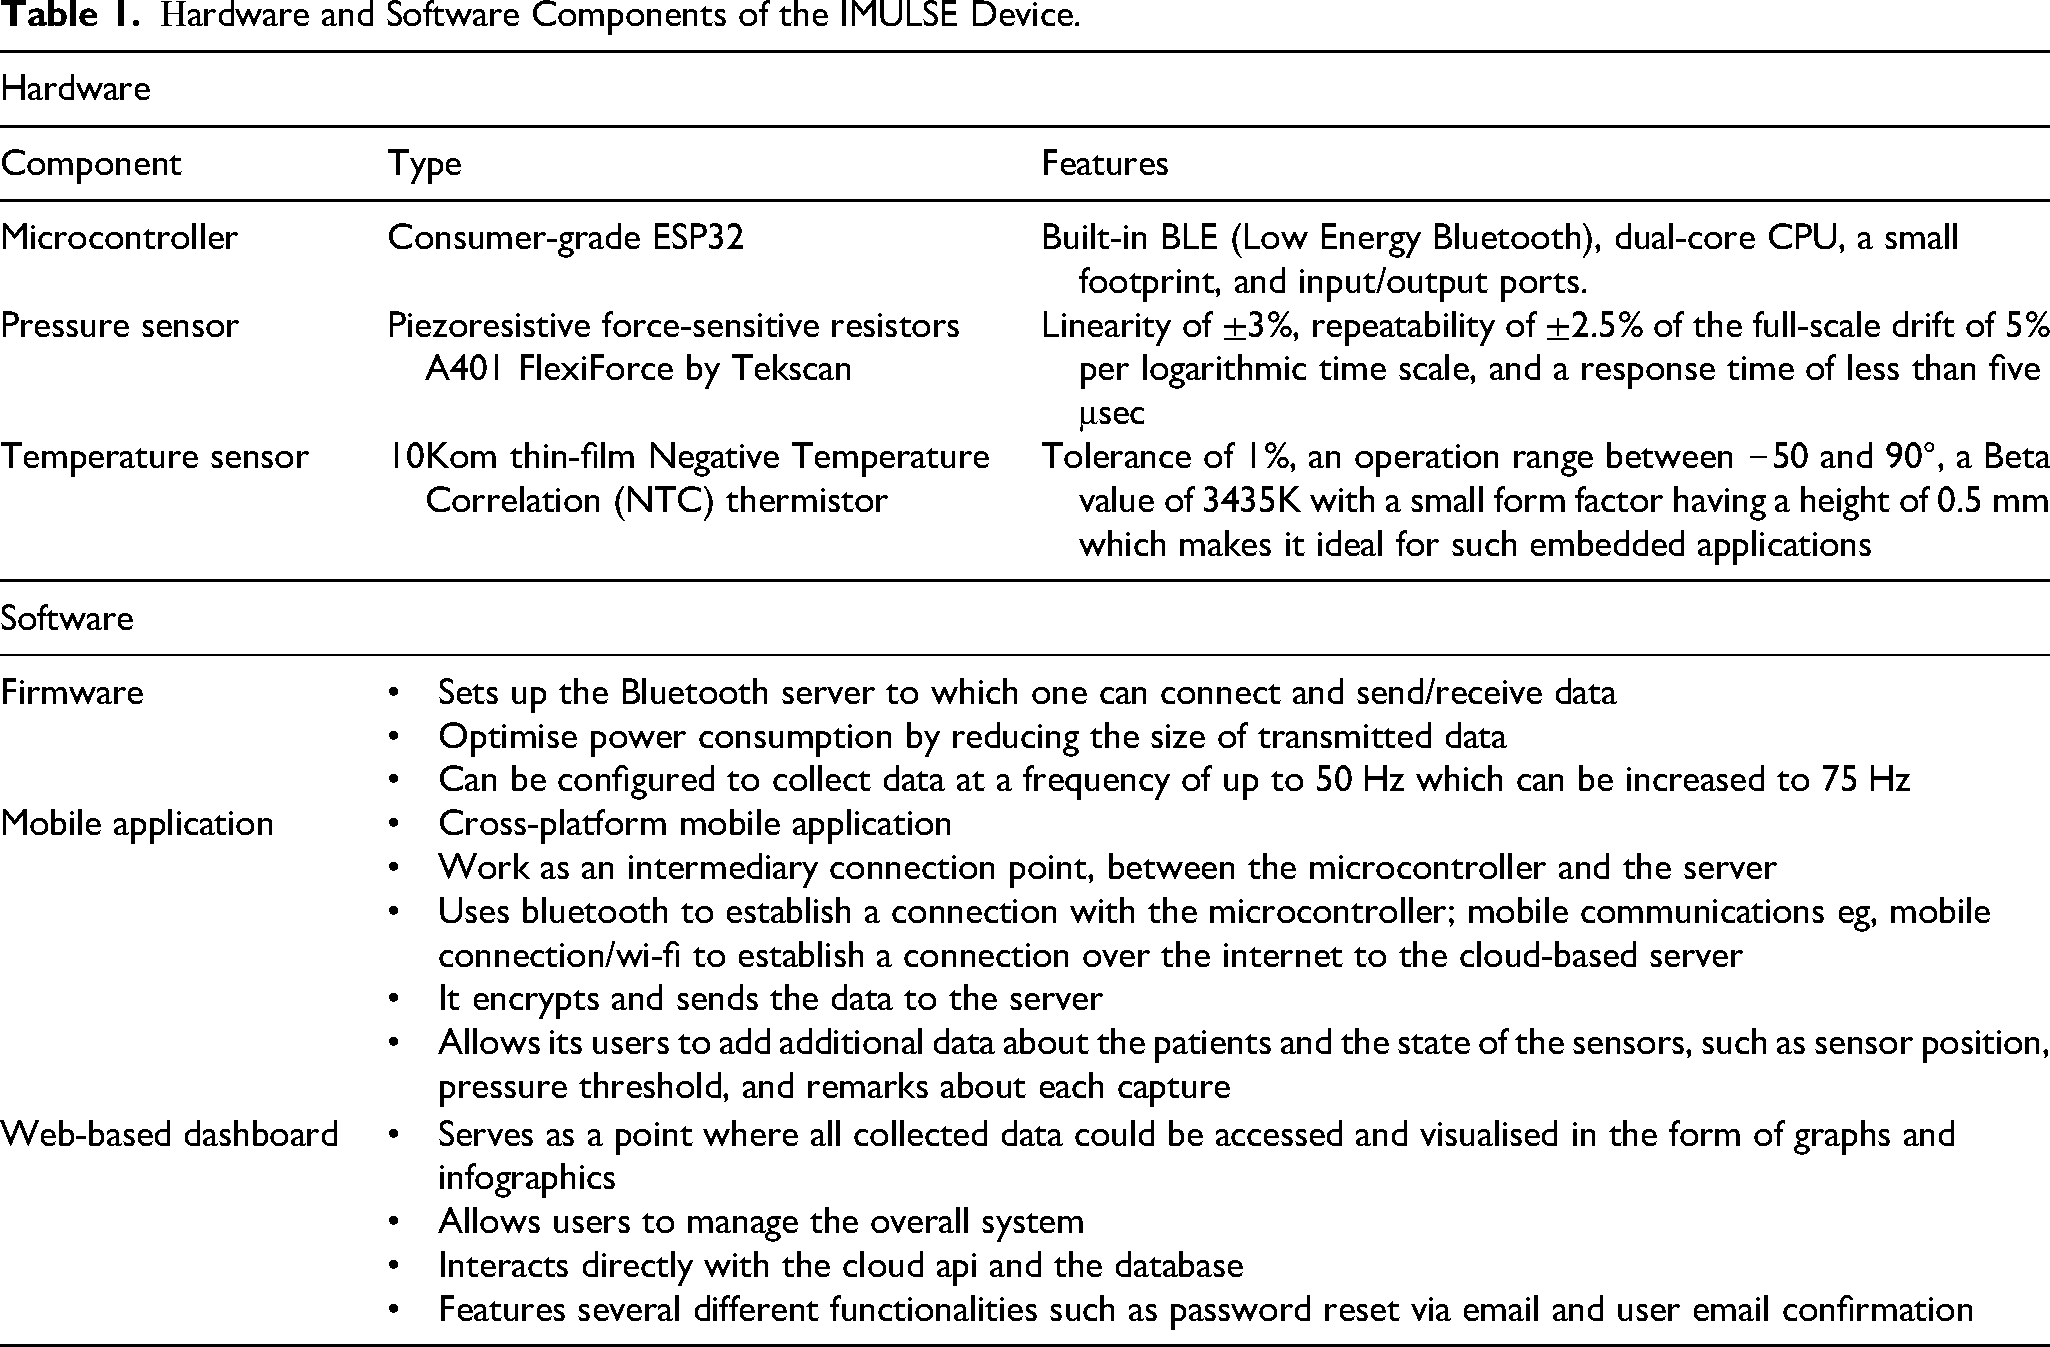
The device employs a consumer-grade ESP32 microcontroller as its central processing unit CPU which offers a built-in BLE (Low Energy Bluetooth) interface along with additional features such as a dual-core CPU, a small footprint, and a sufficient number of input/output ports. An external hat was designed to host up to 1 temperature sensor and 1 pressure sensors along with the additional circuit required to operate the sensors.
As pressure sensor, this system uses piezoresistive force-sensitive resistors specifically the “A401 FlexiForce” manufactured by Tekscan. The selected pressure sensor features linearity of ±3%, repeatability of ±2.5% of the full-scale drift of 5% per logarithmic time scale, and a response time of less than five μsec.
Additionally, a 10Kom thin-film Negative Temperature Correlation (NTC) thermistor is used to measure temperature. The selected sensor features a tolerance of 1%, an operation range between −50 and 90°C, a Beta value of 3435 K with a small form factor having a height of 0.5 mm which makes it ideal for such embedded applications.
Sensor Fusion
One of the main objectives of this device is to measure temperature and pressure from a Citrine area simultaneously while maintaining a flat surface to avoid creating any bumps that could result in generating more pressure within that area and/or cause damages to the pressure sensor or effect the data measured by that sensor. To satisfy that objective a PUCK concept was introduced which is basically a 1 mm high 3D printed disc which features a 0.5 mm engraving that houses the temperature sensor.
Mobile application provides an interface to control and manage the device via Bluetooth and stores collected data in the database hosted on cloud server. The web-based dashboard is multi-functional and displays collected data in the form of graphs and visualizations and allows users to manage the system and perform operations such as, adding devices and users, searching of data. Hardware components are summarised in Table 1.
Ηardware and Software Components of the IMULSE Device.
Calibration Procedures
Pressure sensors were calibrated using a pressure generating rig, the F-Scan System from Tekscan, and the developed novel device. The former was used to record pressure readings and to establish a baseline for readings recorded by the novel device. A total of 22 pressure values were recorded with 200 samples each. Exploratory data analysis examined the behaviour of the novel device at different pressure points over a period of time. Pre-processing and data cleaning were also performed to remove any anomalies detected in recorded data. These aimed to ensure data reliability and to avoid effects by other factors. The Gird-Search algorithm was used in the hyperparameter tuning process. The best combination of parameters had a Mean Squared Error (MSE) of 8.27 and a Root Mean Squared Error (RMSE) of 2.88.
The temperature sensor was tested using a DS18B20 one-wire digital sensor which reports degrees in Celius (°C) with 9 to 12-bit precision with ±0.5C accuracy. Both sensors were connected to a microcontroller and then exposed to a set of conditions at the same time to compare the desired characteristics. The DS18B20 outperformed the selected sensor in accuracy. The selected sensor had an accuracy of ±0.5C to ±1.0°C. However, it had a much faster response time, which made it ideal for the application, because ±1.0°C falls within the tolerance range for this application and detecting temperature increases is more valuable than determining absolute temperature.
Preliminary Technical Validation of Pressure Measurement
Validation of pressure measurement was carried out in 5 healthy adult participants, aged 25–40 years, with no known foot pathology. Ethics approval this preliminary validation was granted by the FREC and UREC Ethics Board (V_15062020 5784). Participants were provided with 100% cotton socks and were asked to wear their own sports shoes. The sensor of the in-shoe pressure and temperature measuring device in direct contact to the skin at the plantar aspect of the 1st MPJ of each participant. Each participant performed 5 trials (∼15 min each) of casual walking while wearing both the newly developed in-shoe pressure and temperature measuring device and the Tekscan F-Scan in-shoe system so that plantar pressures could be recorded concurrently. The temperature of the room was kept constant at 25°C via air climate control.
Both devices collected an average of 50 readings per second (50 Hertz). Two datasets were collected during each trial. The raw readings were passed to the regressor, which returned the estimated Kilopascals (Kpa) value. Several evaluations metrics namely Mean Absolute Error (MAE), Mean Squared Error (MSE), Root Mean Squared Error, Root Mean Squared Logarithmic Error, R Squared (R2), Adjusted R Squared and Pearson Correlation, were used to evaluate the performance of the model.
The F-Scan features many sensors in the Region of Interest (ROI), and so a grid of 4 × 4 was considered to extract only the data from the target area (1st MPJ) located under the single sensor used by the novel device. Several values were computed from the ROI grid: minimum, maximum, mean, sum, and median. The mean value proved to be the closest to the readings recorded by the innovative system.
Results
Pressure
The novel device demonstrated strong predictive agreement and accuracy across all participants. Beyond high correlation coefficients (r = 0.801, r = 0.978, r = 0.813, r = 0.887, r = 0.944) in peak pressure readings between the novel device and the FScan system across the 5 distinct trials, the Mean Absolute Error (MAE) was approximately 7 kPa, and Root Mean Square Error (RMSE) was 10 kPa, indicating that the absolute pressure values closely matched the reference system. The Root Mean Squared Logarithmic Error (RMSLE) values of ∼2.3 further supports the equivalence of the measurements across different pressure magnitudes.
While Figure 2 illustrates the superimposed waveform patterns at a 50 Hz sampling rate, the analytical performance is highlighted by the R2 values, which reached as high as 95% (Patient 2) and 88% (Patient 5), reflecting the device's ability to replicate the complex temporal pressure changes of the FScan®. The time-synchronised readings visualised in Figure 2 across the 1st MPJ site further provide insight into the ability of our proposed system to capture peak-pressure data fluctuations with comparable effectiveness. While replacing the region-specific (4 × 4 ROI) with a singular sensor, the proposed system clearly outlines a similarity pattern to peak pressure readings across devices and supports a consistent understanding and analysis of the time-based features present within peak-pressure reading signals
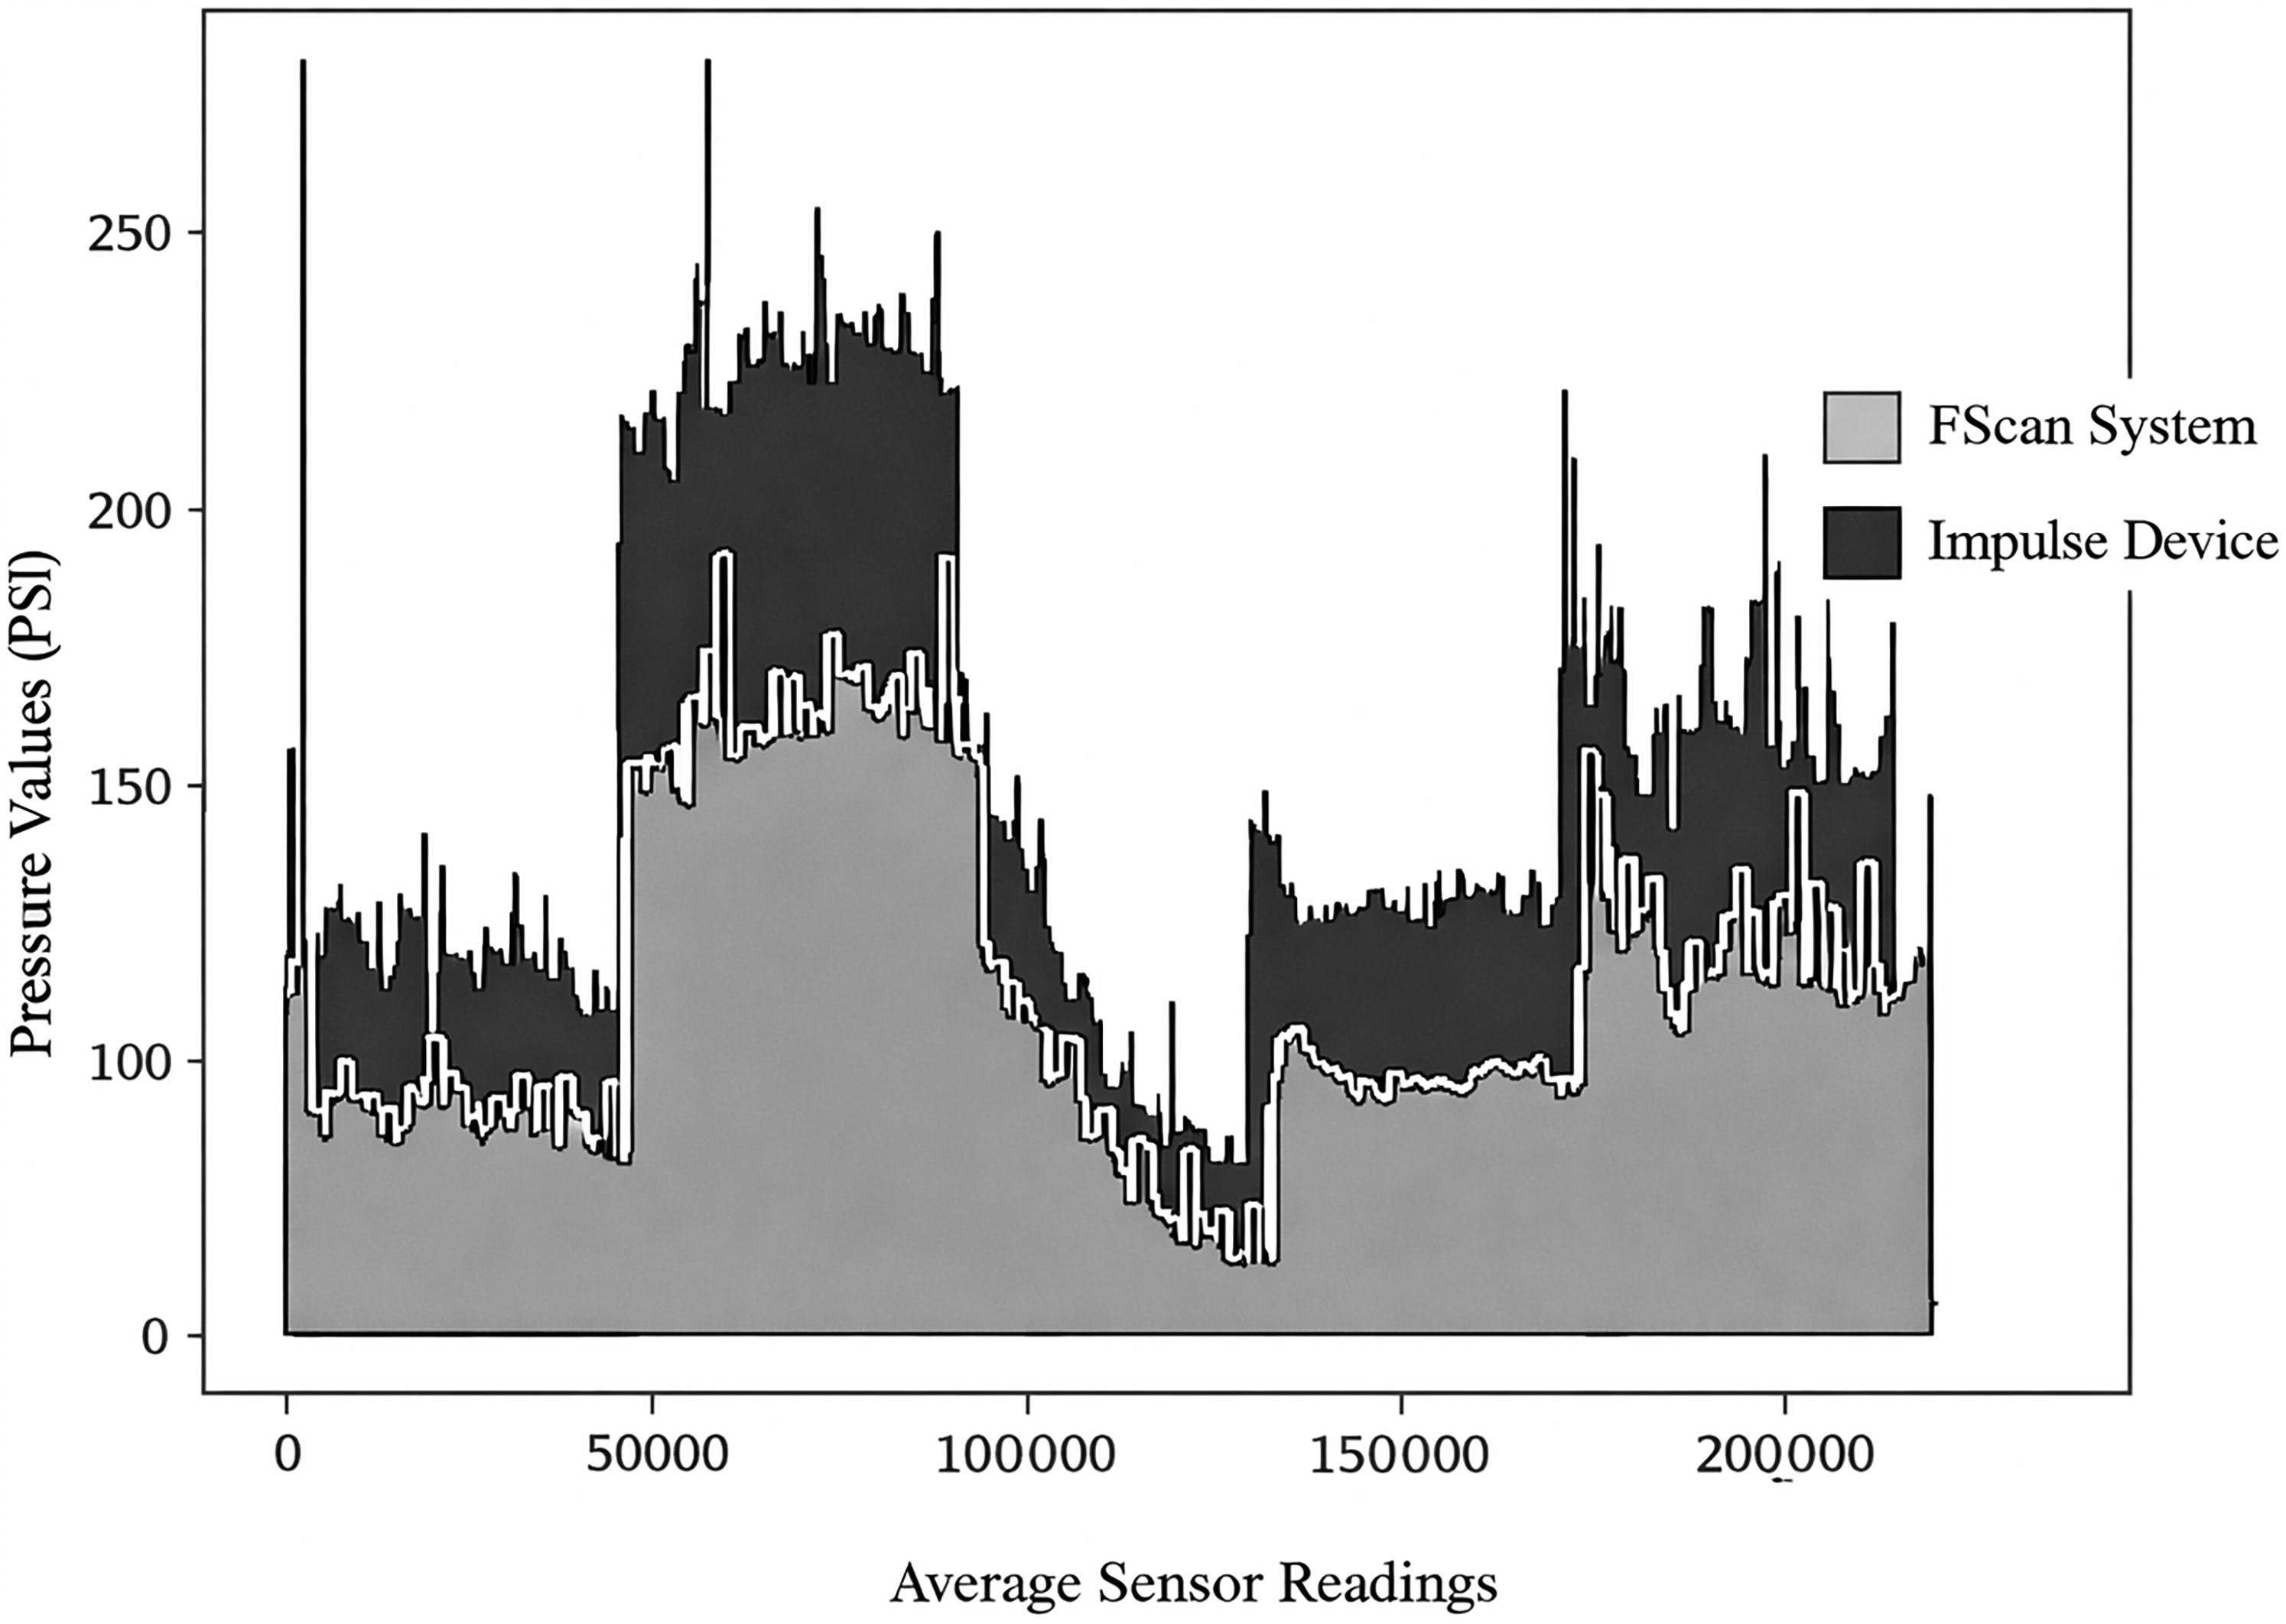
Pressure data of all 5 participants collected by the FScan system and Impulse device superimposed.
Temperature
Average change of temperature read by the thermal camera was 3.7°C (95% CI: ±1.07°C) with a Standard Deviation (SD) of 0.86°C indicating moderate variability around the mean temperature. In comparison, the in-shoe temperature sensor recorded an average change of 0.67°C (95% CI: ±0.48°C). Relative Standard Deviation (RSD) calculations showed that the in-shoe sensor exhibited greater variability in temperature changes between participants (63.64%) compared with the thermal camera (23.17%).
Furthermore, comparison of temperature data between the in-shoe temperature sensor and the in-shoe pressure sensor, showed a high correlation (r = 0.87) between the 2 parameters.
Discussion
The primary objective of this study was to evaluate the performance of an innovative in-shoe device designed to simultaneously and continuously monitor plantar pressure and temperature, which are both crucial factors in managing diabetic foot health. The results from this preliminary technical validation study revealed that the novel device showed strong correlations with the FScan® in-shoe pressure system, a widely accepted gold standard for plantar pressure measurement. Across five separate trials, the device demonstrated consistent and robust correlations (R-values ranging from 0.801 to 0.978) for peak pressure readings. These results suggest that the new device is capable of accurately measuring plantar pressure, making it a promising tool for use in clinical settings. Furthermore, error metrics, including Mean Absolute Error (MAE) and Root Mean Squared Error (RMSE), indicated that the device's pressure measurements closely aligned with the FScan® system.
In contrast to existing in-shoe pressure monitoring systems, which generally measure only pressure or temperature independently, this device stands out by offering a simultaneous, real-time measurement of both parameters. This feature provides several advantages, particularly in the context of diabetic foot care. Clinicians will find it easier to assess the efficacy of off-loading devices and make necessary adjustments to treatment plans based on real-time, site-specific data. This is especially useful for high-risk patients with a history of ulcers. By targeting anatomical regions at high risk for ulceration, the device enhances clinical utility while reducing the complexity of diabetic foot management. The device's wireless design and cloud-based data storage solution further enhance its usability, enabling remote monitoring and real-time decision-making—capabilities that are vital in busy clinical environments.
While the results for pressure measurement were promising, the temperature data collected by the device showed some variability, which must be addressed before it can be considered clinically reliable. The novel device exhibited a strong correlation (r = 0.87) between temperature and pressure readings, indicating a promising relationship between these two parameters, as temperature changes are often a precursor to pressure-induced tissue damage. Nevertheless, temperature measurements were less consistent compared to pressure readings, with the in-shoe sensor showing a high degree of variability (Relative Standard Deviation = 63.64%) in comparison to the thermal camera (RSD = 23.17%).
This higher variability in temperature readings may stem from the temperature sensor's sensitivity or its potential inability to capture subtle temperature changes however, these results could also have been influenced by factors such as physiological and demographic factors which vary across participants. Furthermore, due to the absence of a commercially established gold standard for in-shoe temperature measurement devices, a thermal camera was used as a reference standard to compare the performance of the thermistor sensor integrated into the novel device. It is important to note that the thermal camera and the thermistor sensor measure temperature using fundamentally different technologies. The thermal camera captures infrared radiation from the surface of the skin, providing a measure of skin temperature from a distance (through radiation), whereas the thermistor sensor directly measures the temperature at the skin's surface in direct contact (through conduction). These differences in measurement methodologies may contribute to discrepancies in the recorded temperature values. As such, while the thermal camera provided a useful comparative reference, the variations observed in temperature readings between the two devices may stem from these inherent differences in their measurement principles. Therefore, further validation using a more consistent reference system or refinement of the temperature measurement technique is needed to improve the clinical accuracy of the thermistor sensor.
While the performance of this novel device for pressure measurement can be considered clinically promising, its ability to monitor temperature effectively is still in the early stages of validation. Temperature is an important marker for early detection of tissue damage, but further research is needed to establish the device's clinical utility for this purpose. The current evidence suggests that the temperature sensor may be useful as a secondary tool, potentially for monitoring trends or for use in conjunction with other diagnostic measures. However, it should not yet be relied upon as the sole method for detecting early-stage ulceration in clinical practice.
The results of this study suggest that while the novel device holds potential as a tool for monitoring plantar pressure with high accuracy, the current temperature readings are not yet clinically convincing for real-time, actionable decision-making in diabetic foot care. Although the ability to track temperature changes alongside pressure provides valuable insights, further refinement of the temperature sensor is necessary to reduce its variability and enhance its clinical reliability. This includes exploring ways to improve the sensor's precision and accuracy, as well as controlling environmental factors that might influence the readings.
Additionally, the small sample size (n = 5) and the controlled laboratory setting represent limitations that must be considered when interpreting these results. In real-world clinical environments, patient activity levels, shoe type, and other factors such as foot posture may impact both pressure and temperature readings. Future studies with larger sample sizes and more diverse settings and perhaps on the high-risk foot population, are required to fully assess the performance of the device under varied conditions and over a longer duration.
Footnotes
Acknowledgements
N/A.
Funding
The authors received no financial support for the research, authorship, and/or publication of this article.
Declaration of Conflicting Interests
The authors declared the following potential conflicts of interest with respect to the research, authorship, and/or publication of this article: