
Abstract
Norwegian schools are obliged to develop students’ social competences. Programs used are School-Wide Positive Behavioral Interventions and Supports (PBIS) or classroom-based ones that aim to teach students social and emotional learning (SEL) skills in a broad sense. Some rating scales have been used to assess the effect of SEL programs on SEL skills. We explored the Norwegian version of the 12-item Social Emotional Assets and Resilience Scales–Child–Short Form (SEARS-C-SF). An exploratory factor analysis (EFA) was performed, proposing a one-factor solution that was verified by a confirmatory factor analysis (CFA). The scale reliability of .84 (λ2), means and standard deviations, as well as tier levels were compared with the original short form. Finally, concurrent, discriminant, and convergent validities for the SEARS-C-SF were compared with different Strengths and Difficulties Questionnaire (SDQ) subscales.
Schools are essential in promoting social competence and mental health for students (Conley & Durlak, 2017). In Norwegian schools, the national curriculum includes two branches of learning: academic and social competences. The focus on social competence is partly due to national studies linking negative effects of challenging behavior on learning environment (e.g., Sørlie & Ogden, 2014) and surveys showing that unwanted behaviors such as bullying are still recurrent (9.2% for Grade 5; Wendelborg et al., 2019). Norwegian efforts in developing students’ social competences have targeted the promotion of protective factors and the reduction of risk factors at the whole school and classroom levels, also termed universal or Tier 1 interventions (Horner & Sugai, 2015).
Prosocial and emotional skills, also called social and emotional learning (SEL; Harlacher & Merrell, 2010), refer to children’s and adults’ capability to learn and use knowledge, attitudes, and skills to interact with others positively (http://casel.org). This broad approach converges with the Norwegian educational authorities’ strategy to promote a new overreaching school subject termed “public health and life mastery” (folkehelse og livsmestring), including personal competences such as SEL (Collaborative for Academic, Social, and Emotional Learning, 2013). However, to be adopted at the national level, the efficacy of universal models and stand-alone programs should be validated with the Norwegian school population.
A norm-referenced rating scale that has been validated to evaluate SEL in Norway is the Social Skills Rating System (SSRS) (Gresham & Elliott, 1990), and the revised version, the Social Skills Improvement System (SSIS; Gamst-Klaussen et al., 2016; Gresham & Elliott, 2008). It incorporates student’s self-rating and teacher and parent ratings. However, it may not be practical and efficient enough to evaluate effects of universal SEL interventions. Even though it has shown good validity, non-validated scales are often used in Norwegian schools to evaluate SEL functioning. Arnesen et al. (2019) performed a review of SEL functioning scales used in Norwegian elementary schools and found that most were teacher self-made with no documented psychometric properties. Also, the use was unclear with regard to timing (e.g., when and how often to use it), objective (e.g., screening or other), and how to use the results (e.g., planning interventions). Arnesen et al. noted that this may be because available validated instruments (e.g., SSIS) are “time-consuming and not efficient for teachers to use in practice” (p. 20). Arnesen et al. therefore advocated for instruments that are efficient and practical for teachers to use and interpret.
Validated, practical short scales that may readily provide risk-level indicators (e.g., if a Tier 1 intervention would suffice or a Tier 2 intervention should be provided) would be preferable. The Social Emotional Assets and Resilience Scales–Short Forms (SEARS-SF; Merrell, 2011) may be a good alternative to this end. The 12-item short forms were “developed primarily for use in intervention outcome measurement and progress monitoring, such as would be used in a response to intervention (RtI) model” (Merrell, 2011, p. 5).
Research Objective
The objective of the current study was to investigate some psychometric properties of the Norwegian version of one of the short forms, the Social Emotional Assets and Resilience Scales–Child–Short Form (SEARS-C-SF; Merrell, 2011; Romer, 2012), including an exploratory factor analysis (EFA), a confirmatory factor analysis (CFA), scale internal consistency, and concurrent validity with the Strengths and Difficulties Questionnaire (SDQ; Goodman 2001).
Method
Participants
Students in regular schools, Grade 5, that is, 10 years of age, 49.5% male, participated. They were recruited from 39 different schools across Norway for a randomized controlled trial (RCT) evaluating the Norwegian version of the SEL program Lions Quest Skills for Adolescence (Strømgren, 2015), termed “Mitt Valg 2” in Norway. The students participated in Test Waves 1 (T1, n = 1,172) and 2 (T2, n = 1,179). The study was assessed by the Norwegian Data Protection Authority (Project Number 43838), which recommended it, and parents could choose to opt their child out given the information sent to them. Students could choose to opt out after information was given.
Data collection
The survey was administered to students in a paper-and-pencil format. Students answered the survey in their classroom during the regular school day. The classroom teacher read an instruction, handed out the survey, explained words/items not understood by students, and gathered the survey when students finished responding. Surveys were anonymous, that is, only gender information was collected as personal data because school lunch is not provided in Norwegian schools, and ethnicity may not be recorded for research purposes. The national percentage of students receiving special or adapted learning measures, including non-Norwegian first language, was 8.20 (T1) and 8.16 (T2).
Measures
The self-report measures used were the SEARS-C-SF and the SDQ.
SEARS-C-SF
The SEARS-C-SF (Merrell, 2011; Romer, 2012) is a 12-item one-dimensional measure. Examples of items include: “I like to do things for other people” and “I make good decisions.” Items are rated on a 4-point Likert-type scale ranging from never (0) to always (3). The minimum score is 0 and the maximum score is 36. The SEARS-C-SF yields T-scores, percentiles, and response to intervention (RtI) risk levels, that is, Tier 1, 2, or 3. Internal consistency (α) was reported to be .85. Merrell states in the manual that short form items were chosen from at least two of the full-scale items that represented each of the primary constructs and had the highest item-total score correlations, resulting in a short form correlation total scale with the full-length total scale of α = .93. The scale was translated to Norwegian by the first author, back translated to English by an independent licensed Norwegian psychologist, and finally inspected and approved by Psychological Assessment Resources (PAR, Inc).
SDQ
The SDQ (Goodman, 2001) self-report consists of 25 items that are rated on a Likert-type scale ranging from not true (0) to certainly true (2). There are five scales, each containing five items: Prosocial scale, Emotional Problems scale, Conduct Problems scale, Hyperactivity scale, and Peer Problems scale. These scales have a minimum score of 0 and a maximum score of 10. The four problem-oriented scales can be merged into a Total Problems scale. Furthermore, the Conduct Problems and Hyperactivity scales may be merged into an Externalizing Problems scale, and the Emotional and Peer Problems scales can be merged into an Internalizing Problems scale. Scale scores yield T-scores and risk levels (normal, borderline, clinical). The current study used the approved Norwegian version (www.sdqinfo.org).
Statistical Analysis
All analyses were performed with SPSS 27 unless otherwise indicated.
Missing values and imputation
We analyzed all of the study measure variables at the scale level (i.e., variables comprising the scales were analyzed together), and all had missing item values. Percentage incomplete data (PID) ranged from 1.24% to 3.21%. A plausible missingness function was missing at random (MAR), due to the fact that we used a booklet with multiple scales to collect data (Dong & Peng, 2013). We imputed item-missing values for all variables comprising a scale using multiple imputation with the fully conditional specification (FCS) Markov chain Monte Carlo (MCMC) algorithm, one imputation, and logistic regression with maximum 10 iterations. This is regarded a viable solution when missing values are MAR and the PID is low (Dong & Peng, 2013; Wu et al., 2015).
EFA
Using data from the first test wave (T1), we examined construct validity for SEARS-C-SF with an EFA to see if the data set were in accordance with the manual statement that SEARS-C-SF is a one-factor rating scale (Merrell, 2011). The R-code-based app EFAshiny (Yu & Sheu, 2018) was used, and based on parallel analysis factor retention and polychoric correlations, we extracted factors using weighted least squares (WLS) and oblimin rotation (Watkins, 2018). An a priori criterion of ±.30 for most correlations was set.
CFA
Using data from the second test wave (T2), we examined construct validity for SEARS-C-SF with a CFA to see if the hypothesized one-factor structure from the manual and from the current EFA could be confirmed. Computation was carried out with R-code-based app Confirmatory Factor Analysis. Because one factor was specified and the variables were ordinal categorical, we used the diagonally weighted least squares (DWLS) estimator (Li, 2016). Indices of model fit were absolute (normed chi-square [NC] = χ2/df, ≥5), parsimonious (root mean square error of approximation [RMSEA], preferably <.06), and incremental (comparative fit index [CFI] and Tucker–Lewis index [TLI], preferable >.96) (Li, 2016; Mueller & Hancock, 2015).
Scale reliabilities
Following EFA for SEARS-C-SF (T1), we used SPSS 27 to compute scale reliability with Guttman’s lambda 2 (λ2) with bootstrap because alpha may systematically underestimate reliability (Wissink et al., 2016), and also corrected item-total correlations (CI-TC) (should be > .3) and Guttman’s λ2 if item deleted (λ2 if ID) (should be about the same as total scale) (Field, 2018).
Scale means, standard deviation, and tiers
We used SPSS 27 to compute scale means and standard deviations for the T1 SEARS-C-SF and all SDQ scales. Gender differences were explored with independent-sample t tests. With SPSS 27, we computed tiers for the SEARS-C-SF, and risk levels for all SDQ scales. The SEARS-C-SF scale cutoff values for the different tiers were based upon Merrell (2011). The SDQ scale cutoff values for different levels (i.e., Normal, Borderline, or Clinical) were based upon Van Roy et al. (2006). Tiers for the SEARS-C-SF were compared with the results described by Romer (2012): n = 300 (81.9%) in Tier 1, n = 65 (15%) in Tier 2, and n = 19 (3.2%) in Tier 3. Horner and Sugai (2015) indicated general percentages around 80% for Tier 1, 15% for Tier 2, and 5% or less for Tier 3.
Concurrent validity
With SPSS 27, we computed concurrent validity between the T1 SEARS-C-SF and the T1 SDQ scales, using Spearman with BCa (bias-corrected and accelerated) 95% confidence interval (CI) due to uncertainty of normality. Also, SEARS-C-SF Tiers and SDQ levels were correlated using cross-tabulations with chi-square and Kendall’s Tau-b correlation coefficient. No interpretation standards are published for Tau-b, other than “Kendall’s τ is 66–75% smaller than both Spearman’s rs, and Pearson’s r, but r and rs are generally similar in size . . .” (Field, 2018, p. 363).
Results
EFA
Results are depicted in Table 1. Bartlett’s test of sphericity indicated that the correlation matrix was not random, χ2(df = 66) = 3,319.12, p < .001, and thus appropriate for EFA. The Kaiser–Meyer–Olkin (KMO) test verified the sampling adequacy for the analysis (KMO = .91 is regarded as marvelous). The parallel analysis (quantile of .95, 200 simulations) suggested that one factor should be retained. All but three factor correlations in the pattern matrix were above .50 or .60, which may be considered adequate. Also, all extracted KMO values for individual items were in the meritorious (>.80) or marvelous (>.90) range.
Results From the SEARS-C-SF EFA and CFA.
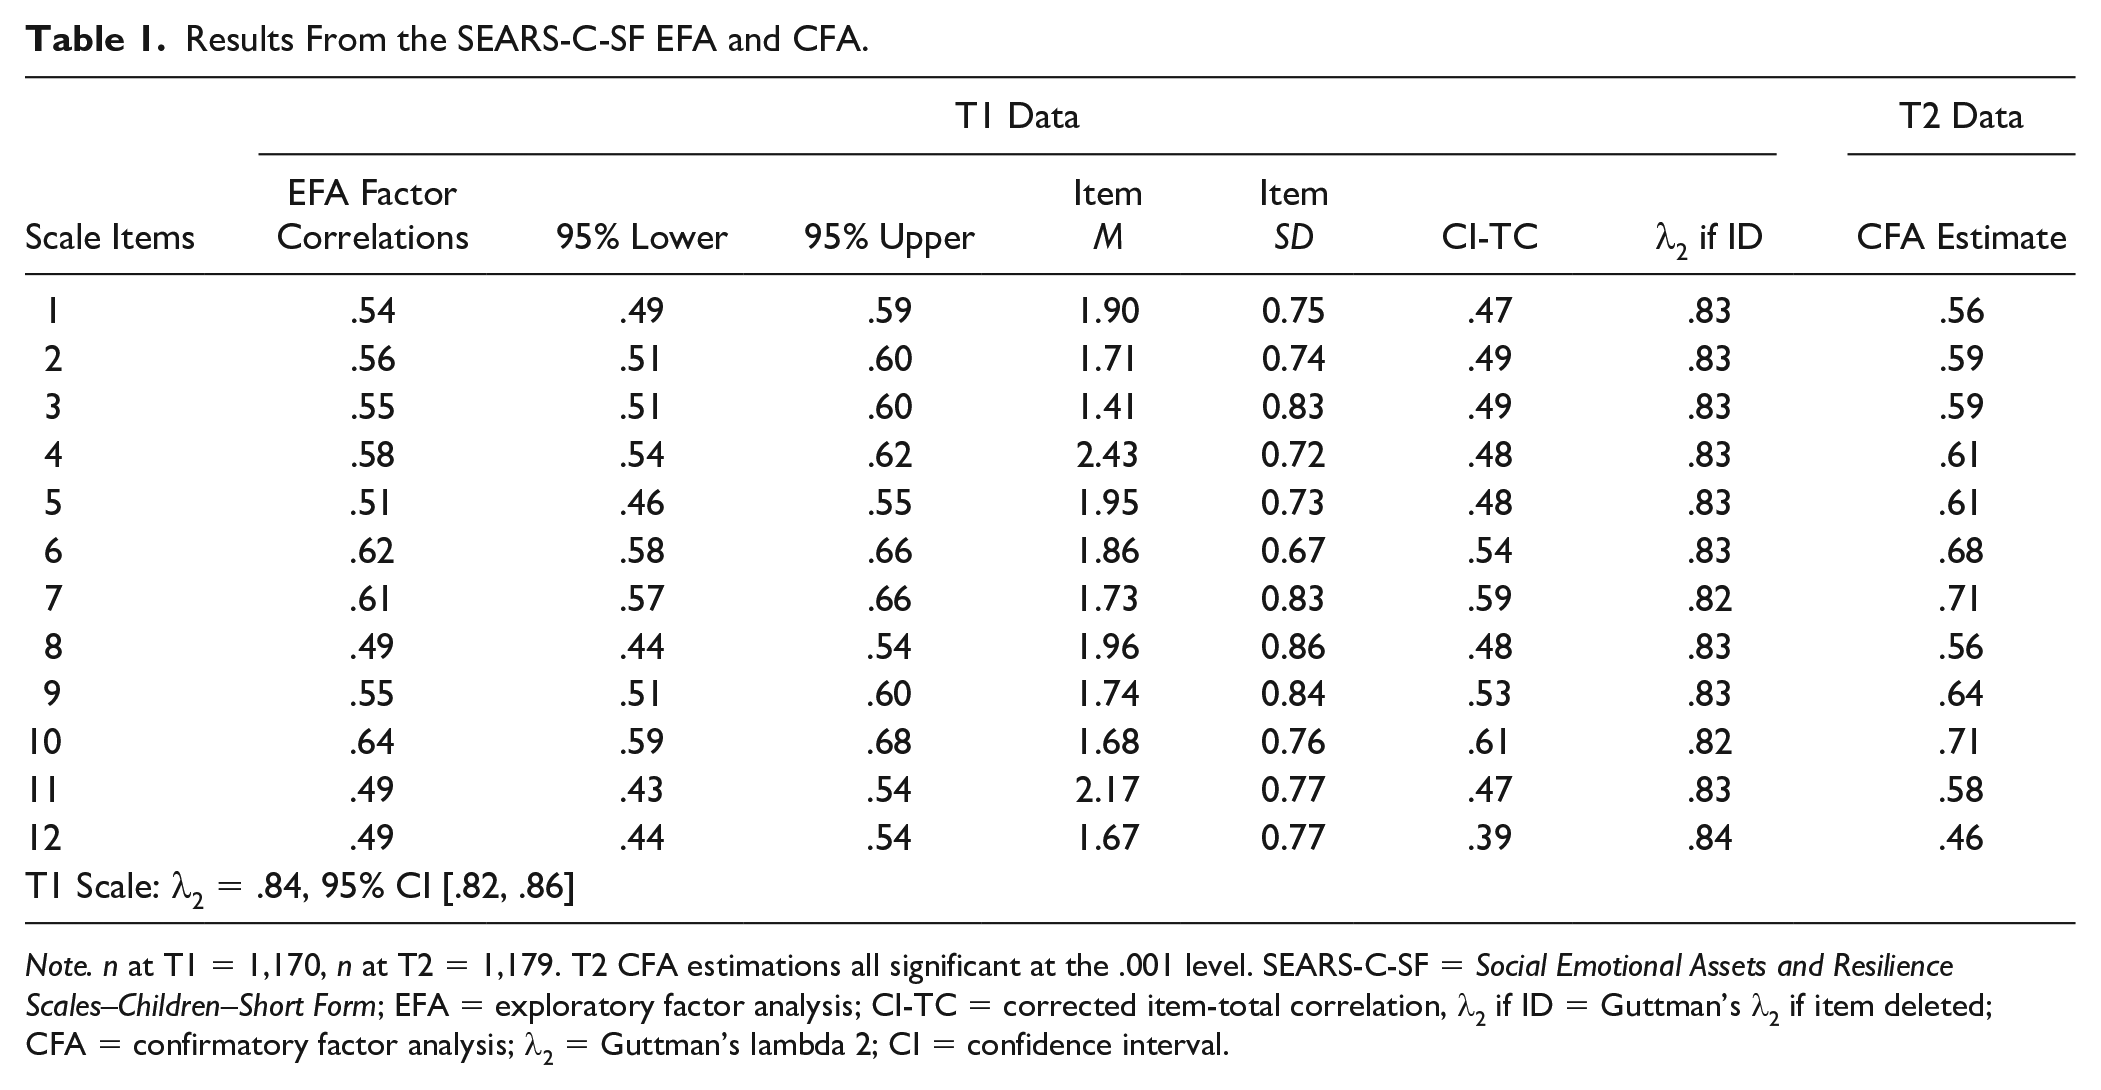
Note. n at T1 = 1,170, n at T2 = 1,179. T2 CFA estimations all significant at the .001 level. SEARS-C-SF = Social Emotional Assets and Resilience Scales–Children–Short Form; EFA = exploratory factor analysis; CI-TC = corrected item-total correlation, λ2 if ID = Guttman’s λ2 if item deleted; CFA = confirmatory factor analysis; λ2 = Guttman’s lambda 2; CI = confidence interval.
CFA
Estimates are depicted in Table 1, far right column. Standardized loadings ranged from .46 to .71. The current data indicated that the one factor originally indicated in the manual and seen in the current EFA may be an adequate to good fit, NC = 4.5, CFI = .985, TLI = .981, RMSEA = .055 (95% CI = [.048, .062], p < .05).
Scale Reliabilities
Scale reliability for SEARS-C-SF at T1 is depicted in Table 1. Except for Item 3, item means and standard deviations showed a slight trend toward the higher end of the Likert-type scale. The SEARS-C-SF scale λ2 = .84 appears to be reliable as the λ2 level does not change if one item is deleted (see Table 1, λ2 if ID), and all items correlate with the total scale (see Table 1, CI-TC) and are above .39. The total scale internal consistencies for each study measure are depicted in Table S3 (online supplemental material).
Scale Means, Standard Deviation, and Tiers
Means and standard deviations for the current study scales are depicted in supplemental Table S3. There were no gender differences on any measure. In terms of tiers, the SEARS-C-SF yielded the following: n = 958 (81.9%) in Tier 1, n =175 (15%) in Tier 2, and n = 37 (3.2%) in Tier 3. There was no difference from the tier distributions described by Romer (2012), χ2(1, 1554) = 3.79, p = .15.
Concurrent Validity
Table 2 depicts concurrent validity, both from the scales sum score correlations (Spearman) and tier correlations (Tau-b), all significant but for the SDQ Emotional Problems. There was a medium negative correlation for the SDQ Total Problems and for Externalizing Problems with the subscales Conduct Problems and Hyperactivity accordingly, indicating discriminant validity. There was a very weak negative correlation with the SDQ Internalizing Problems with its subscales Emotional Problems and Peer Problems accordingly. There was a large positive correlation between the SEARS-C-SF and the SDQ Prosocial, indicating convergent, or related, constructs. The Tau-b Tier correlations in Table 2 show the same picture as the Spearman correlations.
Concurrent Validity With the SDQ.
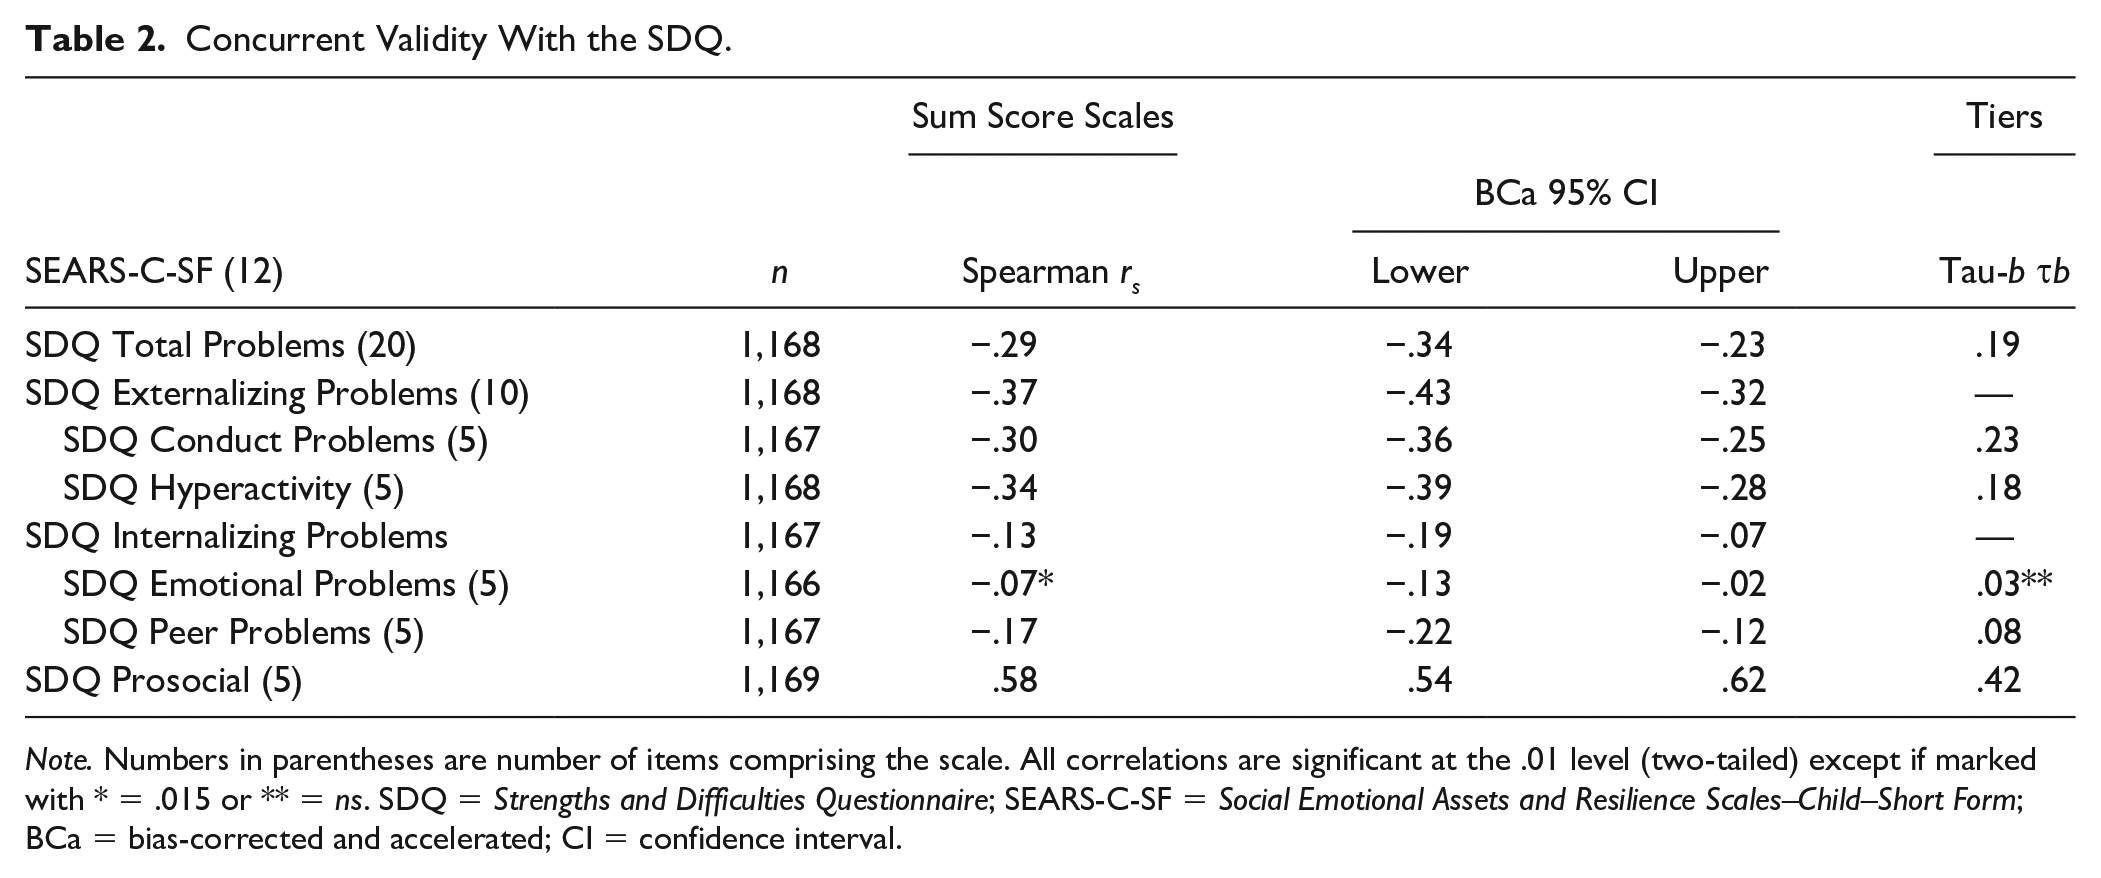
Note. Numbers in parentheses are number of items comprising the scale. All correlations are significant at the .01 level (two-tailed) except if marked with * = .015 or ** = ns. SDQ = Strengths and Difficulties Questionnaire; SEARS-C-SF = Social Emotional Assets and Resilience Scales–Child–Short Form; BCa = bias-corrected and accelerated; CI = confidence interval.
Discussion
The objective of the current study was to investigate some psychometric properties of the SEARS-C-SF. The EFA suggested a one-factor solution that performed well by the CFA. Scale reliabilities, means, and standard deviations also showed properties comparable with the original SEARS-C-SF. (The manual (Merrell, 2011) only gives the total scale alpha.) The current study thus adds to the understanding of the scale reliability, indicating that the SEARS-C-SF may be a useful screening and evaluation tool. Also, the SEARS-C-SF yielded tiers comparable with Romer (2012) and percentages published by Horner and Sugai (2015). This will give teachers (and researchers) a direct and easy way to interpret risk level, which will indicate who needs a Tier 2 or 3 intervention in addition to the Tier 1 program.
In terms of concurrent validity, the SEARS-C-SF correlations with the different SDQ scales performed as may have been predicted considering their underlying constructs. The medium negative correlation with the SDQ Externalizing Problems scales and subscales (Conduct Problems and Hyperactivity) indicate that they are measuring constructs opposite to the SEARS-C-SF, which is a strengths-based construct. Also, the low correlation with the SDQ Internalizing Problems with its subscales (Emotional and Peer Problems) indicate that the constructs are not shared with the SEARS-C-SF, showing discriminant validity. Romer (2012) found similar scores comparing SEARS-C-SF and the Achenbach Youth Self Report (r = –.48 to –.55). Scores on the SEARS-C-SF may thus not indicate any level of emotional or peer problems. Finally, the high correlation between the SDQ Prosocial scale and the SEARS-C-SF indicates that their constructs are related, showing convergent validity. These results suggest that the SEARS-C-SF may be a viable measure for the evaluation of SEL programs. Being a strength-based inventory, it should fit better with the goals of an SEL intervention than, for instance, scales such as the SDQ where 20 out of 25 items are problem focused.
Summary and Conclusion
The current study has explored psychometric properties of a Norwegian version of the SEARS self-report short form for children. The results suggest that the SEARS-C-SF may be a viable measure for planning and evaluation of SEL programs. Improved scores indicate both improved SEL skills and improved well-being. As a reliable and valid short form, the SEARS-C-SF appears to be a good candidate for student self-reports.
Supplemental Material
sj-docx-1-aei-10.1177_15345084211055473 – Supplemental material for Psychometric Properties of a Norwegian Version of the Social Emotional Assets and Resilience Scales–Child–Short Form
Supplemental material, sj-docx-1-aei-10.1177_15345084211055473 for Psychometric Properties of a Norwegian Version of the Social Emotional Assets and Resilience Scales–Child–Short Form by Børge Strømgren and Kalliu Carvalho Couto, PhD in Assessment for Effective Intervention
Footnotes
Declaration of Conflicting Interests
The authors declared no potential conflicts of interest with respect to the research, authorship, and/or publication of this article.
Funding
The study was funded by the “MITT VALG” foundation, part of the Lions Club Norway (Norway).
Disclosure Statement
All authors have approved the final manuscript for submission.
Ethical Statement
The study is performed in accordance with the ethical standards as laid down in the 1964 Declaration of Helsinki and its amendments. No personal data were collected, and the Norwegian Centre for Research Data does not require preapproval for this kind of data.
References
Supplementary Material
Please find the following supplemental material available below.
For Open Access articles published under a Creative Commons License, all supplemental material carries the same license as the article it is associated with.
For non-Open Access articles published, all supplemental material carries a non-exclusive license, and permission requests for re-use of supplemental material or any part of supplemental material shall be sent directly to the copyright owner as specified in the copyright notice associated with the article.