
Abstract
Objective:
This study was designed to detect the brain glucose metabolism in rat models of Alzheimer’s disease (AD) by the application of 18F-2-fluoro-deoxy-
Methods:
Forty Wistar rats were randomly divided into 2 groups. Fifteen sham-operated rats were used as a control group. The remaining rats as a premodel group were intracerebroventricularly injected with ibotenic acid and were intraperitoneally injected with
Results:
The learning and memory skills were weakened in AD rats. Besides, the glucose metabolic activity of AD rats decreased in hippolampus, hypothalamus, insular cortex, piriform cortex, striatum, cingulate gyrus, stria terminalis, and parietal lobe and increased in olfactory bulb, cerebellum, midbrain, pontine, and retrosplenial cortex compared with the control group. Dorsal thalamus had shown both enhanced and reduced glucose metabolic activity.
Conclusion:
Our data indicate that the changed glucose metabolism in cerebral regions in 18F-FDG-PET imaging could be an important predictor for early AD.
Introduction
Alzheimer’s disease (AD) is a major public health problem affecting nearly 35 million people worldwide and accounts for 60% to 70% of cases of dementia. 1 This neurodegenerative disorder characterized clinically by deficits in cognitive and behavioral functions, personality changes, and impaired activities of daily living. Pathologically, it is defined by the deposition of extracellular amyloid β (Aβ) and neurofibrillary tangles (NFTs). 2,3
Traditionally, the diagnosis of AD was on the basis of clinical observations: the age-related loss of memory functions, additional cognitive deficits, frank dementia, and 2 neuropathologic findings including postmortem senile plaques and NFTs in neurons.
4
Today, the early stage of AD, termed as “preclinical AD,” is an important focus of research as it is considered the most promising period for successful disease-modifying therapies.
5
Moreover, the transition from mild cognitive impairment (MCI) to AD has been considered as the early-onset AD. With the development of nuclear imaging technology, imaging AD pathology, using amyloid positron emission tomography (PET) imaging agents such as 11C-Pittsburgh compound B (11C-PiB), and imaging AD neurodegenerative processes, using 18F-2-fluoro-deoxy-
However, neither method is totally perfect. Although Aβ plaques are one of the defining pathological features of AD, 7 a large proportion of patients with non-AD dementia also exhibit substantial Aβ burden. Meanwhile, FDG-PET abnormalities reflect neuronal dysfunction and correlate well with dementia severity, 8 –10 although this biomarker is not as specific to AD. The sensitivity and specificity of 11C-PIB-PET for AD ranged from 83.3% to 100% and 41.1% to 100%, respectively. 11 And, studies for 18F-FDG-PET generally reported higher accuracy, with sensitivities of 75% to 99% and specificities of 71% to 93% for AD. 12 Consequently, the mainstay of functional brain imaging for the detection and diagnosis of AD will remain 18F-FDG-PET. 13
18F-2-fluoro-deoxy-
So far, in animal models of AD, studies concerning the glucose metabolism cannot statistically define a variation pattern and doubt remains as to whether the observed hypometabolism is due to the pathology of AD or other causes. Thus, in this study, we present and validate the AD-related glucose metabolic pattern in AD rats using 18F-FDG-PET technology and SPM 2.0 analyzing system. Furthermore, we suggest that the change in glucose metabolic activity in certain brain regions can be an important indicator for the detection of early AD.
Materials
Reagents and Instruments
The reagents and instruments used in this study were
Experimental Animals
A total of forty 2-month-old Wistar rats (20 males and 20 females) weighing 200 to 250 g were provided by the Animal Centre of the China Academy of Chinese Medical Sciences. The entire experimental procedure was in accordance with the Guidelines for the Care and Use of Laboratory Animals of the Ministry of Science and Technology of the People’s Republic of China.
Methods
Primary Experimental Groups
The 40 rats were kept 2 to 3 per cage in a room with a 12-hour light/12-hour dark cycle (lights on 07:00-19:00), and the room temperature and humidity set in the range of 18°C to 22°C and 40% to 70%, respectively. After 1 week of acclimatization to the cage, all rats were randomly divided into control group (n = 15, 8 males and 7 females) and premodel group (n = 25, 12 males and 13 females).
Induction of AD
Two weeks after induction, AD rats were assigned to Y-maze test to decide whether the induction was successful. Fifteen rats from the premodel group were included as the experimental group.
Y-Maze Test
The assessment of spatial learning and memory abilities in rats was carried out by a professional technician using Y-maze in a quiet and dim circumstance. The training time of rats was fixed.
Procedure: The rat was placed in an arm facing the center and was allowed to freely explore the maze for 5 minutes. Regular alternation of safe zone and electric shock zone brought the rat’s need to avoid an electric shock, thus enhanced its abilities to distinguish light stimulation and location of safe zone.
Detail parameter of electric shocks: An electric shock lasted 5 seconds (voltage 50-70 V). A correct reaction occurred when rat moved to the safe zone after an electric shock within 10 seconds without retracing its steps.
Specific method: Safe zone altered in the order of A-B-C-A arm. After the rat reached the safe zone, it was then exposed to light stimulation for 15 seconds, which was counted as 1 test. The arm in which the rat stayed was regarded as starting arm of the next test. And, the next test began after a break of 30 seconds. Repeating this process 20 times a day, and the first 3 days was the study phase. The fourth day had a short-term memory test. The total reaction time (TRT) of each day was measured.
The 18FDG-PET Image Creation
After Y-maze test, all rats were sent to the PET-CT Centre of the Experimental Animals Centre of the General Hospital of PLA at 8:00 after 24 hours of fasting and were then submitted to the following procedure: (1) Determining the blood sugar level. (2) The rats were allowed to rest for 20 minutes in a dark room. (3) A tracer (18F-FDG, synthesized with Mini Tracer accelerator, 1.5 MCi/500 g dosage) was injected via the tail vein. (4) After injection, all rats were freed to move in a small box for 35 minutes. Then, rats received gas anesthesia (5% isoflurane and 100% oxygen) for 5 minutes. (5) Positron emission tomography scanning: PET/computed tomography was performed using an integrated scanner (Biograph BGO duo; Siemens, Germany) covering the whole brain and neck. Images were reconstructed through iterative algorithms of ordered subset expectation maximization (OSEM). For OSEM reconstruction, 6 iterations and 16 subsets were used, which ensures good convergence and accuracy of the images. Images were acquired after a 40-minute uptake period (matrix size: 128 × 128 × 63; image format: ANALYZE 7.5). The PET image processing was conducted by Nuclear Analytical Techniques, Institute of High Energy Physics, Chinese Academy of Sciences, using Statistical Parametric Mapping 2.0 (http://www.fil.ion.ucl.ac.uk/spm/) on which a MATLAB (Mathworks Inc [China]) platform was implemented. Using SPM software, PET image was overlaid on a magnetic resonance template which was based on the stereotactic rat brain atlas of Paxinos. 22
Statistical Analysis
The Y-maze data were shown as mean ± standard deviation (
The SPM analysis was based on a general linear model to perform a voxel-wise comparison of PET images from AD rats and controls. Statistical threshold was fixed at P < .001 (uncorrected) with a minimum of 50 voxels threshold.
Results
Y-Maze Test Result
Comparison between the experimental group and the control group of rat TRT 2 weeks after model induction is listed in Table 1. The TRT of AD rats on the first 4 days was significantly longer than the healthy controls (P < .05).
Total Reaction Time of Rats 2 Weeks After Model Induction in Each Group (s/d).
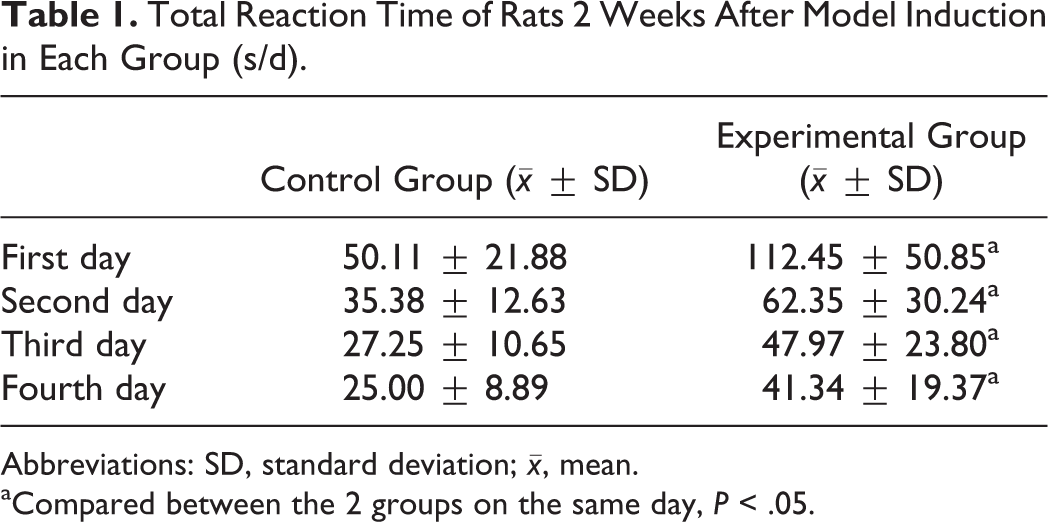
Abbreviations: SD, standard deviation;
aCompared between the 2 groups on the same day, P < .05.
Brain Glucose Metabolism Changed in Different Regions
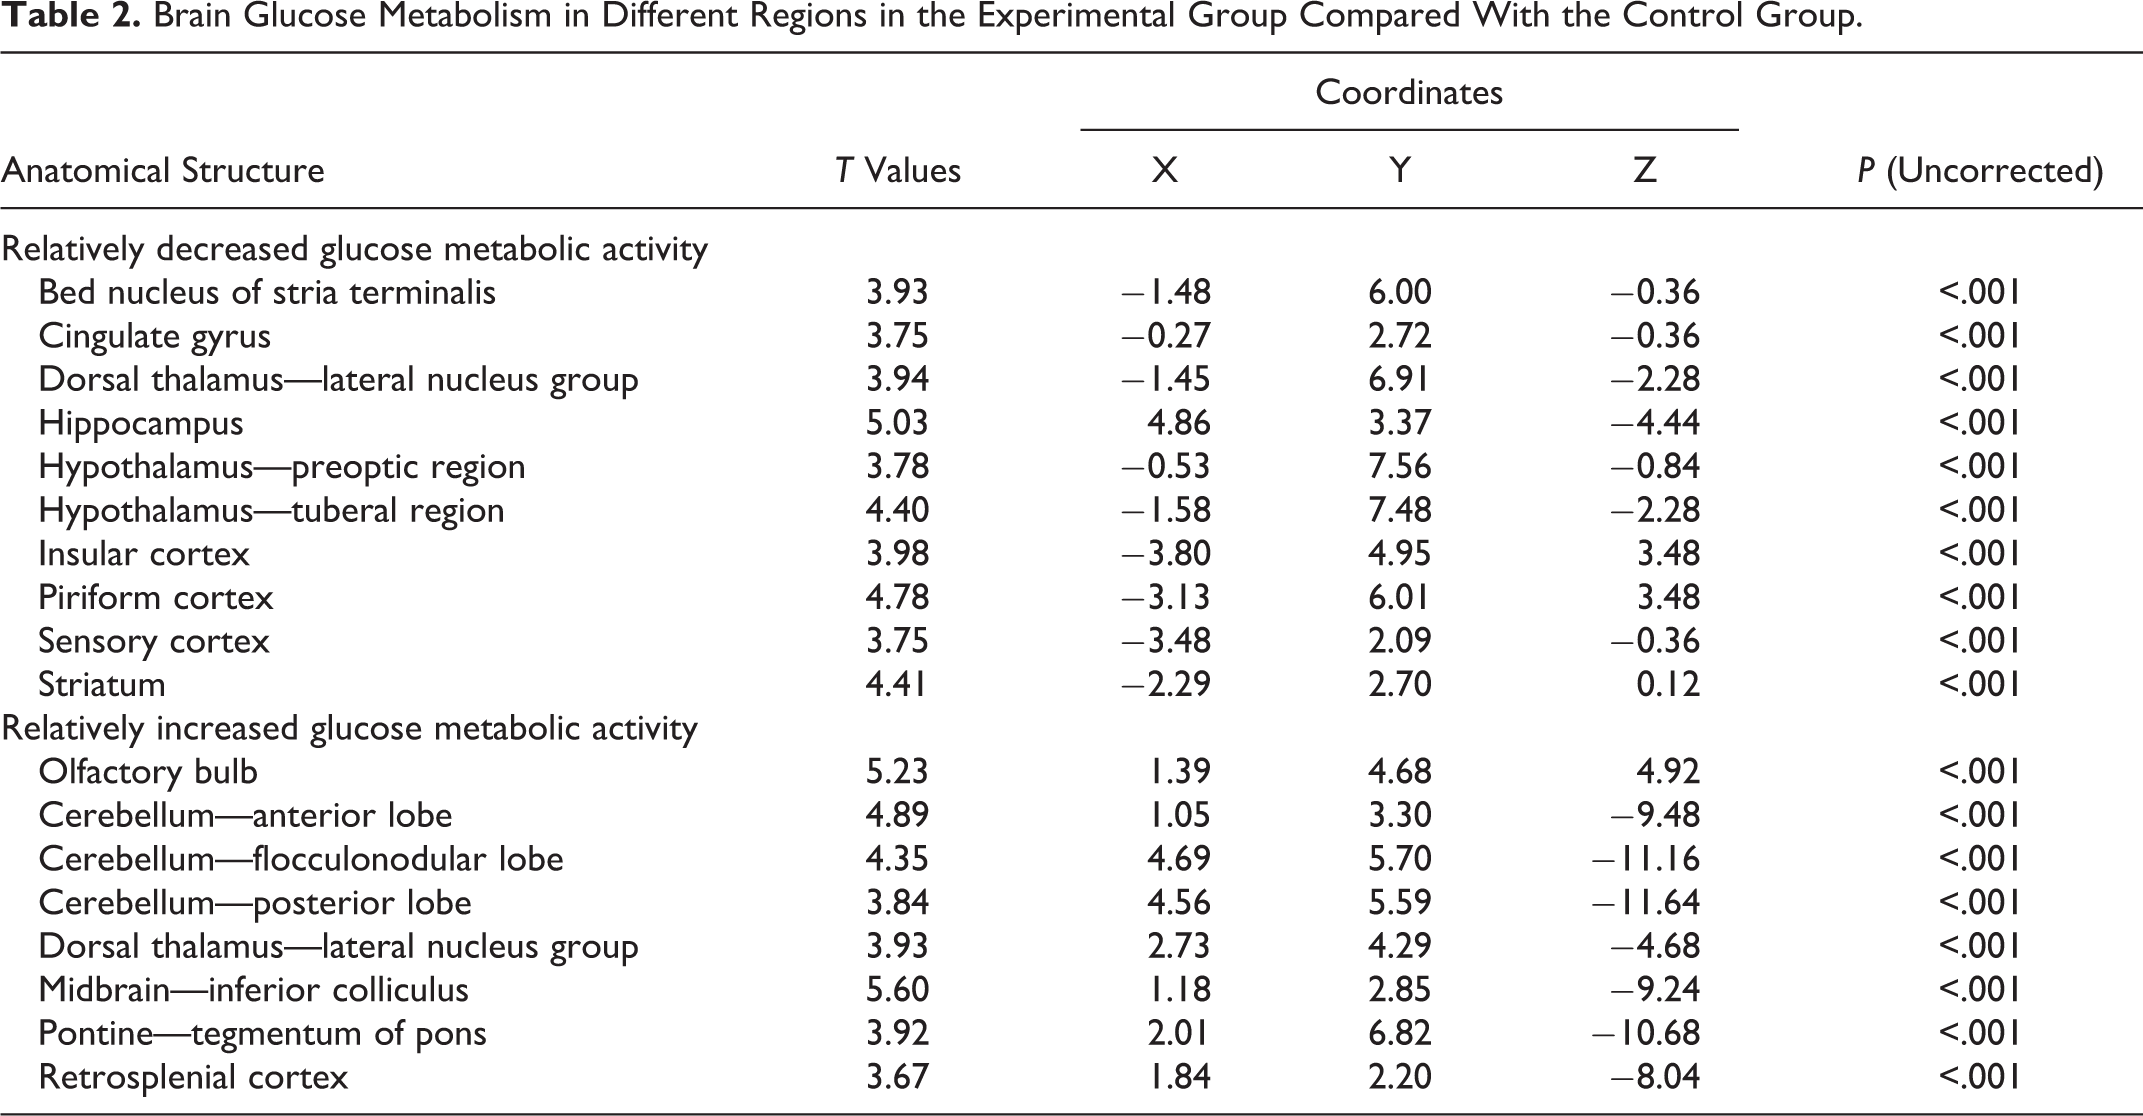
The SPM 2.0 analysis of 18F-FDG-PET images revealed significant hypometabolism in the experimental group in brain regions of hippolampus, hypothalamus, insular cortex, piriform cortex, striatum, cingulate gyrus, stria terminalis, and parietal lobe. Compared with the control group, the experimental group also exhibited higher levels of glucose metabolism. Those brain regions were olfactory bulb, cerebellum, midbrain, pontine, and retrosplenial cortex. Dorsal thalamus has shown both enhanced and reduced metabolic activity in AD rats (Table 2 and Figure 1).
Brain Glucose Metabolism in Different Regions in the Experimental Group Compared With the Control Group.
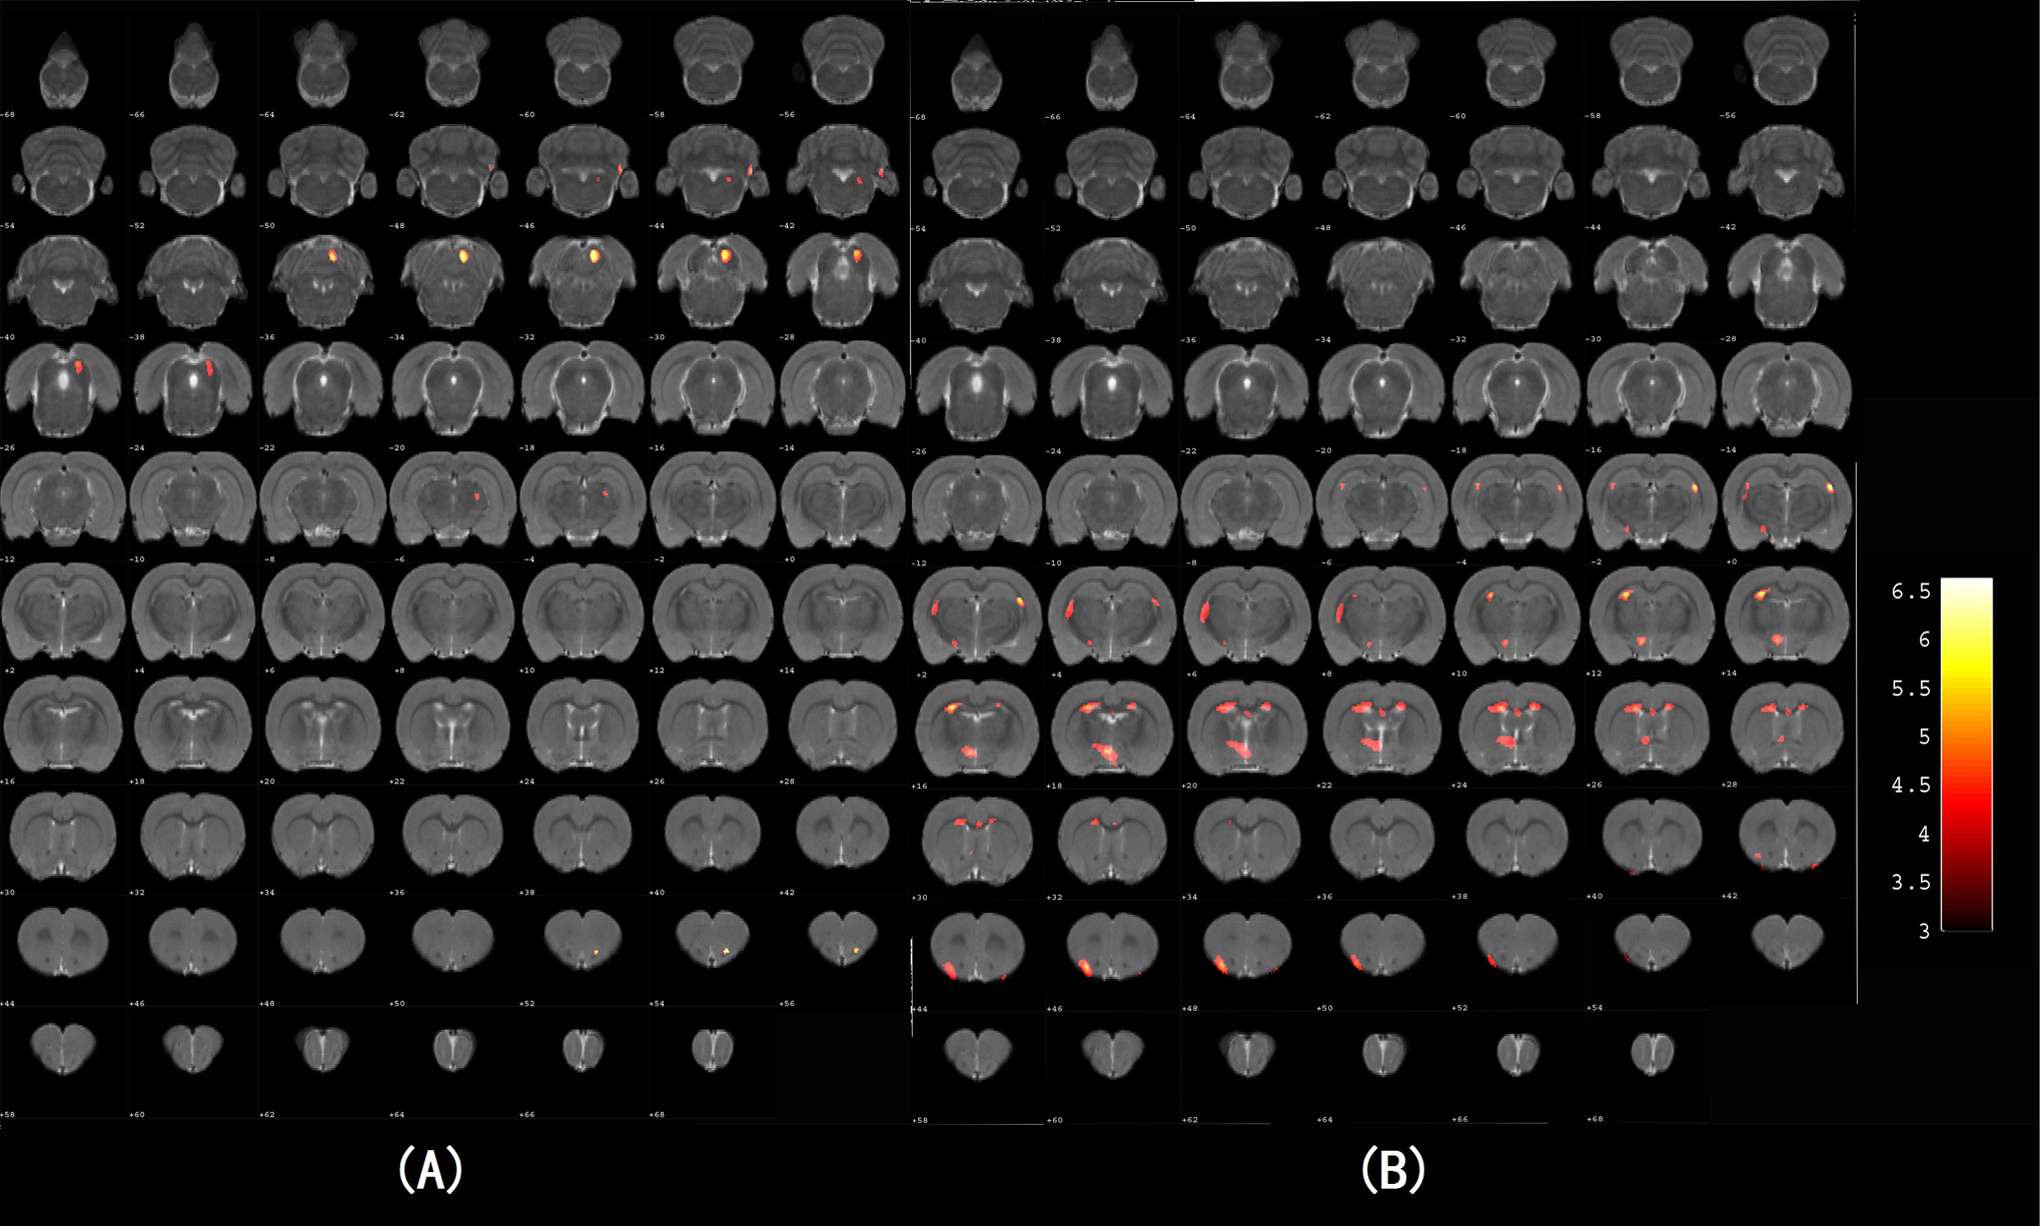
Statistical parametric maps of 18F-2-fluoro-deoxy-
Discussion
In the present study, Y-maze was used to test the learning and memory skills of AD rats compared with the healthy controls. This behavioral task can test hippocampus-dependent short-term and spatial memory processing, which are particularly affected by AD. Analyzing Y-maze data (Table 1), we showed that AD had weaken the abilities of rats to remember the routes to the safe zone and to react instantly to footshock. It is well known that hippocampal formation is involved in learning process and plays an important role in processing and remembering spatial and contextual information. 23 Reports also suggest that hippocampus is one of the first cerebral structures to develop neurodegenerative changes in early AD. 24,25 Moreover, AD can cause progressive hippocampus dysfunction leading to memory impairment and low levels of uptake rate of glucose in hippocampus, 26 which was consistent with our study. Thus, it is likely that hypometabolism in hippocampus as a result of AD associates with memory impairment.
In addition, significant differences in glucose metabolism were estimated for every voxel using t statistics on SPM 2.0. We observed predominant hypometabolism in regions of hippolampus, hypothalamus, insular cortex, piriform cortex, striatum, cingulate gyrus, stria terminalis, and parietal lobe. Besides, increased metabolism was detected in olfactory bulb, cerebellum, midbrain, pontine, and retrosplenial cortex compared with the control group. Dorsal thalamus had shown both enhanced and reduced metabolic activity. The benefit of the current approach is the ability to combine Y-maze data and changed cerebral glucose metabolism in varied regions and to provide several possible hypotheses on this link.
Recent evidence implicated that the progression of parietal lobe white matter hyperintensities on T2-weighted magnetic resonance imaging (MRI) predicts the incidence of AD. 27,28 Studies also confirmed that hippocampus atrophy is independently associated with the progression to AD. 29 Hippocampus, a crucial component of the medial temporal lobe memory circuit, was affected in early AD, which explained rats’ behavior in the Y-maze test of our study. Reduced glucose metabolism detected in parietal lobe also indicated that metabolic dysfunction was associated with pathological changes in parietal lobe, which can be an important trigger for the onset of AD. 30 The MRI analysis conducted longitudinally in animal models of AD indicated that striatum atrophy was involved in the development of AD, which was likely resulted by the loss of synaptic contacts. 31 Subtle alterations in synaptic function that underlie the earliest cognitive features of AD are perhaps relevant to hypometabolism in corpus striatum. 32 Because AD is also characterized by disturbances of language, praxis, gnosis, and so forth, self-consciousness (SC) impairment measured by SC questionnaire can also be found in patients with AD. 33,34 Moreover, since insular cortex is a core region for SC, we hypothesized that altered glucose metabolic activity in insular cortex is correlated with SC impairment. Additionally, olfactory dysfunction has been recently proposed as a potential marker for AD diagnosis. 35 –37 The Aβ deposits in the olfactory system have been suggested to promote AD pathology in rats. 38,39 Patients with MCI showed increased gray matter loss in olfactory and polysynaptic hippocampal network. The degree of olfactory dysfunction was related to spatial memory deficits. 40 However, although hypometabolism was found in hippocampus, olfactory cortices exhibited increased metabolic activity. It is still unclear why improved metabolism was shown in olfactory bulb and its role in AD. Besides, the reasons why dorsal thalamus had shown both enhanced and reduced glucose metabolic activity in our study appear to be connected with the atrophy of thalamus according to relevant researches concerning the neuropathological alterations in AD. 41,42 Apart from thalamus, in those researches, gray matter atrophy was also observed in the right posterior cingulate gyrus and the right insula. Glucose metabolism changes were observed in these regions according to our study.
Cerebral glucose metabolic activity is an index of synaptic function and density. 43,44 In AD, loss of effective neuronal activity is reflected by cortical glucose hypometabolism. Regional cerebral metabolic rate for glucose (CMRgl) information provided by 18F-FDG-PET is considered as an imaging biomarker with a good sensitivity in the diagnosis of early AD. 45,46 Consistent with our study, several studies have found reduced CMRgl in patients with AD 47 –49 and increased metabolism in certain regions. 50 –52
However, the interpretation for aberrant metabolism still remains uncertain. The fact that AD rats exhibit cerebral glucose hypometabolism is possibly due to impairments in insulin signaling and altered thiamine metabolism. Pathological changes in these signaling pathways affect neuronal survival, energy homeostasis, gene expression, and memory processes. 53,54 Then, Rudolf et al 55 performed a comparative investigation on cerebral glucose metabolism and benzodiazepine receptor distribution. In his study, a considerable reduction in benzodiazepine receptor binding sites in all cortical regions was found. It was concluded that the reduction in glucose metabolism was due to a loss of functional neurons. Moreover, Cao et al 56 found that decrease in CMRgl was sensitive in evaluating cognitive function, and decrease in CMRgls of the frontal lobe, temporal lobe, parietal lobe, limbic system, and basal ganglions markedly indicated that the global function was decayed in patients with AD. Decreasing of CMRgl in the left caudate nucleus has a certain role in the diagnosis of MCI. Because hypometabolism in the posterior parietal cortex was among the first in vivo signs of AD 57 and cerebral hypoperfusion could exist in early AD, 58 it was also suggested that a good correlation existed between blood flow and metabolism in most regions of the brain. Sakamoto and Ishii 59 described an observation in a study of 8 healthy volunteers. In their investigation, brain glucose metabolism and brain perfusion were measured with 18F-FDG-PET. They found higher perfusion and lower glucose metabolism in cerebellum than other neocortical structures. Nevertheless, it is still unclear whether hypoperfusion or hypometabolism is one of the causal factors for the pathogenesis of AD or an early consequence of a multifactor condition that would lead to AD of late stage.
The ability to measure regional glucose metabolism using 18F-FDG-PET has offered profound insights into preclinical stages of AD and has shown great potential as a diagnostic add-on to the clinical workup of patients with cognitive deficits. 60 On the other hand, by recognizing specific patterns of cerebral glucose metabolism, it may differentiate AD among other neurodegenerative diseases and dementia subtypes. 61 In AD rats, further researches can be done focusing on the neuropathological changes in certain cerebral region with altered glucose metabolism. Promisingly, with full understanding of AD-related glucose metabolic brain pattern in rats, pharmacological research will be conducted intensively and specifically which can contribute to the detection of early AD.
In summary, our findings not only provide information about the changes in glucose metabolic activity and memory ability in AD rats but also offer a new perspective on the mechanism of regional metabolism changes in patients with AD. However, there are some limitations in this study. First, to induce our AD model, we chose IP injection of
Conclusion
In this study, we have shown that weakened learning and memory abilities were associated with AD, and in AD rats, altered glucose metabolism was found in certain cerebral regions with 18F-FDG-PET technology which could be applied as a method of detecting early AD. We also proposed several explanations to variation in glucose metabolism. Further investigations regarding the mechanism of changed glucose metabolic activity need to be done.
Footnotes
Acknowledgments
This project was supported by the National 973 Programs of China (No 2006CB504505 and No 2012CB518504) and the National Nature Science Foundation of China (No 90709027).
Authors’ Note
Yangjia Lu is the first author and Jie Ren is the co-first author.
Declaration of Conflicting Interests
The authors declared no potential conflicts of interest with respect to the research, authorship, and/or publication of this article.
Funding
The authors received no financial support for the research, authorship, and/or publication of this article.