
Abstract
Possession of the apolipoprotein E4 (APOE4) allele and diabetes risk are independently related to reduced white matter (WM) integrity that may contribute to the development of Alzheimer’s disease (AD). The purpose of this study is to examine the interactive effects of APOE4 and diabetes risk on later myelinating WM regions among healthy elderly individuals at risk of AD. A sample of 107 healthy elderly (80 APOE4−/27 APOE4+) individuals underwent structural magnetic resonance imaging/diffusion tensor imaging (DTI). Data were prepared using Tract-Based Spatial Statistics, and a priori regions of interest (ROIs) were extracted from T1-based WM parcellations. Regions of interest included later myelinating frontal/temporal/parietal WM regions and control regions measured by fractional anisotropy (FA). There were no APOE group differences in DTI for any ROI. Within the APOE4 group, we found negative relationships between hemoglobin A1c/fasting glucose and APOE4 on FA for all later myelinating WM regions but not for early/middle myelinating control regions. Results also showed APOE4/diabetes risk interactions for WM underlying supramarginal, superior temporal, precuneus, superior parietal, and superior frontal regions. Results suggest interactive effects of APOE4 and diabetes risk on later myelinating WM regions, which supports preclinical detection of AD among this particularly susceptible subgroup.
Introduction
Alzheimer’s disease (AD) afflicts nearly 10% of individuals over the age of 70 and accounts for the highest proportion of total dementia cases, with up to 75% carrying an AD diagnosis. 1 Increased attention has been given to earlier preclinical detection among individuals who are at risk of AD, which is especially important for identifying targeted treatments to alter the trajectory of neurodegeneration. Two of the most significant factors examined include genetic and cerebrovascular disease (CVD) risk. Researchers have investigated the utility of combining genetic or CVD risk factors with other biological markers, such as brain volume, 2 –5 but no studies have investigated possible interactive effects of these variables to facilitate earlier detection of AD in a subclinical sample. The most salient of the genetic risks strongly associated with the common form of AD is the apolipoprotein E4 (APOE4) allele on chromosome 19. 6 –8 Structural magnetic resonance imaging (MRI) studies of nondemented APOE4 carriers have revealed brain changes that are quite consistent with findings demonstrated in AD. 4,5,9 –17 Similar to AD, APOE4 status is also associated with white matter (WM) abnormalities that may contribute to age- and disease-related neurodegeneration. 18 –24
In addition to APOE4, conditions affecting the vascular system are also known to increase the risk of AD1 and to result in similar morphological brain changes. 25 In particular, diabetes mellitus (DM) is associated with neurologic dysfunction, including brain atrophy, vascular compromise, and increased risk of Alzheimer’s brain pathology. 2 Notably, changes to brain tissue integrity can result from even subclinical levels of CVD risk factors such as blood pressure, cholesterol, and glucose regulation, 26 –30 and in the case of DM, dysregulated or elevated glucose has been found to be associated with reduced WM microstructural integrity. Geraldes and King 31 posit that, among metabolic factors, hyperglycemia (ie, abnormally high glucose) can have one of the strongest effects on the development of vascular complications. These findings highlight the importance of degree of glucose dysregulation in the resulting severity of WM dysfunction and suggest an additional target for preclinical detection of disease.
Of particular importance is the relationship between glucose abnormalities and APOE4 on the development of AD. Diabetes mellitus and APOE4 each increase the risk of dementia, 32 but the combination of both factors increases the risk of AD by approximately 4 to 5.5 times 33,34 and has been associated with cognitive impairments, 35 as well as increased neuritic plaques and neurofibrillary tangles, and higher risk of cerebral amyloid angiopathy, 34 suggesting AD neurodegeneration.
Interestingly, the combination of APOE4 genotype and abnormal glucose has been associated with neuritic plaque formation, 36 poor episodic memory, 37,38 and increased amyloid precursor protein 38 ; this relationship may be a function of the extent of glucose elevation or dysregulation, and not exclusively dependent upon achievement of a clinical threshold per se. However, no studies have addressed the effect of these combined risks on WM.
Preclinical detection of AD is advanced through earlier identification of neuropathological changes that may be associated with these subclinical conditions that increase AD risk. Since research has demonstrated that vascular dysfunction may precede cortical neuropathology in AD, 39 examination of WM changes may be most productive during the earliest stages 40 –42 ; this additional role of WM has already been documented. 43,44 Employing methods with greater sensitivity to detect pathological changes in at-risk individuals may reveal affected regions earlier in life and with greater specificity. It has been argued that regionally specific WM degeneration plays a role in the development of AD and that WM breakdown in later myelinating cortices may be more rapid among those at risk of AD. 45 –50 Bartzokis and Lu 45,46 posited that since higher order areas continue to mature over a more protracted period, these regions are more vulnerable to preferential myelin breakdown in the presence of risks including APOE4. 45,46,50 Prior studies of DM have already shown WM reductions in later myelinating regions. 51 –53
Diffusion tensor imaging (DTI) is a novel MRI method that is well equipped to assess the microstructural integrity of cerebral WM 54,55 and has been shown to detect subtle pathology that may not be revealed with conventional MRI. 56 –59 Studies conducted in our laboratory demonstrate vulnerability to frontal WM in healthy elderly individuals and those with subtle cerebrovascular risks 60,27 and myelin pathology in parahippocampal WM in AD 61 ; recent studies have also found reduced WM integrity in APOE4 individuals. 22,62 –66
The purpose of the current investigation was to examine the interactive effects of APOE4 and diabetes risk on WM integrity among a sample of older adults with varying (mild–moderate) levels of glucose dysregulation and without dementia. We predicted to find reduced WM integrity among later (vs early or middle) developing regions in APOE4 individuals with abnormal glucose. The current study applies DTI methods in a largely subclinical sample in order to explore microstructural changes that may precede clinical diagnosis of AD.
Materials and Methods
Participants
VA Institutional Review Board guidelines for research on humans, including obtaining informed consent and de-identifying participant data, were followed. One hundred and seven healthy elderly participants underwent structural MRI with DTI. The current sample is similar to those employed in Leritz et al 28,67 and Williams et al. 30 Briefly, participants were recruited from 2 separate but overlapping studies examining the ways in which common cerebrovascular risk factors impact brain structure and cognition. Twenty-nine participants were selected (based on their agreement to undergo structural MRI) from a larger sample recruited by the Harvard Cooperative Program on Aging (HCPA) for the Claude Pepper Older American Independence Center (OAIC) of Harvard Medical School. Participants in this program were recruited from the community in response to an advertisement appearing in the HCPA newsletter asking for healthy community-dwelling older African Americans. Seventy-eight participants were recruited through the Understanding Cerebrovascular and Alzheimer’s Risk in the Elderly (UCARE) program, a study investigating how cerebrovascular risk impacts brain structure and cognition and risk of dementia. Participants in the UCARE study were recruited through the Boston University Alzheimer’s Disease Center (BUADC) based on the initial criteria of having a first-degree family relative with dementia. Participants in both the OAIC and UCARE samples were excluded for the following reasons: a history of head trauma of “mild” severity or greater according to the criteria of Fortuny et al 68 (eg, loss of consciousness for greater than 10 minutes), any history of more than one head injury (due to possible cumulative neuropathological effects), diagnosis of any form of dementia (ie, Parkinson’s disease, AD, and vascular dementia), any severe psychiatric illness, or any history of brain surgery or stroke. Participants were also excluded if they presented with the e2 allele (n = 2), given its well-understood protective role in AD. All participants were literate with at least a ninth grade education. Mini-Mental State Examination (MMSE) scores ranged from 23 to 30. These scores are in a range outside of a dementia diagnosis, according to normative data of the 2 racial groups (Caucasian and African American) in this sample. 69
Glucose Measurement
Following informed consent, fasting blood was drawn and processed for analysis of glucose. Fasting glucose levels less than 100mg are considered “normal,” levels between 100 and 125 are considered “mild,” and levels more than 126 mg are considered to be indicative of potential diabetes (American Diabetes Association). 70 Glucose levels ranged from 65 to 156 mg in the current sample. In addition to glucose levels, we also obtained a measure of glycosylated hemoglobin A1c (HbA1c) on each participant. Hemoglobin A1c is a form of hemoglobin, which is used to estimate the average plasma glucose concentration over a period of 4 to 12 weeks. Thus, it is an indicator of how regulated glucose levels have been, and it is particularly useful in evaluating patients with diabetes. Hemoglobin A1c ranges from 4 to 14; levels of 7 and more are indicative of poorly controlled blood sugar and potentially greater cerebrovascular risk (American Diabetes Association). 70 Hemoglobin A1c levels ranged from 4.9 to 8.4 in the current sample. Of the total sample, 85 individuals were taking medications to control cerebrovascular risk. Of these individuals, 37 (34.5%) were prescribed treatment to manage blood pressure, 25 (23.3%) were prescribed treatment to manage cholesterol, and 8 (7.5%) were prescribed treatment to manage diabetes.
APOE Genotyping
The procedure (well established) for DNA extraction and genotyping is as follows: genomic DNA from each individual was prepared directly from peripheral blood samples using the Pure Gene DNA extraction kit (Gentra Systems, Minneapolis, Minnesota), with minor modifications. In the cases of buccal swabs, DNA were isolated using a kit from Epicentre Technologies (Madison, WI). The DNA was stored and an aliquot was removed for APOE genotyping. To 25 pmol of each primer, 2.5 μL of dimethyl sulfoxide, and 25 μL of 0.5 units of AmpliTAQ polymerase, 200 ng of DNA were added. The polymerase chain reaction (PCR) was carried out using the following primers: 5′-TCCAAGGAGCTGCAGGCGGCG-3′ and 5′-ACAGAATTCGCCCCGGCCTGGTACACTGCCA-3′ under the following conditions: 94°C for 5 minutes for denaturing followed by 40 cycles of 65°C for 0.5 minute, 70°C for 1.5 minutes, 94°C for 0.5 minute, and a final extension at 70°C for 10 minutes. A 227 bp PCR fragment was produced. The amplification product was then digested with CfoI for 3 hours at 37°C. The digestion product was then electrophoresised for 2 hours on a 4% MetaPhor Agarose gel. The APOE alleles were distinguished from one another due to the different CfoI digestion products.
Neuroimaging Protocol
All participants were scanned using a whole-head high-resolution DTI scan. Four participants were scanned using a Siemens 1.5 Tesla Sonata system (Berlin, Germany), with the following parameters: magnetization-prepared rapid acquisition with gradient echo (MPRAGE); inversion time (TI) = 1000 milliseconds, repetition time (TR) = 2.73 seconds, echo time (TE) = 3.39 milliseconds, flip angle = 7°, slice thickness = 1.33 mm, 128 slices, field of view (FOV) = 256 × 256 mm; DTI: TR = 9000 milliseconds, TE = 68 milliseconds, 60 slices total, acquisition matrix = 128 × 128 (FOV = 256 × 256 mm), slice thickness = 2 mm (for 2 mm3 isotropic voxels) with 0 mm gap, with a b value = 700 s/mm2, 10 T2 and 60 diffusion-weighted images, and 1 image, the T2-weighted “low-b” image with a b value = 0 s/mm2 as an anatomical reference volume. The remaining 103 participants were scanned on the upgraded Siemens 1.5 Avanto System, with slightly different parameters; MPRAGE: T1 = 1000 milliseconds, TR = 2.73 seconds, TE = 3.31 milliseconds, flip angle = 7°, slice thickness = 1.3 mm, 128 slices, FOV = 256 × 256 mm; DTI: TR = 7200 milliseconds, TE = 77 milliseconds, 60 slices total, acquisition matrix = 128 × 128 (FOV = 256 × 256 mm), slice thickness = 2 mm (for 2 mm3 isotropic voxels) with 0 mm gap, with a b value = 700 s/mm2, 10 T2 and 60 diffusion-weighted images, and 1 image, the T2-weighted “low-b” image with a b value = 0 s/mm2 as an anatomical reference volume. Acquisitions used a twice-refocused balanced echo to reduce eddy current distortions. 71 The DTI scan was comprised of 10 T2 and 60 diffusion-weighted images, and 1 image, the T2-weighted “low-b” image, with a b value = 0s/mm2 as an anatomical reference volume. The total acquisition time for the DTI scan was 8 minutes 31 seconds.
Image Processing
DTI preprocessing and analysis
Preprocessing was performed with diffusion tools developed at the Martinos Center as part of the Freesurfer software package (http://surfer.nmr.mgh.harvard.edu) as well as tools provided with the FSL processing suite (http://www.fmrib.ox.ac.uk.ezp-prod1.hul.harvard.edu/fsl). 72 See our previous work 29,30 for additional details. Diffusion volumes were eddy current and motion corrected using FSL’s Eddy Correct tool. The diffusion tensor was calculated for each voxel using a least-squares fit to the diffusion signal. The T2-weighted low-b volume was then skull stripped using FSL’s Brain Extraction Tool, 72 and this volume served as a brain mask for all other diffusion maps. The low-b structural volume was collected using identical sequence parameters as the directional volumes with no diffusion weighting and was thus in complete register with the final diffusion maps. Fractional anisotropy (FA) maps were entered in voxel-based analyses using the Tract-Based Spatial Statistics (TBSS) procedure for interparticipant spatial normalization. 73
DTI image processing
Voxel-wise processing of the FA data was carried out using TBSS, 73 part of FSL. 72,30 In this procedure, all patients’ FA data were aligned into a common space using the nonlinear registration tool FNIRT 74,75 that uses a b-spline representation of the registration warp field. 76 The TBSS procedure next creates a mean FA image by averaging all participants’ aligned FA maps, and then thresholds this average for voxels with an FA ≥0.2 to generate a mean FA skeleton that represents the centers of all tracts common to the group. This use of the FA skeleton helps avoid inclusion of regions that are likely composed of multiple tissue types or fiber orientations and may be susceptible to partial volume contamination. The next step in the TBSS processing is a projection of each participant’s regional diffusion values to the appropriate location on the template skeleton, and this information was entered into voxel-wise group statistics. Data along the skeleton were smoothed utilizing an anatomical constraint to limit the smoothing to neighboring data within adjacent voxels along the skeleton. Statistical maps were dilated from the TBSS skeleton for visualization.
Region of interest analysis
The first set of regions of interest (ROIs) was generated using the Johns Hopkins University WM labels available as part of the FSL suite. The second ROI approach employed T1-based WM parcellations automatically created during the FreeSurfer processing stream, 77 regional measures were based on gyral folding patterns 78 that were subsequently diffused from the cortex into the subjacent WM resulting in a WM parcellation for each gyral label, unique to each individual’s anatomy. Registration of the T1 image to the low-b volume was performed using the FreeSurfer bbregister tool, 79 a novel procedure that utilizes tissue contrast (gray matter [GM]/WM) as the basis of the registration cost function. White matter values were extracted from voxels limited to the TBSS skeleton to correspond to voxel-based analyses and to reduce the influence of partial volume contamination. The ROI-segmented mean skeleton was deprojected from TBSS standard space to each participant’s native diffusion volume using the inverse of the participant’s transform to standard space to extract native values. Statistics were then extracted from native diffusion maps, with each segmentation comprising voxels representing the center of WM tracts within each region. Right and left hemisphere ROIs were averaged. See Figure A1 for an image depicting the TBSS ROI analysis procedure.
We included 7 later myelinating ROIs, since breakdown in these WM regions may be more rapid among healthy APOE4+ and associated with the development of AD degeneration. 45,47 –49 These regions included supramarginal, superior frontal, superior parietal, inferior temporal, middle temporal, superior temporal, and precuneus WM, which is the last to mature. 47,80,81 The control regions including the genu and splenium are middle developing, 82,83 and the projection fibers of the corticospinal tract (including the cerebral peduncles) are among the earliest myelinating tracts. 84
Statistical analyses
For preliminary analyses, we used chi-square (for categorical dependent variables) and 1-way analysis of variance (ANOVA; for continuous dependent variables) tests. Analysis of variance models were also used to examine APOE group differences on DTI data. We conducted bivariate Pearson’s correlations between all ROIs and diabetes risk measures in both genetic groups (APOE4+ and APOE4−). For those regions in which WM integrity was associated with diabetes risk, a hierarchical multiple regression (MR) model was conducted to predict the interactive impact of genetic factors and diabetes risk on WM integrity. First, age was entered as a covariate (model 1), then APOE status and diabetes risk (fasting glucose and HbA1c) were introduced as main effects (model 2), and finally a 2-way interaction term was entered (APOE4 × glucose measure [HbA1c or fasting glucose]) in the third step (model 3). Dependent variables included FA for 7 study and 3 control regions. We did not control for multiple comparisons to allow for maximum exploration of study variables. An α value was set at .05.
Results
There were no differences between APOE4 groups on demographic variables including age, education, gender, and ethnicity. Of the total sample, the average age of male was 67.9 years (standard deviation [SD] = 9.1 years) and average education of male was 14.9 years (SD = 2.7). Males comprised 37.0% of the APOE4+ group and 38.8% of the APOE4− group. Of the total sample, 33.6% were African American and 66.4% were Caucasian. Average fasting glucose in male was 95.3 (SD = 17.3) and average HbA1c in male was 5.8 (SD = 0.68). Due to the recruitment criteria for the BUADC study, there was a high prevalence (87.9%) of individuals presenting with a positive first-degree family history of dementia, placing them at higher risk of developing dementia. 85 Among the APOE4 group, 2 participants presented with 2 copies of the E4 allele (APOE 4/4), and the remaining 25 participants were heterozygous (APOE 3/4) for the E4 allele. With regard to glucose functioning among the total sample, 24 (22.4%) participants would be considered to have “mildly” elevated glucose levels, while 9 (8.4%) would be considered “diabetic” according to clinical standards. Thus, 91.6% of all participants would be considered to have normal to mildly elevated fasting glucose levels. Additionally, 8 (7.4%) individuals had HbA1c levels of 7 and more, indicating poorly controlled sugar levels in the months preceding evaluation for these individuals. Thus, the majority of our sample had appropriately regulated glucose at the time of the assessment. With regard to global cognition, 1 patient had an MMSE score of 23, and only 3 had scores of 24, and results were not altered when eliminating these participants. Thus, it is likely that this small number of individuals with lower scores did not impact overall results or interpretation of the data. See Table A1 for descriptive statistical data for demographic variables.
Analysis of Variance Models
See Table A2 for descriptive statistical data for groups on ROIs. One-way ANOVA analyses revealed no differences between the APOE groups (APOE4+ and APOE4−) on any study ROI (for FA).
Pearson’s Bivariate Correlations
Correlational analyses revealed distinct relationships for the APOE4 group; when APOE groups were examined independently, significant relationships emerged for glucose and HbA1c with late myelinating ROIs for the APOE4 group only. In particular, higher glucose levels and higher HbA1c levels were associated with lower FA in the following regions: supramarginal WM (HbA1c r = −.48, P = .01; fasting glucose r = −.46; P = .02), inferior temporal (HbA1c r = −.41, P = .03; fasting glucose r = −.47; P = .01), middle temporal (HbA1c r = −.47, P = .01; fasting glucose r = −.47; P = .01), superior temporal (HbA1c r = −.37, P = .05; fasting glucose r = −.43; P = .02), precuneus (HbA1c r = −.43, P = .03; fasting glucose r = −.50; P = .008), superior frontal (HbA1c r = −.42, P = .03; fasting glucose r = −.48; P = .01), and superior parietal (HbA1c r = −.42, P = .03; fasting glucose r = −.50; P = .008) WM. These relationships were not significant for the early developing regions (P > .05 for genu, splenium, and cerebral peduncles) or for any relationship in the APOE4− group (P > .05 for genu, splenium, and cerebral peduncles). We also examined relationships to other cerebrovascular risk variables for the APOE4 group, and findings did not reveal significant relationships (although some approached statistical significance) with WM integrity for any of these variables. In particular, blood pressure yielded no significant relationships to WM: (systolic blood pressure) FA supramarginal WM (r = −.18, P = .37), FA inferior temporal WM (r = −.25, P = .20), FA middle temporal WM (r = −.28, P = .16), FA superior temporal WM (r = −.12, P = .56), FA superior frontal WM (r = −.16, P = .42), FA precuneus WM (r = −.33, P = .10), FA superior parietal (r = −.33, P = .09). Cholesterol yielded no significant relationships to WM: (total cholesterol) FA supramarginal WM (r = −.08, P = .70), FA inferior temporal WM (r = −.20, P = .33), FA middle temporal WM (r = −.10, P = .62), FA superior temporal WM (r = −.21, P = .29), FA precuneus WM (r = −.02, P = .93), FA superior frontal WM (r = −.14, P = .50), FA superior parietal WM (r = .07, P = .72); (low-density lipoprotein) FA supramarginal WM (r = −.12, P = .54), FA inferior temporal WM (P = −.15, r = .46), FA middle temporal WM (r = −.13; P = .51), FA superior temporal WM (r = −.22, P = .27), FA precuneus WM (r = −.32, P = .88), FA superior frontal WM (r = −.16, P = .44), FA superior parietal WM (r = −.02, P = .91); and (triglycerides) FA supramarginal WM (r = −.14, P = .50), FA inferior temporal WM (r = −.09, P = .67), FA middle temporal WM (r = −.25, P = .21), FA superior temporal WM (r = .06, P = .77), FA precuneus WM (r = −.05, P = .81), FA superior frontal WM (r = −.12, P = .56), FA superior parietal WM (r = −.19, P = .34). Finally, body weight yielded no significant relationships to WM: (body mass index) FA supramarginal WM (r = −.24, P = .27), FA inferior temporal WM (r = −.04, P = .86), FA middle temporal WM (r = −.32, P = .13), FA superior temporal WM (r = .04, P = .86), FA precuneus WM (r = −.13, P = .56), FA superior frontal WM (r = −.15, P = .48), and FA superior parietal WM (r = −.31, P = .14).
Hierarchical MR Analyses
Separate hierarchical MR analyses were then performed for all study (but not control) regions, given their significance on correlational tests. Independent variables were examined for collinearity. Results of the variance inflation factor (all less than 2.0) and collinearity tolerance (all greater than .76) suggest that the estimated βs are well established.
In step 2 of the (age controlled) analyses, significant main effects were found for glucose in supramarginal (HbA1c: P = .044), middle temporal (fasting glucose: P = .010, HA1C: P = .022), precuneus (fasting glucose: P = .030), and superior frontal (fasting glucose: P = .018, HA1C: P = .006) WM, suggesting that elevated glucose is independently (controlling for age/APOE status) associated with poorer WM integrity (lower FA) in these regions. There were no main effects for APOE4 status in step 2.
A significant (age controlled) interactive effect for fasting glucose × APOE4 was found for supramarginal (P = .020), inferior temporal (P = .043), superior temporal (P = .037), precuneus (P = .022), superior parietal (P = .014), and superior frontal (P = .014) WM, suggesting that APOE4 and higher fasting glucose level predicted poorer WM integrity of these regions. A glucose × APOE4 effect approached significance for middle temporal (P = .096) WM, suggesting that elevated fasting glucose among APOE4+ participants, but not among APOE4− participants, was marginally associated with poor WM integrity in this region.
A significant (age controlled) interactive effect for HbA1c × APOE4 was found for supramarginal (P = .012), middle temporal (P = .046), precuneus (P = .009), and superior parietal (P = .009) WM, suggesting that APOE4 status and glucose dysregulation (HbA1c) predicted poorer WM integrity of these regions. An HbA1c × APOE4 effect approached significance for the inferior temporal (P = .069), superior temporal (P = .065), and superior frontal (P = .070) WM, suggesting that elevated glucose (HbA1c) in APOE4+ was marginally associated with poor WM integrity in these regions. See Table A3 for direct and interactive relationships of APOE4 status and diabetes risk on FA for individual ROIs.
Figure A2 shows scatterplots depicting significant relationships between glucose variables (HbA1c and fasting glucose) and supramarginal WM for each APOE group. See Figure A3 for scatterplots depicting relationships between glucose variables (HbA1c and fasting glucose) and precuneus WM for each APOE group.
Discussion
The current results suggest interactive effects of genetic and CVD risk factors for AD (APOE4 and glucose dysregulation) on later myelinating WM regions in healthy elderly individuals; in particular, the presence of APOE4 and elevated fasting glucose were more strongly associated with WM deterioration versus either risk factor alone. Negative relationships were found between glucose and FA in the APOE4+ group for all 7 later myelinating WM regions but not for the 3 (middle or earlier myelinating) control regions. Further, no relationships were shown between glucose measures and FA in any region for the APOE4− group. Regression analysis further supported these findings by revealing that greater evidence of glucose dysregulation was associated with reduced WM integrity in supramarginal, superior temporal, precuneus, superior parietal, and superior frontal regions in the APOE4+ group only.
The current results demonstrated that glucose dysregulation, a significant risk factor for DM and vascular disease, is particularly detrimental in individuals with the APOE4 allele. Indeed, prior work has also documented a synergistic impact of APOE4 and diabetes on AD risk, with a 5-fold increase in the development of dementia among those affected with both contributions, 34 whereas diabetes alone may be associated with less significant, moderate, risk of AD. 86 The interaction of diabetes and APOE4 on WM dysfunction as documented in the present study reflects neurodegeneration that is consistent with AD and supports a possible pathological mechanism for some individuals who will develop this disease. This apparent association between APOE4 and metabolic dysregulation may be related to the capacity of the E4 allele to regulate vascular functioning. The E4 allele provides a modulatory influence on a variety of vascular factors (eg, diabetes, blood pressure, dyslipidemia, and atherosclerosis 87 ) and may mediate AD risk by decreasing resting cerebral blood flow prior to dementia onset. 88 Previous work has demonstrated an effect of glucose dysregulation on brain WM integrity, namely increased WM hyperintensities, 89,90 –93 and a general decrease in WM volume in frontal and temporal regions. 94,95 Diffusion tensor imaging studies have also revealed that DM is associated with reduced WM integrity in the temporal stem, 53,96 frontal lobe, 51,96 cingulate, occipital lobe, and cerebral peduncles. 96 Thus, our current results suggest that APOE4 may be associated with WM change in the context of vascular burden. Previous work has also revealed preferential impact of these risks (APOE4 and DM), 32 particularly when combined, 33,34 in the development of dementia and AD (increased pathology in the cortex and hippocampus 34 ). Moreover, the combined impacts of both risks on brain structure have also been supported even when considering subclinically dysregulated glucose in the absence of clinical DM, with evidence for neuritic plaque formation, 36 and increases in amyloid precursor protein, 38 alongside cognitive changes. 37,38 Thus, the modulatory influence of CVD risk, and particularly glucose dysregulation, on APOE4 risk may be exerted even in the absence of overt diabetes, suggesting an earlier stage of impact and an additional avenue for preclinical detection in this particularly susceptible at-risk group.
We did not find any significant differences between APOE4 groups in WM integrity. Prior work investigating the impact of APOE4 on brain WM changes using DTI methodology has revealed somewhat conflicting findings; Bendlin et al 62 found no effect of APOE4 on any brain WM region, while others have reported reduced microstructural integrity in individuals with the APOE4 allele among several brain WM regions. 22,63 –65,97 This inconsistency may be attributable to the moderating effect of CVD risk factors, given the results of the present study.
Our results suggested particular impact of AD and CVD risk among the most advanced (ie, latest developing) brain WM areas. Indeed, DTI studies have revealed decreasing diffusion metrics through late childhood and young adulthood within frontal, temporal, and parietal association regions. 81 In particular, the temporal regions included in this study are known to mature even after other association regions are well developed. 80 In addition, Bartzokis and Lu 47 showed that anterior frontal lobe WM myelination peaks at age 44.6, but the anterior temporal lobe WM peaks even later (age 47.5), suggesting very late development of these association regions. In contrast, regions including the corticospinal tract and the genu and splenium develop early in maturation 83,98,99 ; for example, Partridge et al 84 documented that projection fibers of the corticospinal tract included the lowest diffusion values and these values further decreased from 30 weeks gestational age to at term. The corpus callosum has been shown to reach adult myelination by the third year of life, 83 although recent studies have shown continued development into young adulthood (peak FA by age 21 and 25 for genu and splenium, respectively), 82 suggesting that these structures might serve as developmentally intermediate WM regions. The 7 association regions included in our analyses are among the latest areas to develop, whereas the 3 control regions are known to be complete by very early childhood. Our results are consistent with the work of Bartzokis et al 45 –49 who argued that WM breakdown in developmentally later myelinating association cortices may occur earlier among healthy older adults presenting with the APOE4 allele and associated with AD-related neurodegeneration; of note, however, is that the cross-sectional nature of this study prevents interpretation of any possible rate of change over time. Also in support of the retrogenesis model, research in healthy APOE4 has revealed a particular predilection for association regions, 97 alongside accelerated loss of subcortical WM integrity. 97 Although no direct APOE group differences were documented, the pattern of our current findings (ie, affecting later but not earlier myelinating regions, and corticocortical areas before commissural and projection areas) may be potentially explainable by retrogenesis in APOE4 when mediated by CVD risk.
The impact of a disrupted blood–brain barrier (BBB) should also be highlighted when considering the results of the present study, as previous work has revealed a potential common mechanism supporting the observed pathological WM changes. There is increasing evidence supporting anatomic, metabolic, and inflammatory mechanisms for BBB dysfunction as a result of DM. 100 –102 Even in the absence of clinical diabetes, episodes of hyperglycemia disrupt BBB permeability and edema formation, and precipitate neuropathological compromise. 100 Furthermore, APOE deficiency leads to BBB compromise 103 and APOE4 increases the susceptibility of the BBB to injury by regulating the integrity of tight junctions. 104 These results suggest BBB disruption among metabolically dysregulated and genetically at-risk individuals, and an underlying mechanism for microstructural pathology and dementia may be supported.
Although GM atrophy in AD is now well understood, newer work suggests an additional role of brain WM, which precedes these long observed GM changes. Despite the cross-sectional nature of this study, the current work suggests that DTI may reveal pathological WM changes, particularly in individuals with co-occurring CVD risk, before the more prominent dysfunction associated with AD becomes apparent and visible on conventional MRI 56,57,59 and also highlights the prominence of cerebrovascular changes associated with a range of glucose dysregulation. Research during the preclinical phase is particularly important since vascular dysfunction may precede cortical neuropathology 39 ; therefore, it is during this critical period that investigative efforts may be most fruitful. Our results support earlier preclinical detection among this susceptible subgroup and suggest that such identification may serve as a critical biomarker for AD.
The present results suggest that APOE4 and diabetes risk, a significant CVD risk factor, are associated with deterioration among later myelinating WM regions. Findings highlight the importance of even mild metabolic dysregulation in moderating this relationship. Since vascular disease may accelerate WM changes and potentiate neurodegeneration in individuals at genetic risk of AD, inclusion of cerebrovascular risks will be important for advancing future research.
Limitations and Future Directions
Several limitations deserve comment. First, bias may exist in our sample when considering the higher prevalence of individuals with a positive first degree family history of dementia (87.9%), who are known to be at higher risk for dementia 85 ; our data might thus reflect stronger associations between predictor variables and brain microstructure. This study also included a large proportion (33.6%) of African Americans who are known to be at higher risk of vascular conditions 105,106 and increased WM burden. 107 The relationships between CVD and brain WM integrity might not be fully generalizable or may be attenuated in the population. However, this sample characteristic might also be interpreted as a strength as it allowed us to more directly tap factors relevant to vascular risk, which might not be feasible in a lower risk group. Nonetheless, we recommend consideration of this demographic distribution.
The current study is also limited by its cross-sectional design as we are unable to determine how genetics and vascular dysregulation confer longitudinal brain changes, particularly at the time of disease conversion. Although previous work has investigated early detection of AD through genetic status and brain volume, 4,108 none have longitudinally investigated the impact of multiple (genetic and cerebrovascular) risks on WM microstructure.
Moreover, while the majority of participants presented with normal or mildly elevated glucose, a small percentage showed clinically elevated glucose and would be considered diabetic by clinical standards (ie, 9 [8.4%] had elevated fasting glucose and 8 [7.4%] had elevated HbA1c levels); thus, this sample reflects a wider range of vascular compromise than might be suggested by a strictly subclinical sample. Future research should be conducted with individuals presenting at an earlier stage of disease to investigate the limits of these findings. Additionally, data on the duration of vascular risk were not available, which has been shown to be related to WM integrity among DMII 51 ; thus, our ongoing work is now collecting this critical information.
Additionally, due to insufficient within-cell sample size (APOE 3/4 = 25, APOE 4/4 = 2), we were unable to examine the dose-dependent relationships of the number of copies of the E4 allele on WM. Nevertheless, our results were not driven solely by the 2 homozygous participants, and thus the presence of only 1 copy appears sufficient to confer preferential WM degeneration. Among those studies that have more directly addressed this relationship, results have been conflicting; while some investigations have failed to detect dose-dependent differences in brain volume, 4,11,14,16,109 cross-sectional studies of nondemented persons with APOE4 do in fact demonstrate this relationship, 110,111 and thus the relative impact of the number of copies of the E4 allele remains an important area for future investigation.
It is also possible that very mild cases of dementia were undetected, given that only brief screens were conducted to rule out notable cognitive compromise and given that few participants presented with subclinically low MMSE scores (1 participant with a score of 23 and 3 with a score of 24). Clearly, the presence of even mild cognitive difficulties would be expected to be impacted by reduced microvascular integrity. However, all cases of frank dementia (based on MMSE screens) were ruled out. Our future work will consider any impact of the present neuropathological findings on cognition. Indeed, investigation into potential cognitive consequences of APOE4 and diabetes risk warrants future attention as existing data are limited, although current evidence suggests relationships of APOE4 and DM on cognition, particularly in the presence of both risks, 35,112 and these risks appear to interact with WM change in predicting cognitive impairment. 66,97 Further research is needed to expand upon these findings and investigate the combined impacts of both metabolic and genetic risk factors on cognition and its relationship WM change.
Conclusions
In summary, the results of the present study suggest interactive effects of APOE4 and diabetes risk on WM integrity, which supports aggressive management of cerebrovascular risk factors among this particularly susceptible subgroup. The combination of metabolic and genetic risk appears to be particularly deleterious for late myelinating WM integrity among healthy elderly individuals, thus suggesting a critical neuroimaging biomarker for earlier disease detection among individuals who are particularly vulnerable to developing AD.
Footnotes
Appendix A
Direct and Interactive Relationships of APOE4 Status and Diabetes Risk on FA for Individual ROIs.a,b
| ROI | F; M1, M2, M3 | R 2 | Age | APOE4 | Diabetes Measure | AD Interaction | ||||
|---|---|---|---|---|---|---|---|---|---|---|
| b | t | b | t | b | t | b | t | |||
| Glucose | ||||||||||
| Supramarginal | 9.195c | 0.081 | −0.285 | −3.032c | ||||||
| 4.051c | 0.106 | −0.272 | −2.091c | −0.047 | −0.500 | −0.153 | −1.630 | −1.17 | −2.359d | |
| 4.565c | 0.153 | −0.284 | −3.088c | 1.100 | 2.224d | −0.014 | −0.126 | |||
| Inferior temporal | 4.111d | 0.038 | −0.195 | −2.028d | ||||||
| 2.660e | 0.073 | −0.180 | −1.882e | −0.015 | −0.158 | −0.186 | −1.945e | −1.04 | −2.048d | |
| 3.106d | 0.110 | −0.190 | −2.018d | 1.005 | 1.983 | −0.062 | −0.555 | |||
| Middle temporal | 4.479d | 0.041 | −0.203 | −2.116d | ||||||
| 3.942c | 0.104 | −0.183 | −1.946e | −0.043 | −0.462 | −0.248 | −2.637c | −0.85 | −1.682e | |
| 3.717c | 0.128 | −0.191 | −2.052d | 0.786 | 1.567 | −0.147 | −1.329 | |||
| Superior temporal | 1.936 | 0.018 | −0.135 | 1.392 | ||||||
| 1.583 | 0.044 | −0.122 | −1.259 | 0.004 | 0.042 | −0.162 | −1.671e | −1.09 | −2.118d | |
| 2.350e | 0.085 | −0.133 | −1.392 | 1.074 | 2.089d | −0.032 | −0.285 | |||
| Precuneus | 15.812f | 0.132 | −0.363 | −3.976f | ||||||
| 7.017f | 0.171 | −0.347 | −3.841f | −0.009 | −0.099 | −0.198 | −2.193d | −1.12 | −2.328d | |
| 6.846f | 0.182 | −0.358 | −4.043f | 1.082 | 2.296d | −0.066 | −0.626 | |||
| Superiorparietal | 14.493 | 0.122 | −0.350f | −3.807f | ||||||
| 6.170 | 0.154 | −0.336f | −3.673f | −0.052 | −0.573 | −0.170 | −1.865e | −1.21 | −2.503d | |
| 6.432 | 0.171 | −0.348f | −3.896f | 1.128 | 2.351d | −0.027 | −0.256 | |||
| Superior frontal | 1.497 | 0.014 | −0.119 | −1.224 | ||||||
| 2.440e | 0.067 | −0.101 | −1.049 | −0.001 | −0.008 | −0.230 | −2.401d | −1.27 | −2.499d | |
| 3.486c | 0.121 | −0.113 | −1.029 | 1.237 | 2.455d | −0.080 | −0.720 | |||
| Cerebral peduncles | 0.132 | 0.001 | −0.150 | −1.551 | ||||||
| 1.516 | 0.043 | −0.140 | −1.441 | 0.020 | 0.205 | −0.128 | −1.319 | −0.13 | −0251 | |
| 1.230 | 0.046 | −0.142 | −1.445 | 0.150 | 0.284 | −0.113 | −0.969 | |||
| Genu | 17.270f | 0.142 | −0.377 | −4.156f | ||||||
| 7.712f | 0.185 | −0.370 | −4.129f | 0.176 | 1.968e | −0.105 | −1.167 | −0.35 | −0.710 | |
| 5.882f | 0.189 | −0.374 | −4.151f | 0.514 | 1.062 | −0.064 | −0.595 | |||
| Splenium | 2.406 | 0.023 | −0.150 | −1.551 | ||||||
| 1.398 | 0.039 | −0.140 | −1.441 | 0.020 | 0.205 | −0.128 | −1.319 | −0.13 | −0.251 | |
| 1.054 | 0.040 | −0.142 | −1.445 | 0.150 | 0.284 | −0.113 | −0.969 | |||
| HbA1c | ||||||||||
| Supramarginal | 8.315c | 0.073 | −0.271 | −2.884c | ||||||
| 4.323c | 0.112 | −0.287 | −3.075c | −0.041 | −0.440 | −0.190 | −2.035d | −1.86 | −2.550d | |
| 5.040f | 0.165 | −0.299 | −3.288f | 1.789 | 2.473d | −0.025 | −0.228 | |||
| Inferior temporal | 3.736e | 0.034 | −0.185 | −1.933e | ||||||
| 2.557e | 0.069 | −0.201 | −2.106d | −0.007 | −0.073 | −0.187 | −1.958 | −1.39 | −1.838e | |
| 2.807d | 0.099 | −0.210 | −2.225d | 1.364 | 1.815e | −0.064 | −0.551 | |||
| Middle temporal | 3.670e | 0.034 | −0.184 | −1.916e | ||||||
| 3.168d | 0.084 | −0.202 | −2.135d | −0.036 | −0.384 | −0.221 | −2.331d | −1.52 | −2.021d | |
| 3.469d | 0.120 | −0.212 | −2.272d | 1.453 | 1.956e | −0.087 | −0.759 | |||
| Superior temporal | 1.680 | 0.016 | −0.126 | −1.296 | ||||||
| 1.432 | 0.040 | −0.139 | −1.430 | 0.010 | 0.102 | −0.157 | −1.615 | −1.44 | −1.865e | |
| 1.970 | 0.035 | −0.148 | −1.545 | 1.422 | −0.253 | −0.030 | −0.253 | |||
| Precuneus | 14.834f | 0.124 | −0.352 | −3.852f | ||||||
| 5.679c | 0.142 | −0.363 | −3.963f | −0.005 | −0.052 | −0.135 | −1.469 | −1.90 | −2.658c | |
| 6.276f | 0.198 | −0.376 | −4.215f | 1.866 | 2.630c | 0.033 | 0.306 | |||
| Superior parietal | 12.822f | 0.109 | −0.330 | −3.581f | ||||||
| 4.954c | 0.126 | −0.340 | −3.673f | −0.052 | −0.567 | −0.118 | −1.272 | −1.91 | −2.645c | |
| 5.681f | 0.182 | −0.352 | 3.915f | 1.827 | 2.551d | 0.051 | 0.463 | |||
| Superior frontal | 1.196 | 0.011 | −0.106 | −1.093 | ||||||
| 3.078d | 0.082 | −0.128 | −1.355 | 0.011 | 0.166 | −0.268 | −2.822c | −1.38 | −1.832e | |
| 3.200d | 0.111 | −0.138 | −1.466 | 1.368 | 1.832e | −0.146 | −1.268 | |||
| Cerebral peduncles | 0.186 | 0.002 | −0.042 | −0.432 | ||||||
| 0.993 | 0.028 | −0.055 | −0.569 | −0.014 | −0.148 | −0.161 | −1.652 | −0.91 | −1.158 | |
| 1.082 | 0.041 | −0.061 | −0.631 | 0.876 | 1.130 | −0.081 | −0.680 | |||
| Genu | 16.156f | 0.133 | −0.365 | −4.019f | ||||||
| 7.016f | 0.170 | −0.373 | −4.139f | 0.174 | 1.937e | −0.089 | −0.983 | −1.08 | −1.493 | |
| 5.882f | 0.187 | −0.380 | −4.238f | 1.232 | 1.725e | 0.006 | 0.058 | |||
| Splenium | 2.234 | 0.021 | −0.144 | −1.495 | ||||||
| 0.883 | 0.025 | −0.150 | −1.532 | 0.002 | 0.222 | −0.063 | −0.643 | −0.49 | −0.623 | |
| 0.755 | 0.029 | −0.153 | −1.559 | 0.504 | 0.646 | 0.020 | −0.162 | |||
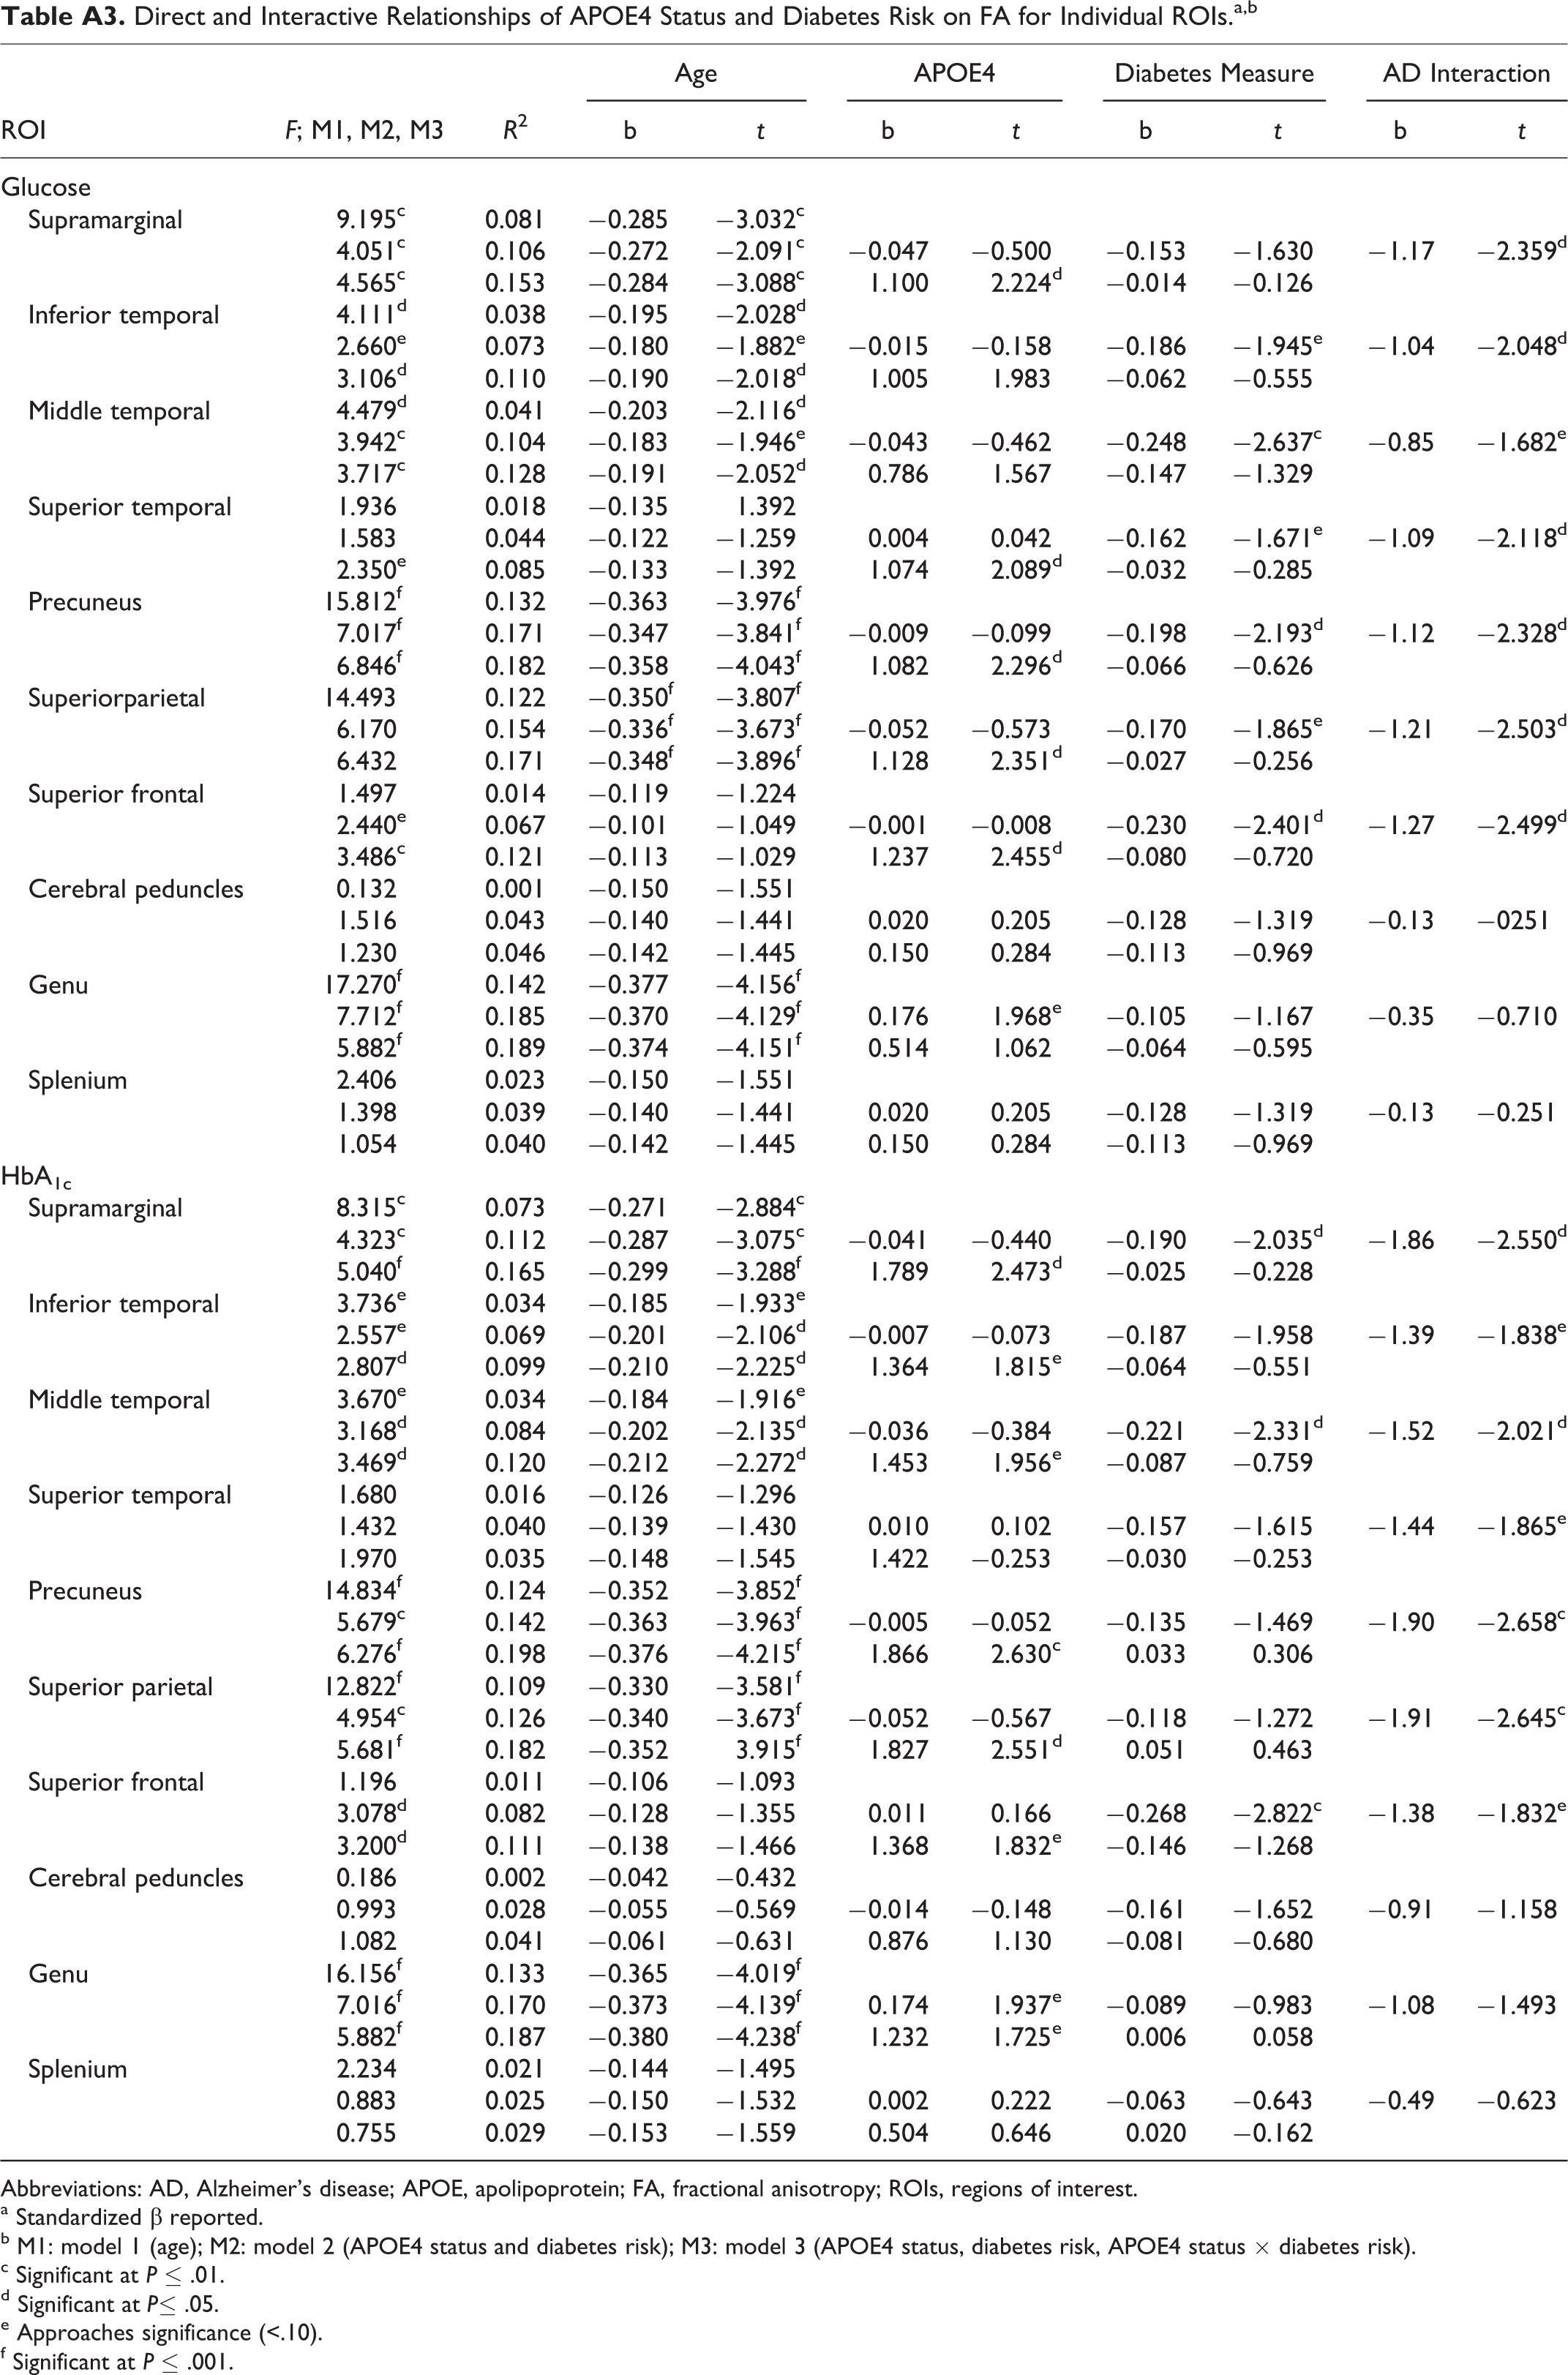
Abbreviations: AD, Alzheimer’s disease; APOE, apolipoprotein; FA, fractional anisotropy; ROIs, regions of interest.
a Standardized β reported.
b M1: model 1 (age); M2: model 2 (APOE4 status and diabetes risk); M3: model 3 (APOE4 status, diabetes risk, APOE4 status × diabetes risk).
c Significant at P ≤ .01.
d Significant at P≤ .05.
e Approaches significance (<.10).
f Significant at P ≤ .001.
Declaration of Conflicting Interests
The authors declared no potential conflicts of interest with respect to the research, authorship, and/or publication of this article.
Funding
The authors disclosed receipt of the following financial support for the research, authorship, and/or publication of this article: This work was supported by the National Institute of Neurologic Disorders and Stroke (K23NS062148), the National Institute of Nursing Research (R01NR010827), the National Institute on Aging (P60AG08812 and P01AG004390), American Psychological Association Division 40, The Rosalind and Arthur Gilbert Foundation/AFAR New Investigator Award in Alzheimer’s Disease, and by Medical Research Service VA Merit Review Awards to William Milberg and Regina McGlinchey.