
Abstract
Introduction:
The Dependence Scale (DS) was designed to measure dependence on others among patients with Alzheimer’s disease (AD). The objectives of this research were primarily to strengthen the psychometric evidence for the use of the DS in AD studies.
Methods:
Patients with mild to moderately severe AD were examined in 3 study databases. Within each data set, internal consistency, validity, and responsiveness were examined, and structural equation models were fit.
Results:
The DS has strong psychometric properties. The DS scores differed significantly across known groups and demonstrated moderate to strong correlations with measures hypothesized to be related to dependence (|r| ≥ .31). Structural equation modeling supported the validity of the DS concept. An anchor-based DS responder definition to interpret a treatment benefit over time was identified.
Discussion:
The DS is a reliable, valid, and interpretable measure of dependence associated with AD and is shown to be related to—but provides information distinct from—cognition, functioning, and behavior.
Introduction
Alzheimer’s disease (AD) is a progressive illness characterized by early symptoms that include memory loss and impaired cognition; later stages are characterized by behavioral disturbances. 1,2 This constellation of cognitive, functional, and behavioral impairment is what creates the need for assistance, 3 resulting in substantial caregiver burden. AD accounts for two-thirds of all dementia cases and affects 8% of people older than 65 years and 15% of people older than 85 years. 4 The average length of time between onset of AD and death is 8 to 10 years, 5–7 and it is estimated that 2 to 4 million Americans and over 30 million people worldwide have been affected by AD. 4,8
Dependence on caregiver assistance is an important concept in Alzheimer’s research. 9,10 The Dependence Scale (DS) was originally developed by Stern and colleagues 11 to capture the caregiver’s report of the level of dependence of patients with AD based on the care needed. The DS items were adapted from an older instrument developed by Gurland. 12 Stern and colleagues 11 sought to quantify the AD-associated disability in social or occupational function in terms of its impact on the patient and his or her family. They created a version of the DS intended to improve on existing measures of functional capacity, such as the Blessed Dementia Rating Scale (BDRS), 13 by focusing on the degree of dependence and the actual level of care needed. 11 Because of the focus on patient need rather than specific task performance ability, the authors addressed an unmet area of AD measurement. It is important to emphasize that the DS measures the need for caregiver assistance, not the actual care received. There may be factors extraneous to AD that influence the actual care received, for example, lack of nursing home beds or insurance coverage. In AD, dependence is defined as the need for assistance from others, and the DS is intended to measure the need for required care that results from AD. 11,14 The DS was designed to be administered by a trained interviewer to a caregiver of a patient with probable AD.
The relationship between behavior and dependence is also important to assess because troublesome behaviors such as aggression and wandering can result in increased requirements for caregiving. 15,16 The importance of evaluating the interrelationships of these variables is to establish that functioning, behavior, and dependence are distinct end points. Furthermore, although cognition is the primary deficit in the AD process, understanding how cognitive decline affects behavior, functioning, and dependence can help to provide a more comprehensive understanding of the impact of the disease and how it progresses. Cognitive deficits, including primarily memory impairment, deficits in executive functioning, or confusion, causing significant impairment in functioning is a central part of the diagnostic criteria for AD. 17 Functioning refers to how well a person can perform the tasks required to maintain independence in the community.
Modeling of the relationships among cognition, functioning, behavior, dependence, and related variables has been previously reported. Cohen and Neumann 18 reviewed 13 economic models, a number of which incorporate cognition and functioning as predictors of disease outcome. In addition, 1 model by Kinosian et al 19 incorporated cognition, functioning, and behavior in its modeling of disease progression. Murman et al 20 modeled the relationships among cognition, neuropsychiatric symptoms, parkinsonism, and medical comorbidities as predictors of dependence and in turn societal direct costs. In this model, cognition was a stronger predictor of dependency than neuropsychiatric symptoms but was not a significant predictor of societal direct costs, whereas neuropsychiatric symptoms were significant predictors of societal direct costs.
Previous investigations have evaluated the reliability and validity of the DS. For example, Stern and colleagues evaluated the inter-rater reliability of the DS and found an intraclass correlation of .90, indicating excellent agreement between raters. However, the Cronbach’s α measure of internal consistency was lower at .66, 11 albeit acceptably >.65. 21 These authors also found that dependence was a strong predictor of living situation (P < .001) in a logistic regression model. McLaughlin and colleagues 22 found that the DS was significantly related to changes in a measure of behavior (neuropsychiatric inventory [NPI]), a measure of functioning (dependence in AD [DAD]), and a measure of cognition (Mini-Mental State Examination [MMSE]), while not being associated with age. These authors suggested that when predicting costs of AD, MMSE was insufficient, and that other parameters such as those measured by the DS or the DAD ought to be included. Brickman and colleagues 14 demonstrated that dependence changed over time independently of changes in cognition and changes in self-care as measured by the BDRS.
McLaughlin and colleagues 22 found that the association between behavior and cognition was weaker than that between dependence and behavior, and Murman and colleagues 20 found that the association between neuropsychiatric symptoms (akin to maladaptive behavior) and dependence was weaker than that between cognition and dependence. Based on this evidence, it was reasonable to expect that the association between behavior and dependence might be weaker than that between cognition or functioning and dependence. We expected that cognition, functioning, and behavior would all be related to dependence and that functioning would show the strongest relationship to dependence.
The aim of this research was to document further evidence of the psychometric properties of the DS with data from 3 separate studies. The objectives of this article were to (1) evaluate the evidence for the reliability and validity of the DS with a larger and more comprehensive data set than previously used to evaluate these properties of the DS; (2) use structural equation modeling techniques to further explore the theoretical relationships among dependence, cognition, function, and behavior; and (3) evaluate the responsiveness of the DS to change over time and refine criteria for clinical interpretation.
Methods
Participants
The participants in this analysis were drawn from 3 independently conducted studies: the Predictors study 23,20 , the Elan-Alzheimer's Immunotherapy Program-Study 901 (ELN-AIP-901) and the Dependence in Alzheimer's Disease in England (DADE) study. These studies were chosen as they all contained the DS and measures of cognition, functioning, and behavior. The DADE study was cross-sectional, while the Predictors study and 901 study had a longitudinal component. Only patients with AD and a baseline MMSE ≥10 were selected for these analyses, as the analyses focused on the mild to moderately severe range of AD.
Predictors Study
The Predictors I study enrolled 238 participants in the early stages of AD. 24 The Predictors II study enrolled 225 participants beginning in 1997 using the same criteria that were used to enroll Predictors I; these 2 studies were combined for the current analysis and are referred to simply as the Predictors study (n = 460; 2 patients were missing baseline MMSE and 1 had MMSE <10). The purpose of the Predictors study was to examine the predictors of disease progression in patients who met the National Institute of Neurological and Communicative Diseases (NINCDS) criteria for probable AD and who demonstrated mild cognitive impairment (MCI) with a score of ≥10 on a converted MMSE score, based on a linear transformation of the modified MMSE (mMMS 25 ).
The DADE Study
The DADE study was a cross-sectional observational study designed to evaluate a classification model of people with AD based on “dependence on others” and to determine the relationship between dependence and cost of care in a UK setting. The DADE study enrolled 249 patients with a diagnosis of mild, moderate, and severe probable or possible AD according to NINCDS/AD and Related Disorders Association (ADRDA) criteria. However, for the analyses in this article, only mild, moderate, and moderately severe patients with AD (MMSE ≥ 10; n = 172) were included.
The ELN-AIP-901 Study
The 901 study enrolled 341 total patients (196 AD, 70 MCI, and 75 healthy volunteers). The primary objective of the study was to examine the psychometric properties of the neuropsychological test battery (NTB) and the 9 individual NTB subtests in patients with mild to moderate AD and to correlate the NTB with other neurocognitive and functional assessments, among them the DS. The analysis includes only 166 patients with AD and at least 1 DS measurement.
The demographics and some clinical variables for the patients in the Predictors, DADE, and 901 studies are presented in Table 1. The Predictors study was the only study for the DS with 18 months of follow-up from baseline. In the 901 study, the DS was introduced partway through the study. As a result, the 901 study had DS assessments starting at week 26 (n = 95) and at week 52 (n = 140) and week 78 (n = 134), resulting in a maximum 12-month duration between assessments and no baseline. The cross-sectional analyses using the 901 study data in this report used the week 78 data as there were more patients with follow-up DS scores at that time point. The 172 DADE study participants’ mean age (79.9 years) was 5.3 years (95% confidence interval [CI]: 3.5-7.0) older than the 460 Predictors study patients at baseline (74.6 years), and 4.7 years (95% CI: 2.6-6.7) older than the 166 patients from the 901 study. The gender distribution was almost evenly split in DADE, with a higher proportion of females in the 901 study (44%-56% at week 78) and 40% male to 60% female in the Predictors study. The patients in the 901 study were predominantly white (approximately 95% at each time point). Race was not recorded in the DADE or the Predictors studies. In the DADE study, the patients’ mean MMSE at baseline (18.4) was 2.5 points (95% CI: 1.8-3.3) worse than the 460 Predictors patients at baseline (20.9), and 3.3 points (95% CI: 2.4-4.2) worse than the 196 patients from the 901 study at baseline (21.7).
Demographic Summary of Predictors, DADE, and ELN-AIP-901 Studies (AD Group Only).
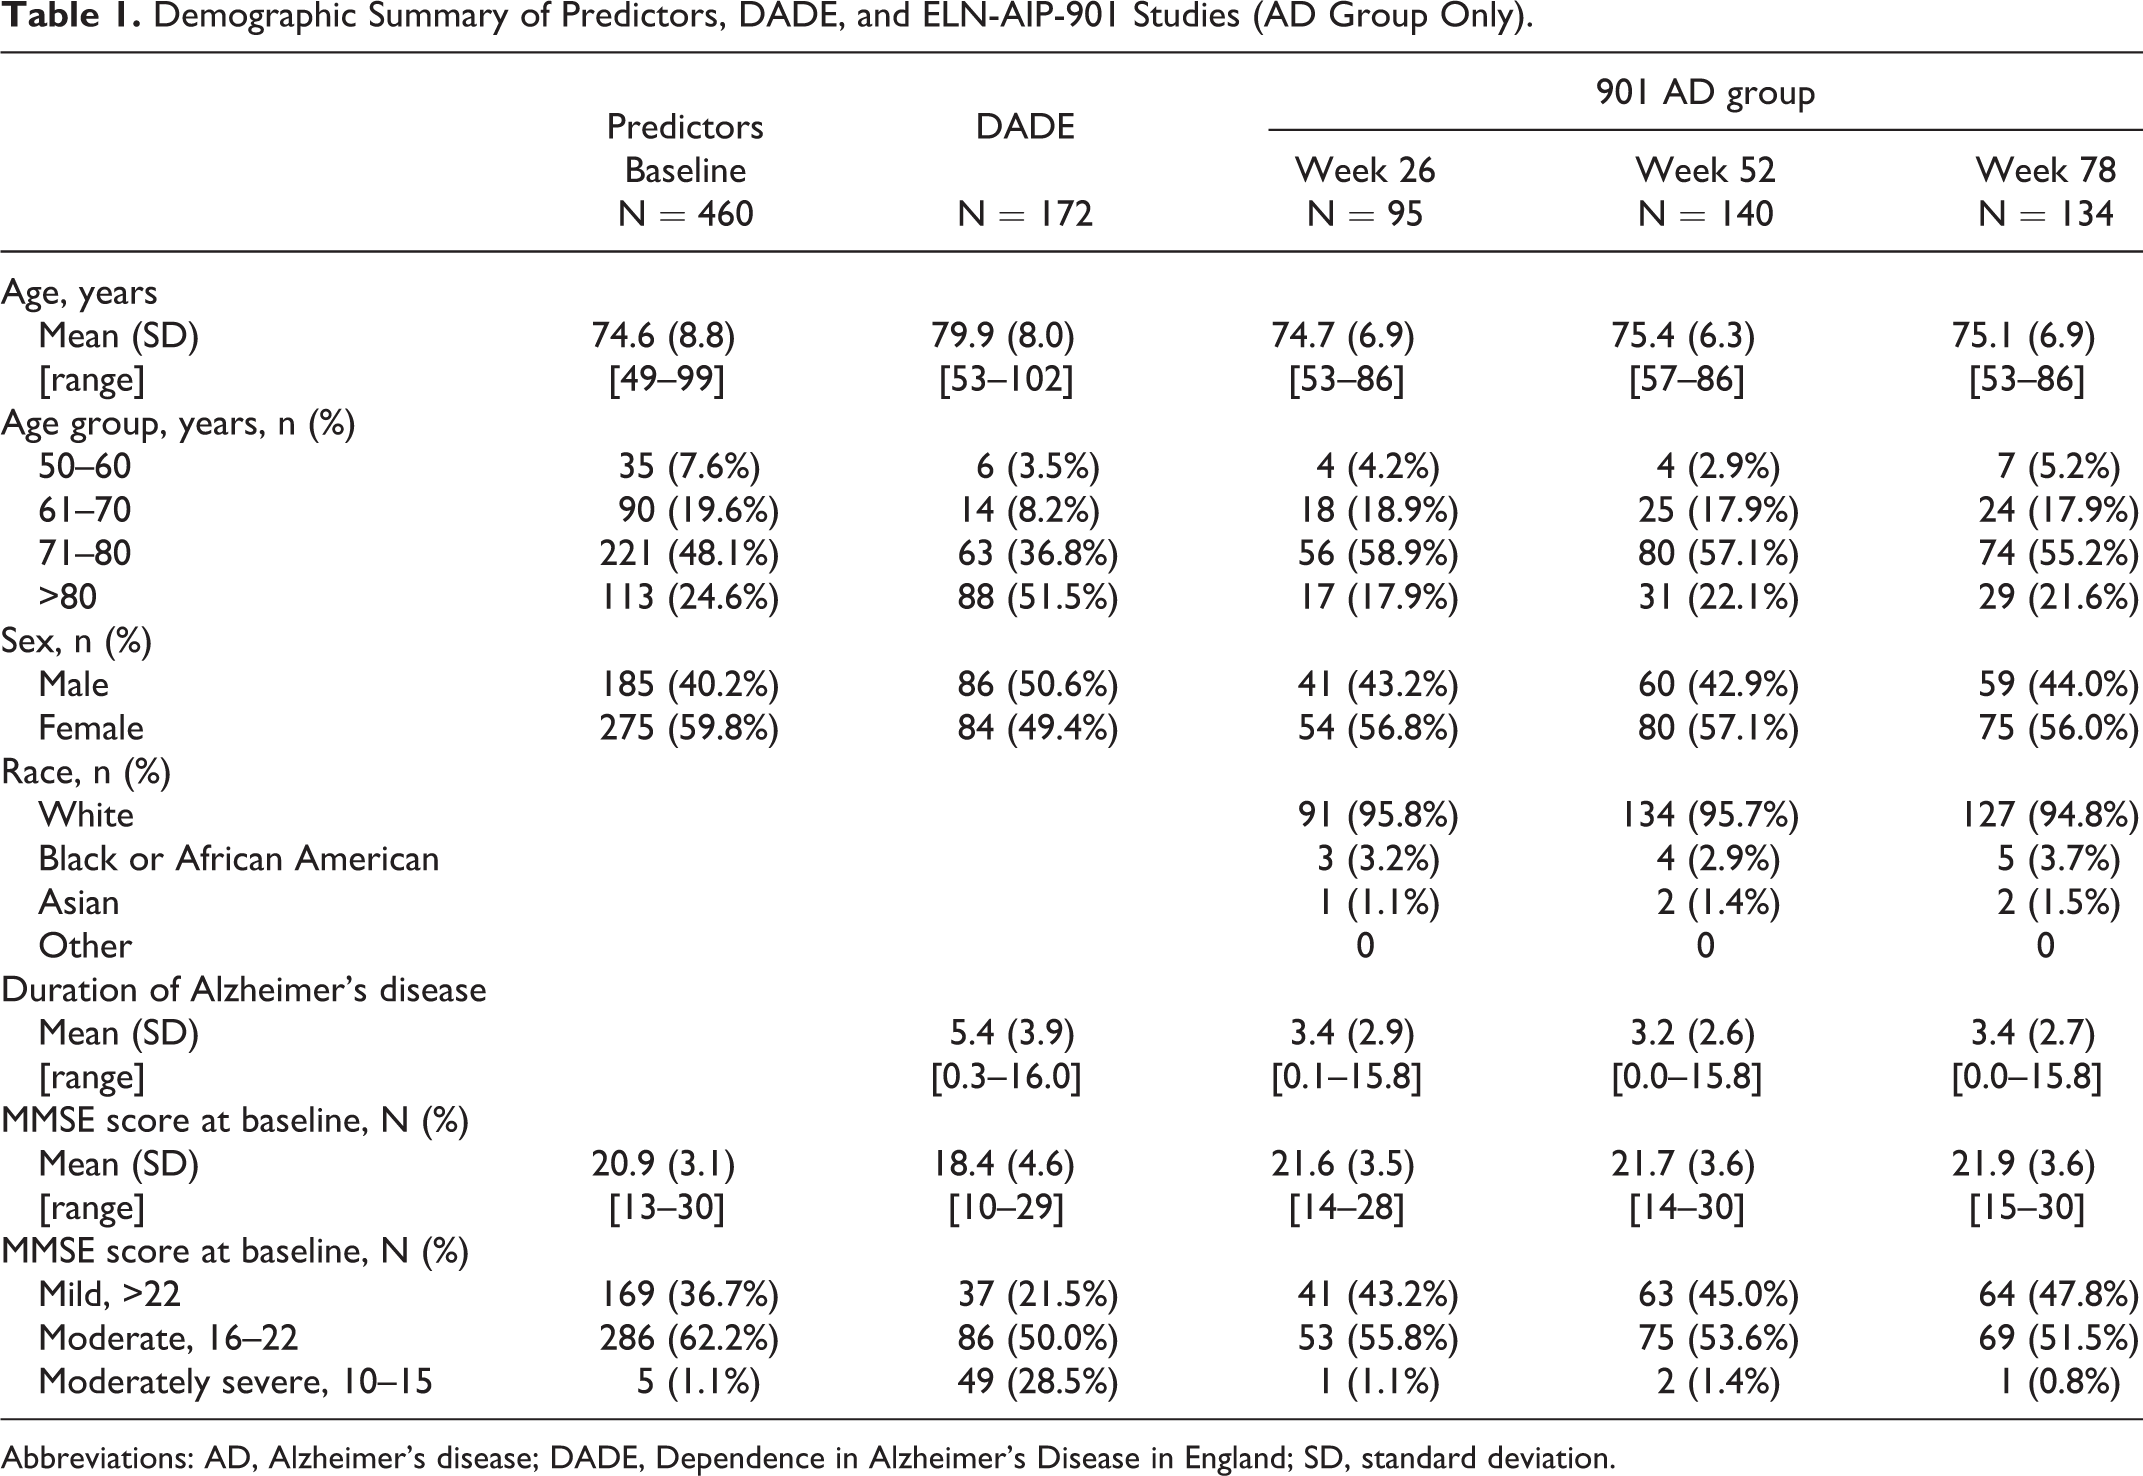
Abbreviations: AD, Alzheimer’s disease; DADE, Dependence in Alzheimer’s Disease in England; SD, standard deviation.
Measures
The following measures of cognition, behavior, and functioning were collected in each study: for cognition, the mMMS (Predictors), MMSE (DADE), and AD Assessment Scale–cognitive subscale (ADAS-Cog; ELN-AIP-901); for maladaptive behavior, the Columbia University Scale of Psychopathology in AD (CUSPAD; Predictors) and NPI (DADE and ELN-AIP-901); and for functioning, the BDRS (Predictors) and the DAD (DADE and ELN-AIP-901).
Dependence Scale
The DS instrument has 2 parts. Part I, which is used in outcome assessments, is comprised of 13 items. The response scale for these 13 items is “yes/no” except the first 2 items that are graded “no/occasionally/frequently.” Part I is scored from 0 to 15. Part II evaluates Equivalent Institutional Care (EIC) and is not used in the DS scoring. There are 3 EIC levels: limited home care, adult home, and health-related facility. The definition refers to the level of care required, not necessarily to the actual placement, as some patients may receive around-the-clock nursing care at home. In some analyses (specified in the tables), an imputation algorithm was used for part I of the DS if an item was missing, in order to compute the total score. The algorithm was based on the logic of the scale. For example, if a patient did not need support for a higher functioning item such as household chores, it was assumed they would not need support for the items that followed it in the scale, such as needing to be watched or kept company when awake.
The BDRS was originally developed in 1968 by Blessed and colleagues to explore the link between cerebral pathology (changes in brain tissue) and severe mental decline in the elderly patients. 13 The BDRS consists of 22 total items assessing functional changes in performing everyday activities (8 items), changes in habits (3 items), and changes in personality, interest, and drive (11 items). These items are rated by close relatives or friends of the patients, and ratings are based on behavioral observations over the preceding 6 months. Overall scores for part I range from 0 (normal) to 28 (extreme incapacity). 26
The NPI is used to assess behavioral and psychological symptoms in patients with dementia. The NPI takes approximately 10 minutes for the clinician to complete a caregiver interview and covers 12 domains: delusions, hallucinations, dysphoria, anxiety, agitation/aggression, euphoria, disinhibition, irritability/ability, apathy, aberrant motor behavior, sleep, and eating. If a symptom is present, it is scored on a 4-point frequency scale and a 5-point severity scale, with the product of these scores ranging between 0 and 20. 27
The CUSPAD is a short semistructured rating scale that a clinician or research technician can administer to an informant. The frame of inquiry is the month before examination. For the current analysis, the dichotomous categories (present/absent) of delusion (paranoid, misidentification, somatic, and abandonment), hallucination (visual, auditory, tactile, and olfactory), and illusion were summed into a behavioral symptoms score ranging from 0 to 3. 28
The ADAS-Cog is a widely used multi-item cognitive functioning instrument that consists of 11 items measuring the disturbances of memory, language praxis, attention, and other cognitive abilities, which are considered to be the core symptoms of AD. 29 The ADAS-Cog score ranges from 0 to 70, with a higher score from baseline indicating decline in cognition.
The MMSE is a widely used, clinician-administered screening tool for cognitive function in patients with dementia, scored from 0 to 30, with higher scores indicating greater cognitive functioning. 30
The DAD is a 40-item functional measurement questionnaire that was designed to evaluate the cognitive processes of initiation, planning, organization, and performance of both instrumental and basic activities of daily living (ADLs) in patients with AD or other dementias. In a caregiver interview, the DAD contains 4 subdomains (hygiene, dressing, continence, and eating), assessing 17 basic ADLs, and 6 subdomains (meal preparation, telephoning, going on an outing, finance and correspondence, medications, and leisure and housework) assessing 23 instrumental ADLs. Higher scores on the DAD scale represent fewer disabilities in performing ADLs, and lower values indicate increased disabilities in performing these activities, with total scores ranging from 0 (most severe) to 100 (without disabilities). 31
Data Analysis
Internal consistency reliability of the DS was evaluated in all 3 studies using Cronbach’s α. Validity was evaluated by examining patterns of convergent and divergent correlations between the DS and measures of cognition (MMSE and ADAS-Cog), function (DAD and BDRS), and behavior (CUSPAD and NPI)—all the measures of cognition, functioning, and behavior that were included in the structural equation models. Known-groups validity of the DS was evaluated through comparing mean scores in different study subgroups defined by MMSE scores and by EIC levels. Mild AD was defined as MMSE between 22 and 26, inclusive; moderate AD was 16 and 21; and moderately severe AD defined as 10 and 15. 30 In the Predictors Study where the mMMS was used, a conversion formula 25 was applied: MMSE = 0.495 × mMMS + 1.495. For the validity analyses, data from baseline and 18 months from the Predictors study were used, but only data from the week 78 visit in the 901 study.
To aid in the interpretation of the correlation matrices presented in the tables, for convergent validity, the DS, BDRS, NPI, CUSPAD, and ADAS-Cog are scored in the same direction, with the MMSE and DAD scored in the opposite direction. For scales scored in the same direction, strong positive correlations (>.50) provide evidence of convergent validity, while for scales scored in opposite directions, strong negative correlations provided evidence of convergent validity. Divergent validity is demonstrated when scales show weak or nonsignificant correlations (eg, <|.30|).
Path models using structural equation modeling techniques in each of the 3 studies evaluated the relationships among dependence, cognition, functioning, and behavior. All path coefficients were standardized, and indirect effects were also output. Specifically, the analysis was evaluating the extent to which cognition and behavior had a direct effect on dependence, or whether these effects were mediated by functioning in fully saturated models. Mplus v6.12 software was used to conduct these analyses.
To develop guidelines for interpretation of change over an 18-month time span, analyses were conducted using the Predictors study database. The magnitude of change over time was evaluated by comparing the mean DS scores in stable subgroups with those of patients demonstrating a worsening in their setting defined by EIC change categories to derive an anchor-based responder definition.
Results
Table 2 provides the evidence for the internal consistency of the DS in all 3 studies. These reliability estimates were remarkably consistent at approximately .72 to .81, exceeding the .70 threshold for group comparisons. 32
Table 3 illustrates the pattern of convergent and divergent validity between the DS and several other measures. These cross-sectional correlations reveal a pattern of strong correlations (|r| > .5) between the DS and measures of functioning (DAD), moderate correlations (.3 > |r| < .5) with cognition (MMSE) and dementia severity (Clinical Dementia Rating Scale Sum of Boxes [CDR-SB]), and relatively weaker correlations with the measure of behavior (NPI).
Internal Consistency Reliability Estimates for DS Data Sets.
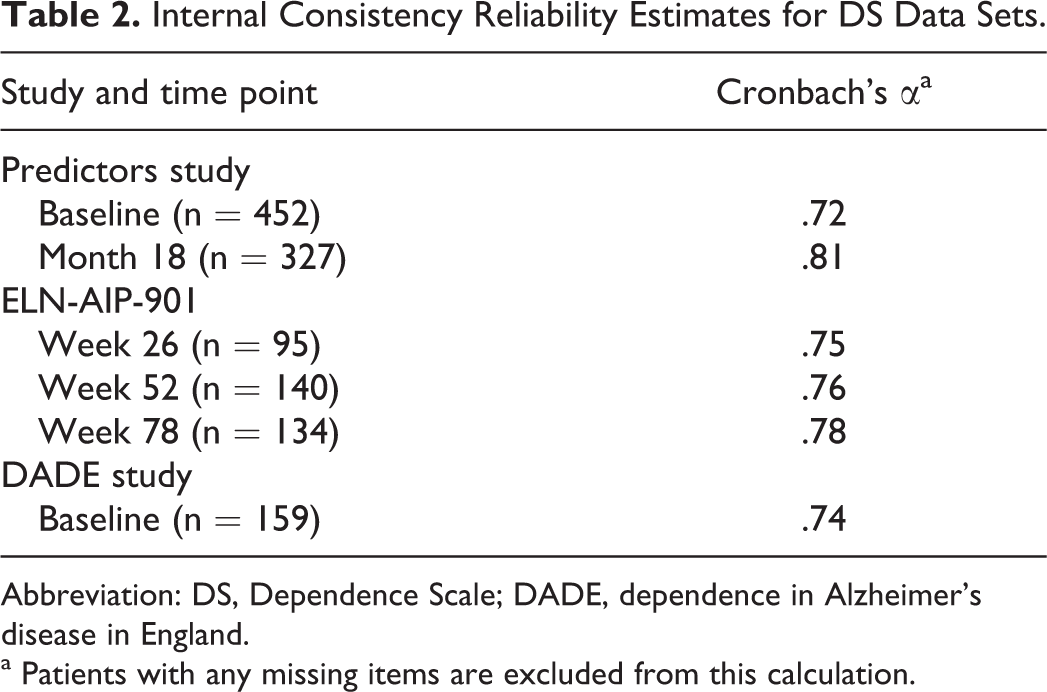
Abbreviation: DS, Dependence Scale; DADE, dependence in Alzheimer’s disease in England.
a Patients with any missing items are excluded from this calculation.
Pearson Correlations Between the DS and Other PRO Study Measures in the Predictors Study at Baseline (n = 431), 901 Study at Week 26 (n = 91) and Week 78 (n = 132), and DADE Study at Baseline (n = 151).a
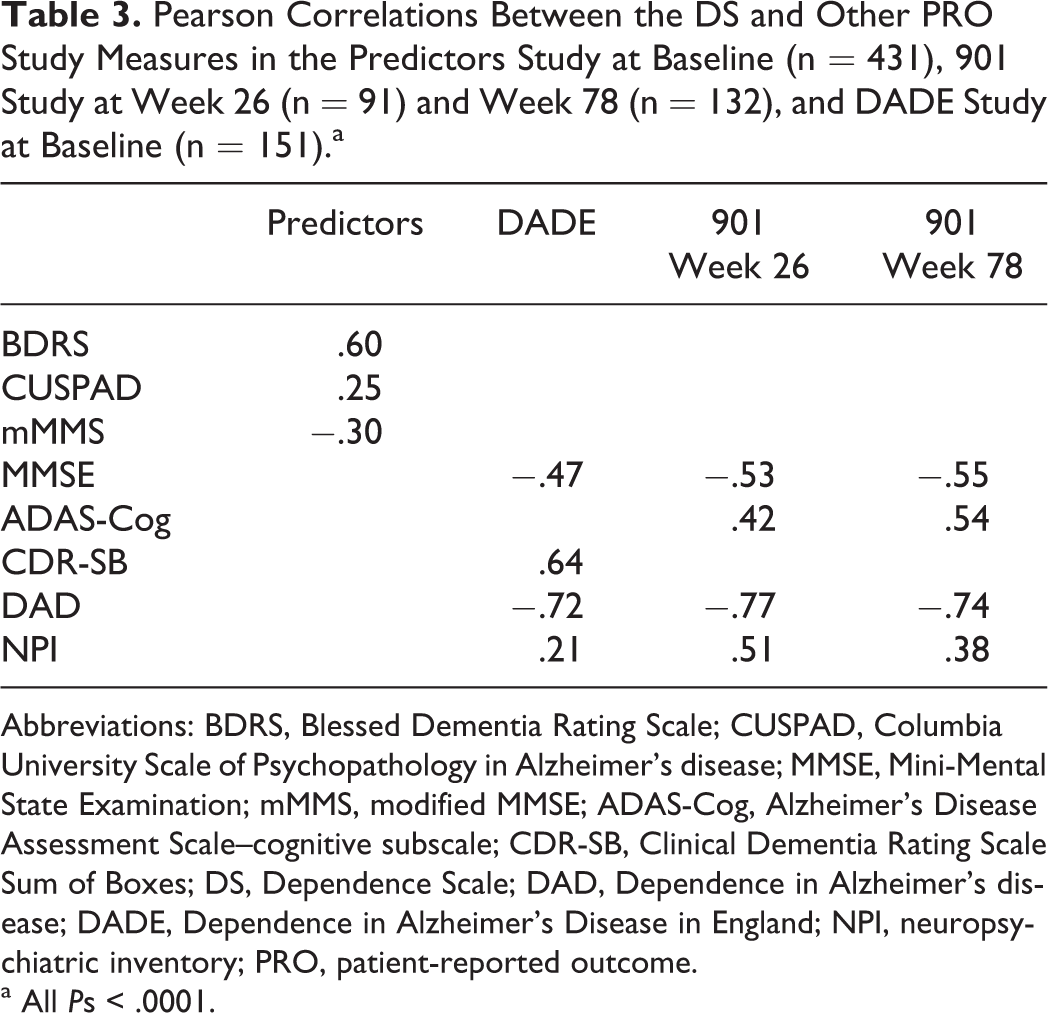
Abbreviations: BDRS, Blessed Dementia Rating Scale; CUSPAD, Columbia University Scale of Psychopathology in Alzheimer’s disease; MMSE, Mini-Mental State Examination; mMMS, modified MMSE; ADAS-Cog, Alzheimer’s Disease Assessment Scale–cognitive subscale; CDR-SB, Clinical Dementia Rating Scale Sum of Boxes; DS, Dependence Scale; DAD, Dependence in Alzheimer’s disease; DADE, Dependence in Alzheimer’s Disease in England; NPI, neuropsychiatric inventory; PRO, patient-reported outcome.
a All Ps < .0001.
Known-groups validity was evaluated by comparing the DS mean scores in subgroups created by MMSE cut points and EIC status. Statistically significant overall and pairwise comparisons for mean scores classified by EIC status, MMSE cut points, and the expanded MMSE severity groupings were observed (Table 4 presents the mean scores by EIC status, and Table 5 presents the mean scores by MMSE groups). The means were all in the expected directions, with the DS scores being lowest in the EIC level limited home care group, ranging to highest in the health care facility group, with intermediate mean scores in the assisted living group. The DS mean score similarly increased across MMSE subgroups, indicating greater dependence, on average, in more severely impaired patients. Table 6 presents known-groups validity results for the Predictors study at baseline and 18 months.
Comparison of Mean DS Scores Across Equivalent Institutional Care Status in the ELN-AIP-901 Study AD Arm at Week 26 (n = 93), Week 52 (n = 138), and Week 78 (n = 132); DADE Study at Baseline (n = 168); and Predictors at Baseline (n = 452) and Month 18 (n = 325).a
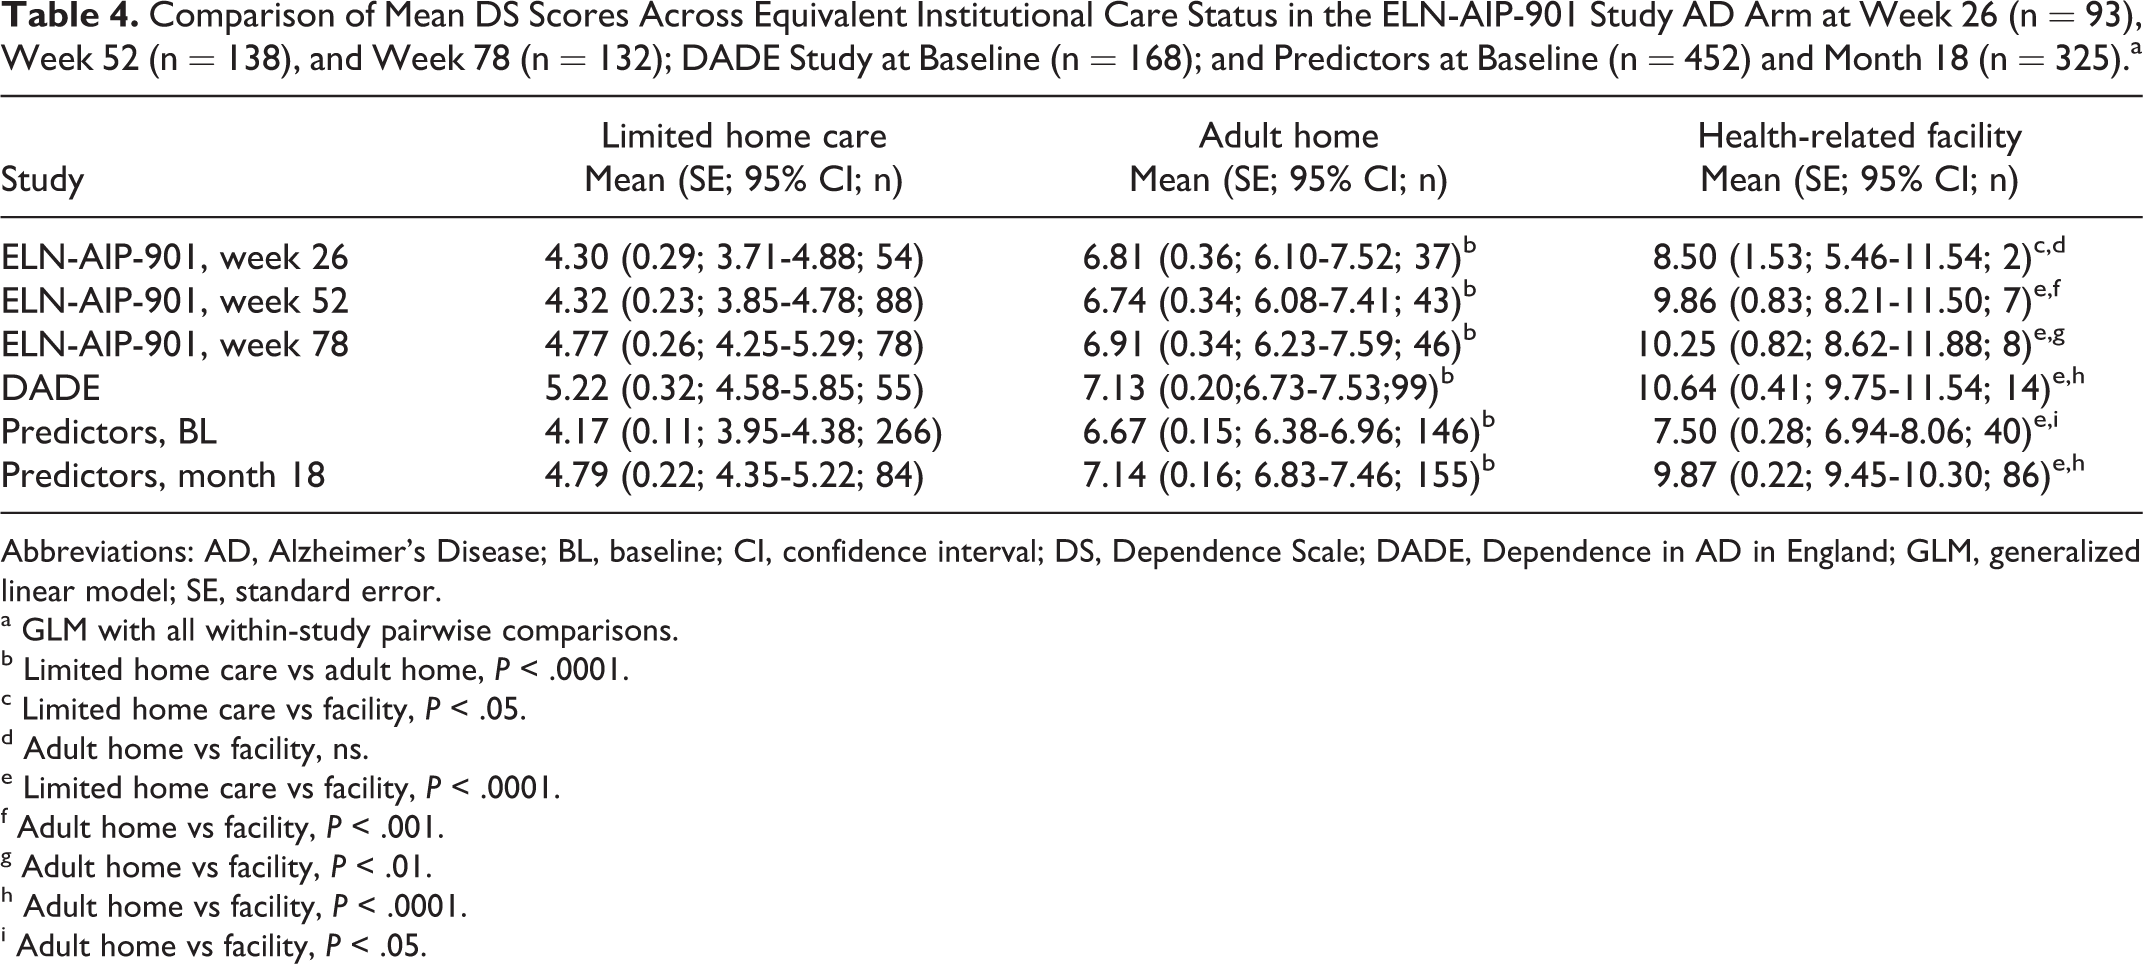
Abbreviations: AD, Alzheimer’s Disease; BL, baseline; CI, confidence interval; DS, Dependence Scale; DADE, Dependence in AD in England; GLM, generalized linear model; SE, standard error.
a GLM with all within-study pairwise comparisons.
b Limited home care vs adult home, P < .0001.
c Limited home care vs facility, P < .05.
d Adult home vs facility, ns.
e Limited home care vs facility, P < .0001.
f Adult home vs facility, P < .001.
g Adult home vs facility, P < .01.
h Adult home vs facility, P < .0001.
i Adult home vs facility, P < .05.
Comparison of Mean DS Scores With MMSE Severity Groups in the ELN-AIP-901 Study AD Arm at Week 26 (n = 95), Week 52 (n = 139), and Week 78 (n = 128); DADE Study at Baseline (n = 170); and Predictors at Baseline (n = 405) and Month 18 (n = 223).a
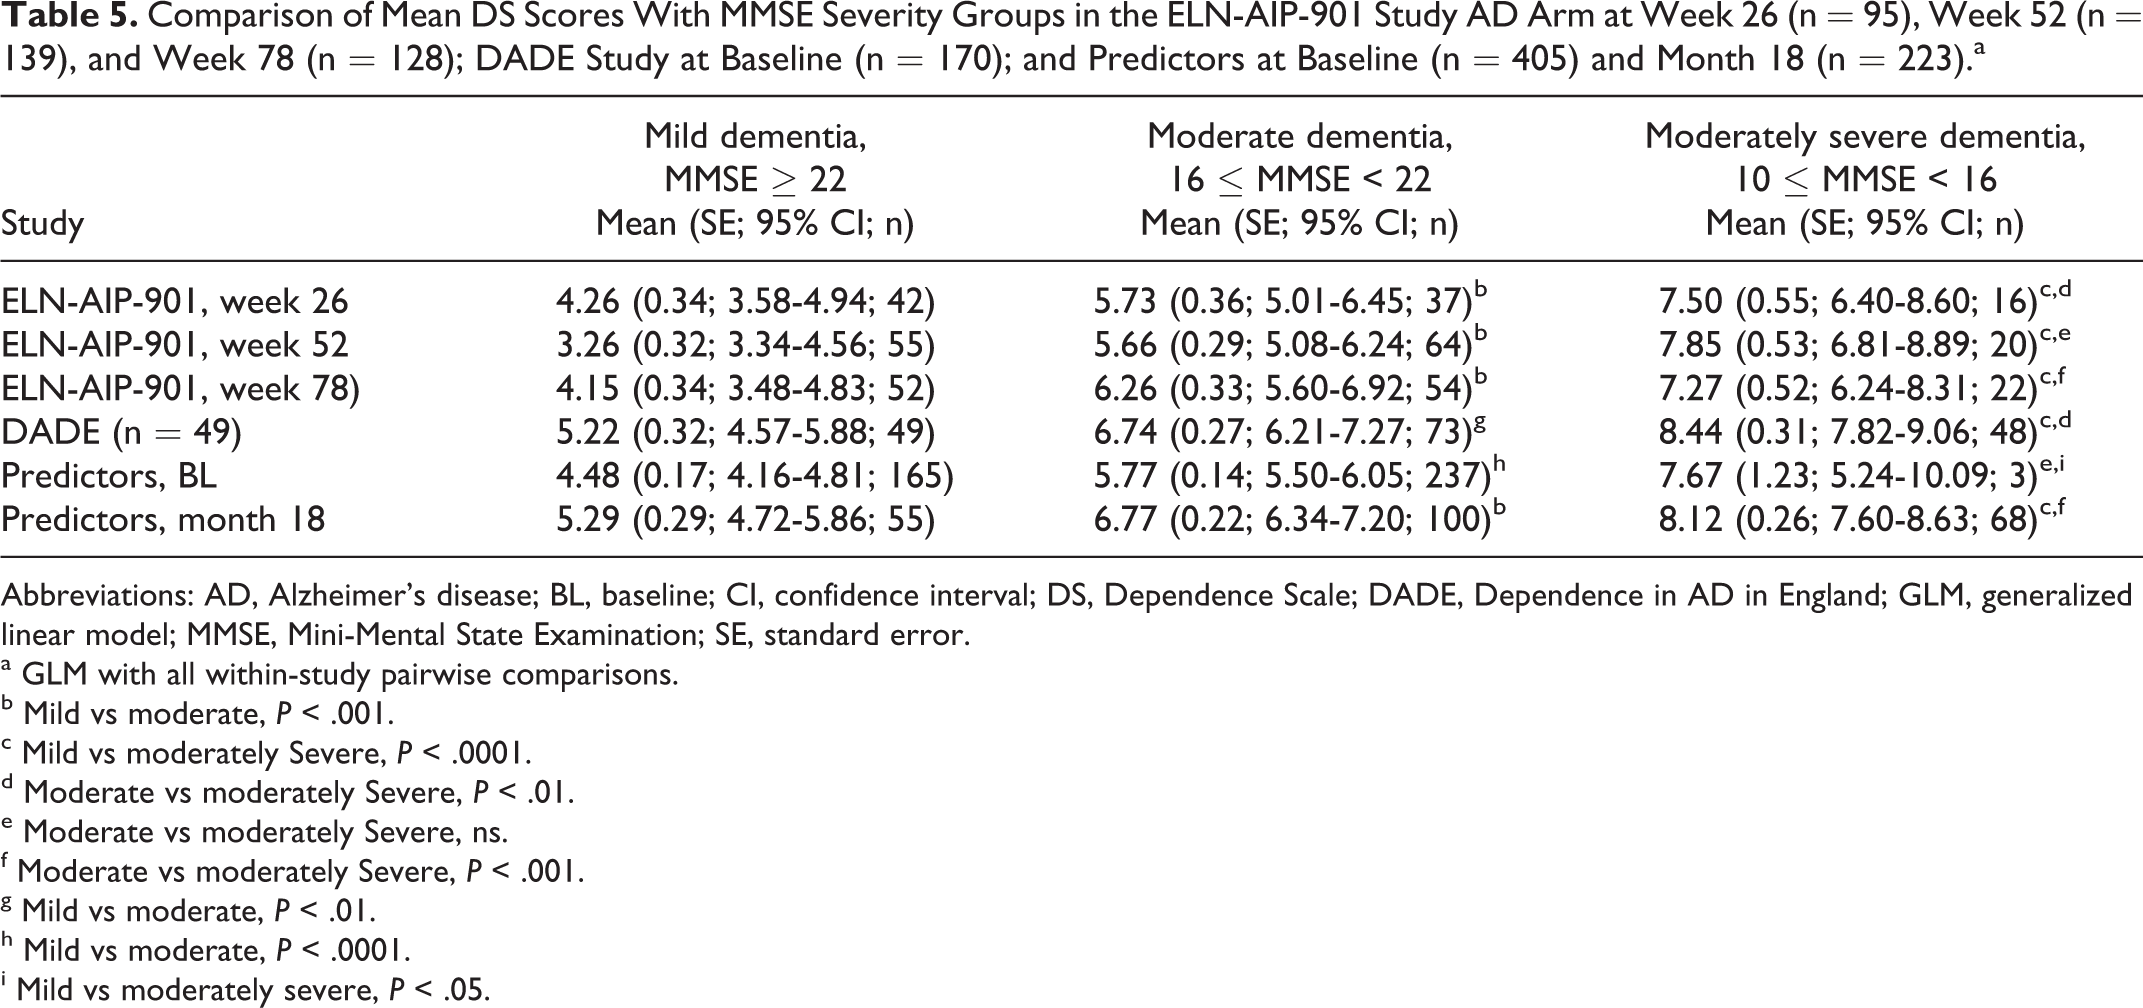
Abbreviations: AD, Alzheimer’s disease; BL, baseline; CI, confidence interval; DS, Dependence Scale; DADE, Dependence in AD in England; GLM, generalized linear model; MMSE, Mini-Mental State Examination; SE, standard error.
a GLM with all within-study pairwise comparisons.
b Mild vs moderate, P < .001.
c Mild vs moderately Severe, P < .0001.
d Moderate vs moderately Severe, P < .01.
e Moderate vs moderately Severe, ns.
f Moderate vs moderately Severe, P < .001.
g Mild vs moderate, P < .01.
h Mild vs moderate, P < .0001.
i Mild vs moderately severe, P < .05.
Mean Scores for the DS by Equivalent Institutional Care Status at Baseline and 18 Months Follow-Up, Restricted to Respondents at 18 Months in the Predictors Study.
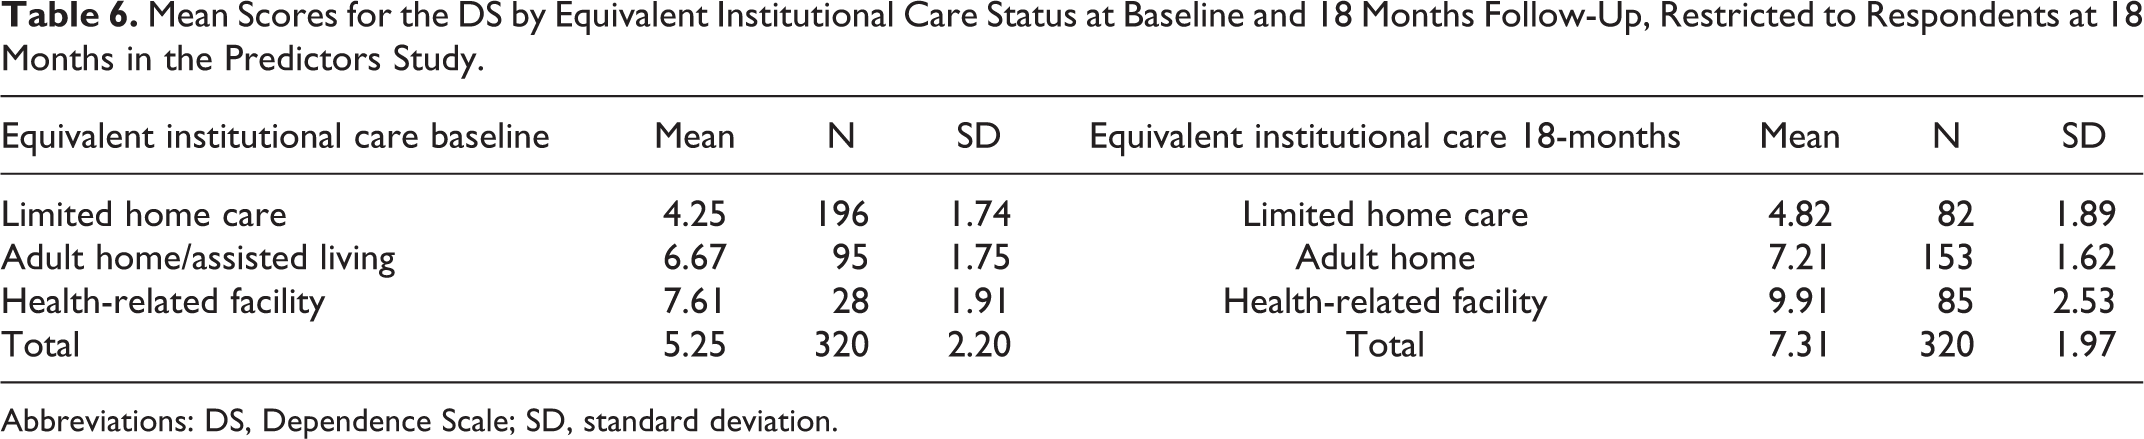
Abbreviations: DS, Dependence Scale; SD, standard deviation.
The first analysis of the theoretical model depicting relationships among cognition, behavior, functioning, and dependence is based on data from the Predictors study (Figure 1). The direct effect of behavior as measured by the CUSPAD on DS was not significant (standardized regression coefficient = .005); the total CUSPAD effect (.192) was essentially completely mediated through functioning as measured by the BDRS. The direct (−.183) and indirect (−.074) effects of cognition (as measured by the mMMS) on DS were both statistically significant, as was the total effect (−.257). The overall R 2 for the DS in this model is .398, which indicates that 39.8% of the variation in DS scores was explained by mMMS, CUSPAD, and BDRS scores.
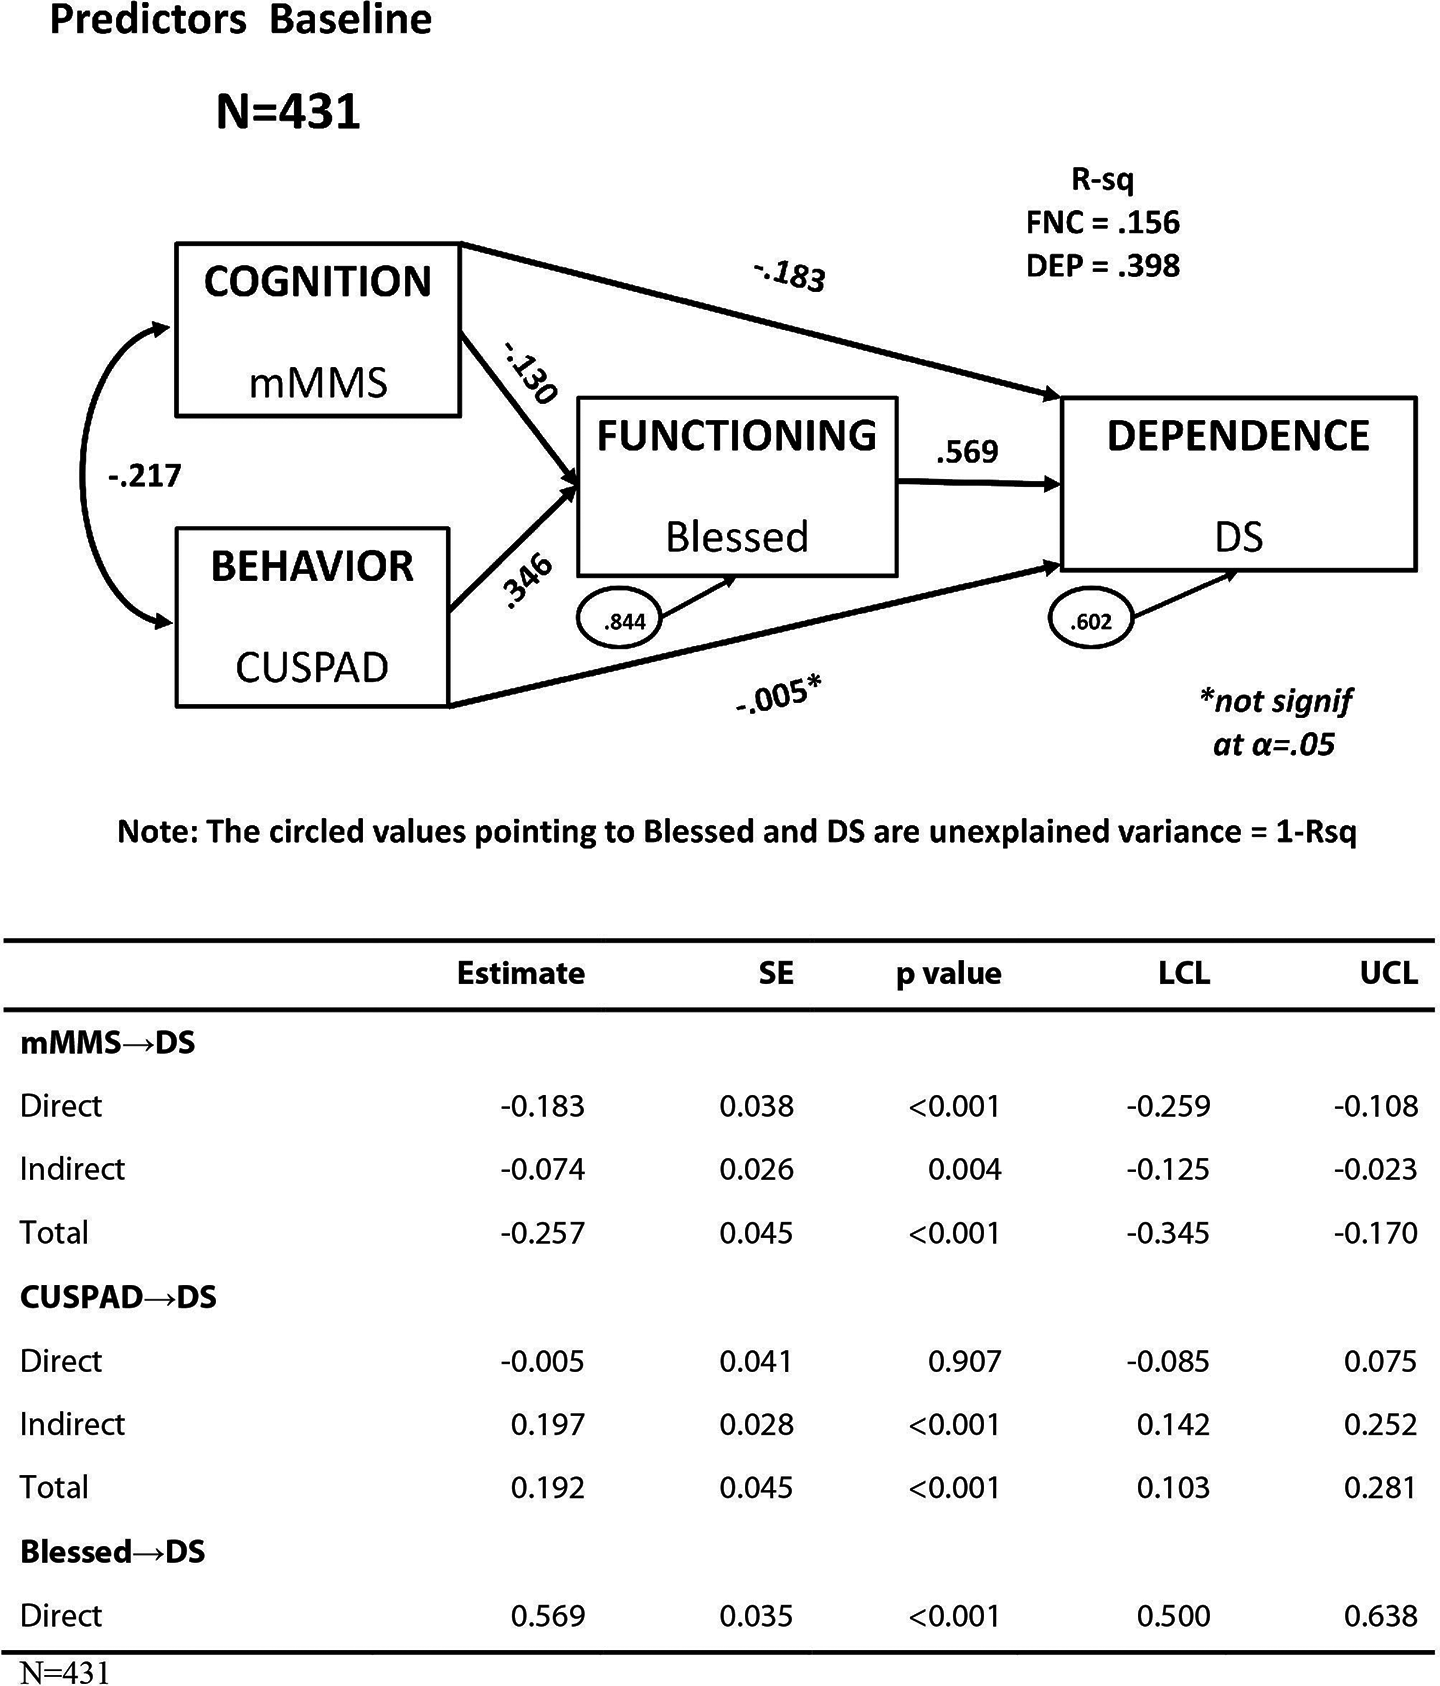
Fully saturated model of dependence in all participants in the Predictors study. The circled values pointing to Blessed and DS are unexplained variance = 1-R 2. Blessed indicates Blessed Dementia Rating Scale; DS, Dependence Scale.
Figure 2 presents the path model using data from the DADE study. This model, using MMSE to measure cognition, NPI to measure behavior, and the DAD to measure functioning (3 different measures than in the Predictors study shown in Figure 1), illustrated a set of relationships similar to the Predictors study model. There was no statistically significant direct effect of behavior on dependence. The standardized total NPI effect (.145) was primarily mediated through functioning (.119); both the direct effect of cognition on dependence (−.140) and the indirect effect (−.298) were statistically significant. Taken together, MMSE, NPI, and DAD scores explained 54.1% of the variance of the DS scores. The model in Figure 3 is based on the ELN-AIP-901 study and uses ADAS-Cog, DAD, and NPI as the measures of cognition, functioning, and behavior, respectively, along with the DS. In this model, behavior had a significant direct effect on dependence (path coefficient = .237), unlike the Predictors and DADE studies (path coefficients = −.005 and .026, respectively), with a marginally statistically significant mediated effect through functioning (indirect effect = .082 vs .197 and .119). The total behavior effect (.320) was primarily a direct effect, whereas the total behavior effect was primarily mediated through functioning for Predictors and DADE. The total effect of cognition on dependence (.497) was primarily mediated through functioning (.378), similar to the DADE model. As in the Predictors and DADE studies, the overall R 2 for dependence was substantial, explaining 63.6% of the DS score variance.
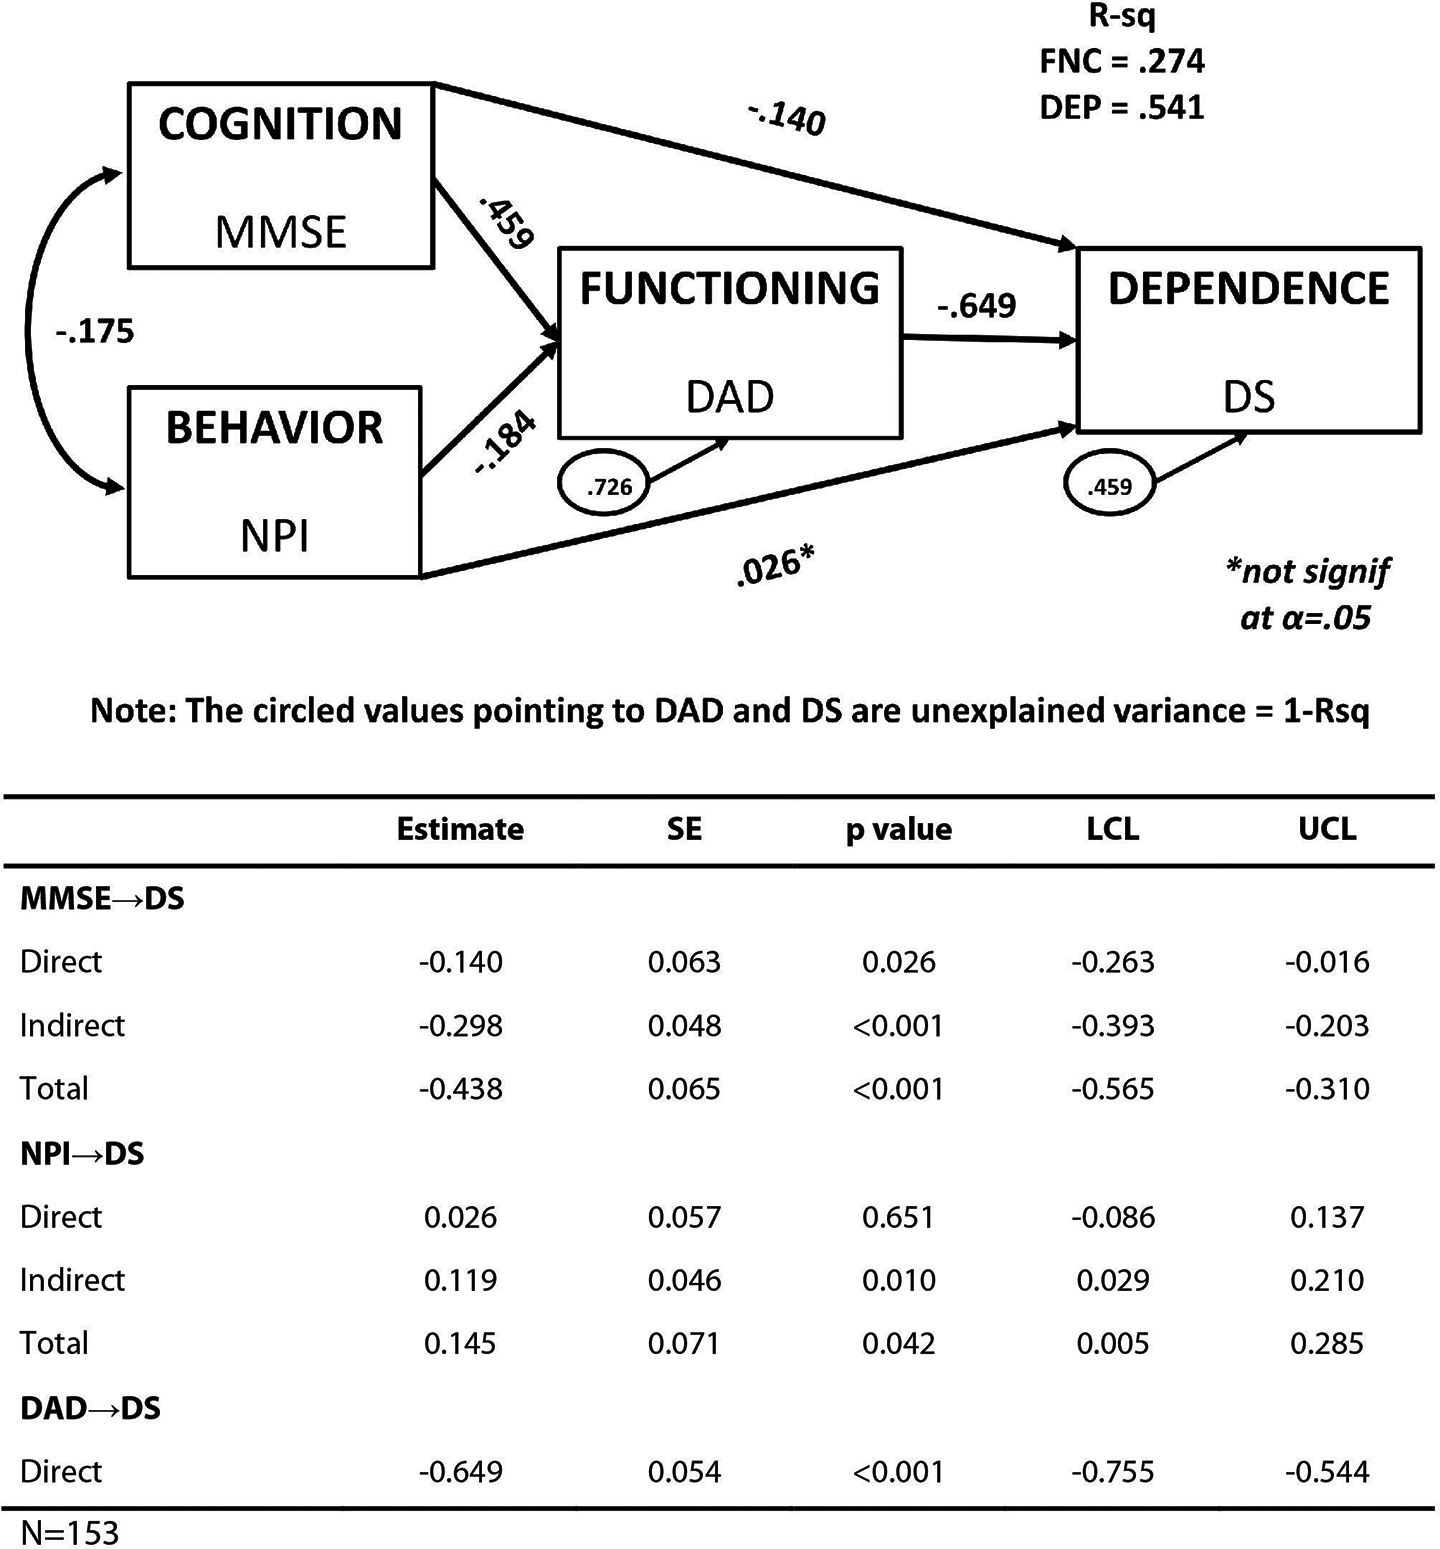
Theoretical model of cognition, behavior, functioning, and dependence: DADE study saturated model. The circled values pointing to DAD and DS are unexplained variance = 1 − R 2 . DAD indicates Dependence in Alzheimer’s disease; DADE, Dependence in Alzheimer's Disease in England; DS, Dependence Scale.
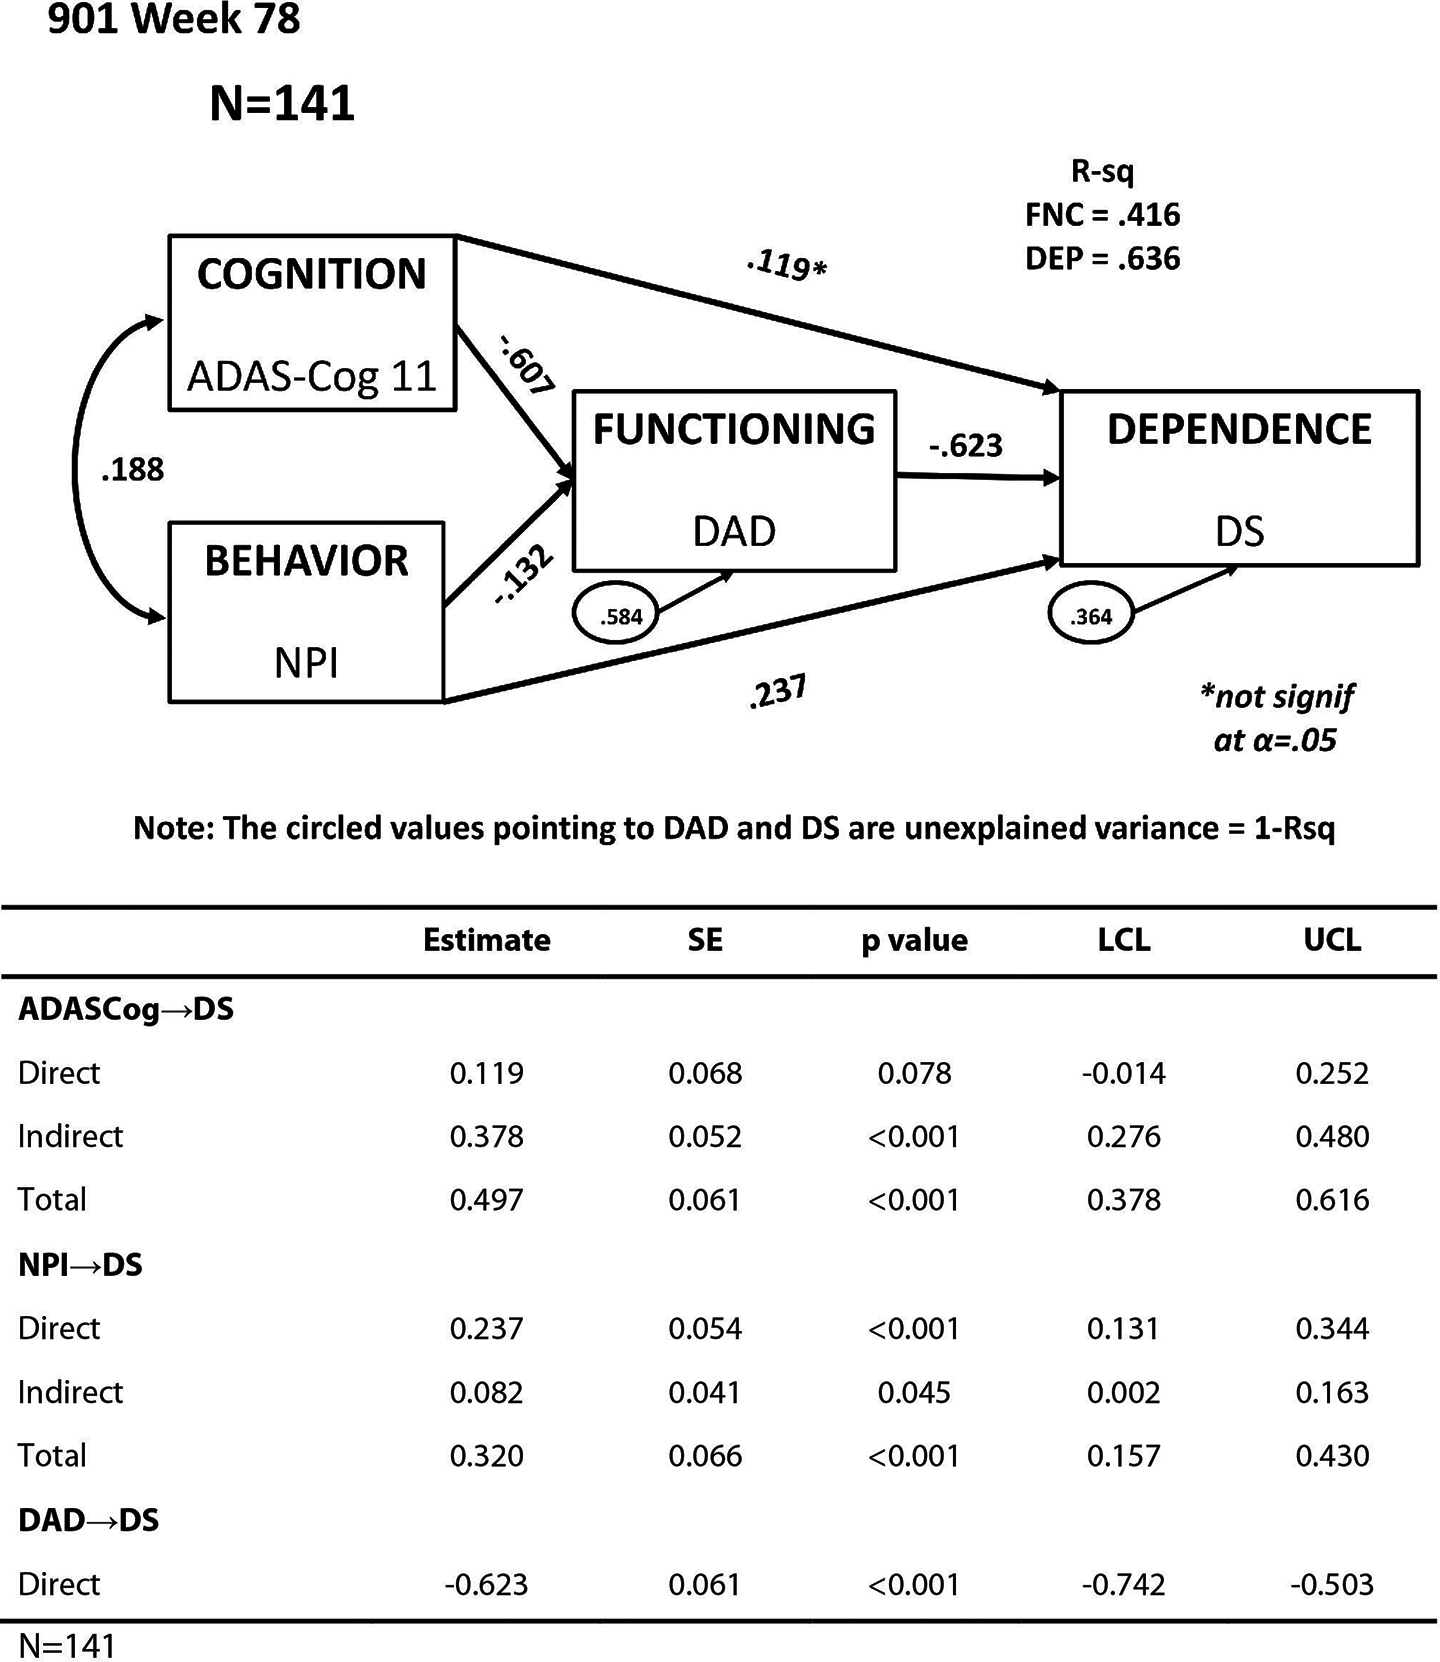
Theoretical model of cognition, behavior, functioning, and dependence: ELN-AIP-901 study saturated model, AD Arm, week 78. AD indicates Alzheimer’s disease.
To demonstrate the ability of the DS to detect change, the mean DS scores were calculated based on EIC change status for the Predictors study. As shown in Table 7, those who stayed in their own homes during the 18 months had a mean increase of 1.12 points in their DS scores. For patients who maintained their EIC status (adult home/assisted living to adult home/assisted living or institution to institution) over 18 months, the mean change scores were approximately 1 point at 18 months. For patients who moved to settings that required higher levels of care (home to adult home/assisted living, home to institution, or adult home/assisted living to health-related facility), the DS mean change scores were much larger, ranging from 2.31 to 5.8 point increases. The mean change score differences reported in Table 7 were statistically significant at the P < .001 level. In addition, pairwise comparisons between the 3 EIC change situations beginning with home placement and the 2 EIC changes representing stability or decline that begin with adult home/assisted living EIC status were also significant. The bottom 2 rows of Table 7 report the EIC change status and mean score changes for very few (n = 7) respondents with improved EIC status. The effect sizes included in the table indicate that a change of 1 point is comparable to an effect size of about 0.5, and the effect sizes associated with a 2-point change were much larger (1.5 and more)
In summary, a change of only about 1 point was indicative of the following successful outcomes: remaining in one’s own home with limited assistance or remaining in adult home status and not progressing to living in a health care facility in the Predictors study data. However, a change of 2 points or greater was associated with a clinically meaningful decline in the data set. Therefore, it was determined that a DS score increase in 1 point corresponds with stability in care setting over the 18-month time span and demonstrates an interpretable treatment benefit in AD.
Finally, the change score correlations between changes in the DS and changes in measures of cognition, function, and behavior were evaluated in the 901 study (Tables 8) and the Predictors Study (Table 9). These results indicated that in spite of strong correlations between functioning and dependence cross-sectionally, the change score correlations were generally only moderately correlated, providing further evidence that dependence and functioning as measured by the DS and DAD are different concepts.
Mean Change Scores in the DS by Change in Care Settings (EIC Status) Over 18 Months in the Predictors Study.a
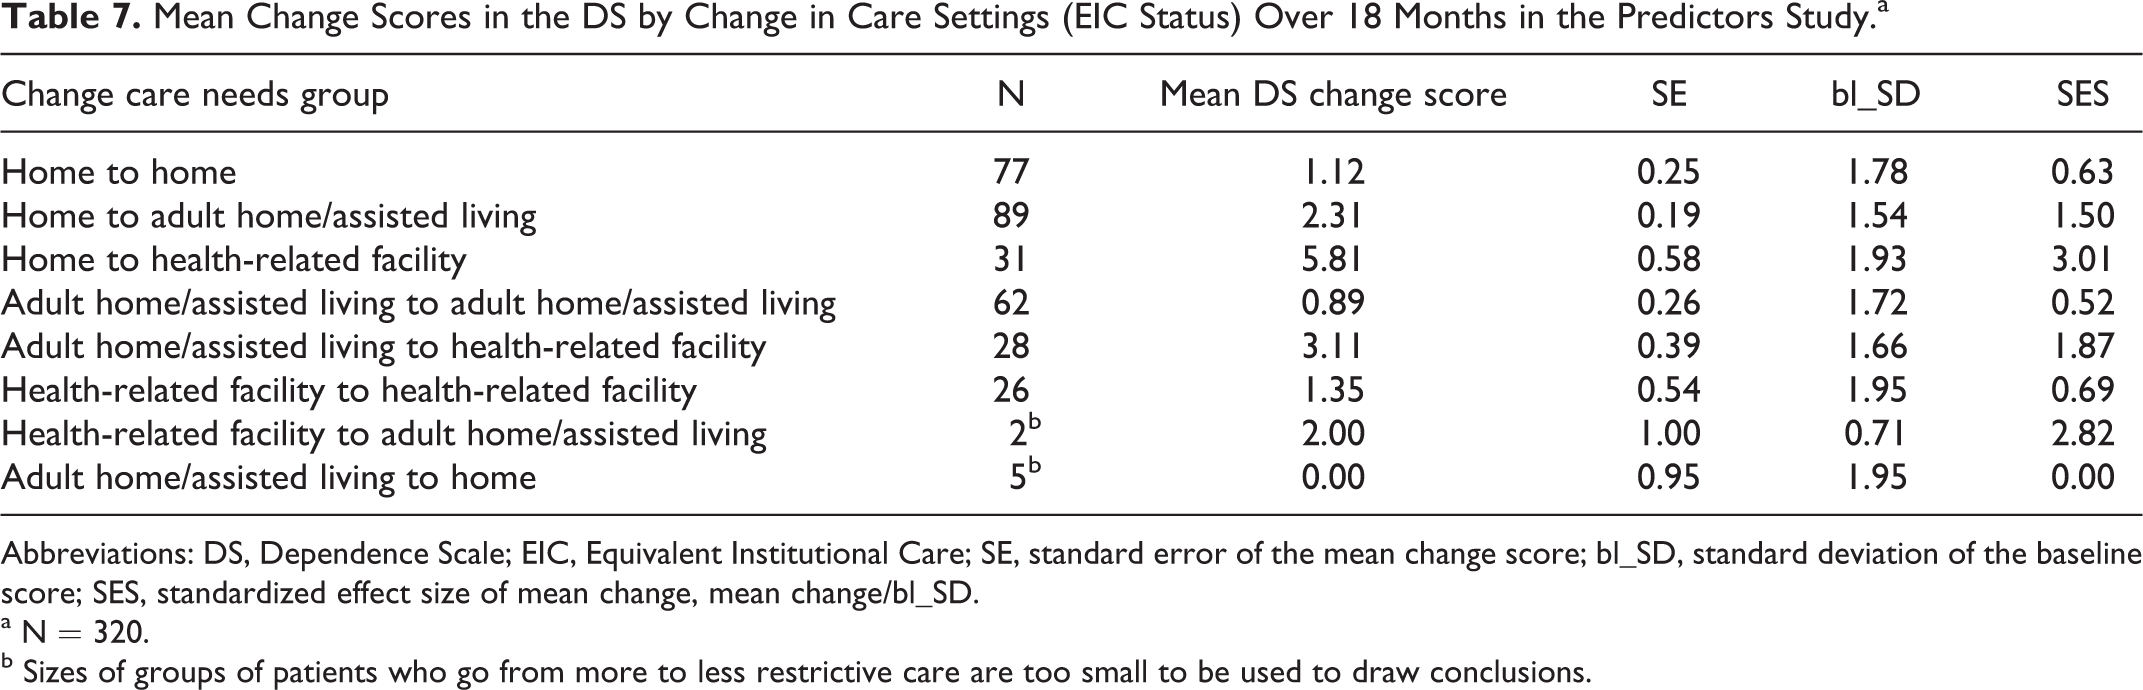
Abbreviations: DS, Dependence Scale; EIC, Equivalent Institutional Care; SE, standard error of the mean change score; bl_SD, standard deviation of the baseline score; SES, standardized effect size of mean change, mean change/bl_SD.
a N = 320.
b Sizes of groups of patients who go from more to less restrictive care are too small to be used to draw conclusions.
Pearson Correlations Between Change in DS and Other PRO Study Measures in the ELN-AIP-901 Study AD Arm From Week 26 to Week 78.a
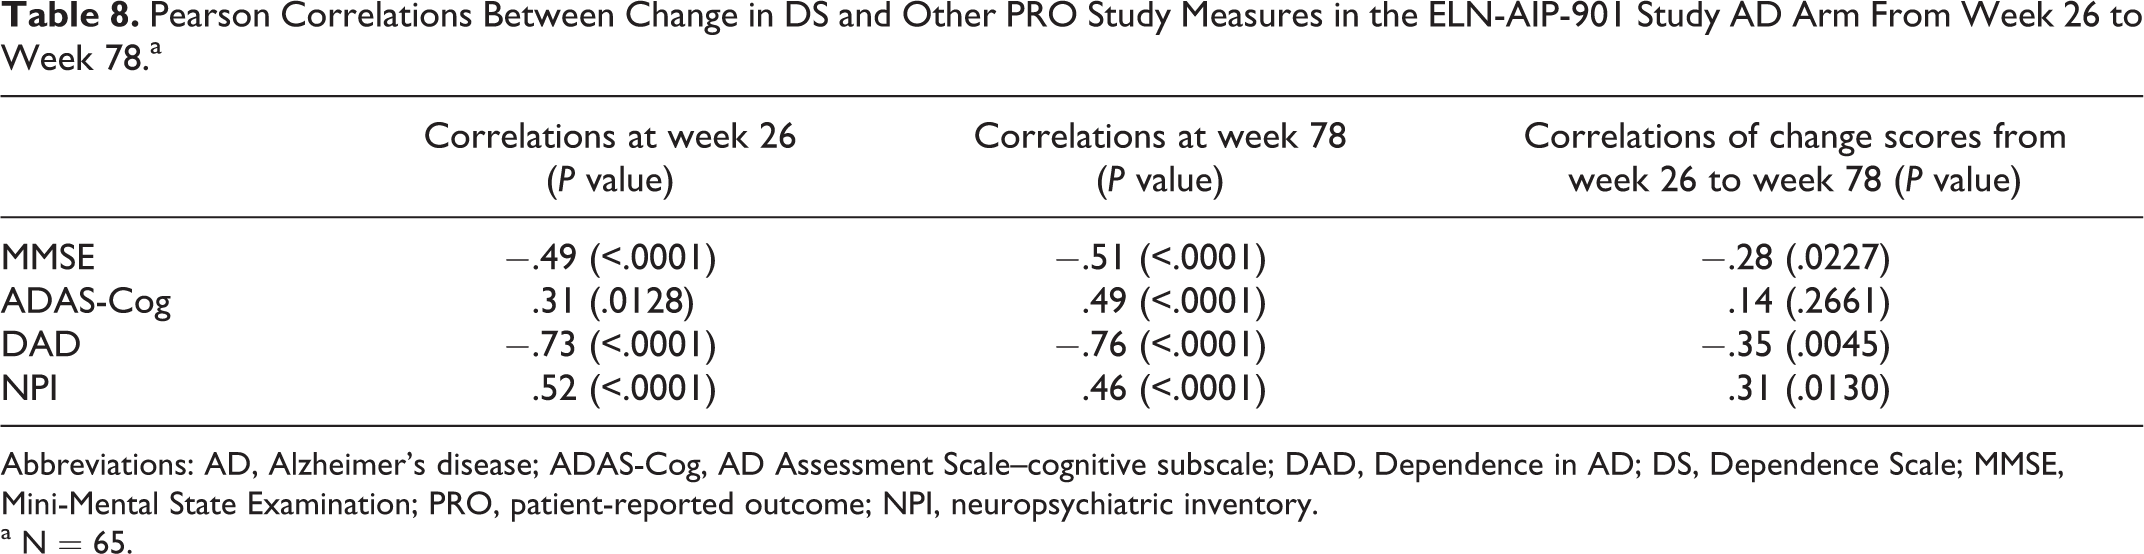
Abbreviations: AD, Alzheimer’s disease; ADAS-Cog, AD Assessment Scale–cognitive subscale; DAD, Dependence in AD; DS, Dependence Scale; MMSE, Mini-Mental State Examination; PRO, patient-reported outcome; NPI, neuropsychiatric inventory.
a N = 65.
Discussion
The analyses presented in this report provide substantial evidence supporting the reliability, validity, and interpretability of the DS. The DS is quickly completed by a caregiver and is readily understood. 33 Cronbach’s α, an index of internal consistency reliability, was above .70 in all 3 studies, a well-accepted threshold for establishing reliability. The pattern of convergent validity correlations shows a stronger relationship between the DS and measures of functioning, such as the DAD, particularly when compared with the correlation with the behavioral measure, the NPI. The correlations with the cognition measures were almost as strong as with the functioning measures.
The evaluation of differences in mean scores across study population subgroups (known-groups validity) provides further evidence for the validity of the DS. For example, DS scores were statistically significantly different in the Predictors study when comparing patients with an EIC status of “limited home care,” “adult home/assisted living,” and “health-related facility,” with scores increasing in severity across the subgroups. Similarly, when comparing across subgroups defined by MMSE status, that is, mild, moderate, moderate to severe, and severe, statistically significantly different mean scores were observed between each category, with mean scores indicating greater dependence corresponding with increasing cognitive impairment.
The path models further refine the understanding of the theoretical relationships among cognition, functioning, behavior, and dependence relative to the correlational analyses and allowed testing of not only direct but also indirect and mediating effects. First, the path coefficients of 3 models were very similar, and about 50% of the variance in dependence, as reflected by the r 2 statistics, was explained by cognition, functioning, and behavior across all 3 studies. Second, the total effect of behavior on dependence was weaker than the total effect of cognition on dependence in all models, with its direct effects on dependence very close to 0 and not statistically significant in 2 of the 3 studies. In the ELN-AIP-901 study, there was a significant effect of behavior on dependence that was not mediated through functioning. This difference in the direct effect of behavior on dependence could be an artifact of period and/or study cohort effects. This pattern of results, showing that dependence, cognition, and functioning are related but distinct concepts, supports the importance of the DS as an end point in AD clinical trials in adding unique information to the evaluation of a therapy. Indeed, the DS measures a concept, the need for caregiver assistance, which is distinct from functioning, as measured by the DAD. The statistically weaker effects of behavior in these models suggest that behavior is not as good a predictor of need for this assistance, as operationalized by the DS, as functioning and cognition are.
What constitutes an important change over time on the DS? First, it is essential to understand that prevention of further deterioration remains an important goal of treatment. As Table 7 indicates, for example, participants who remained home, who remained in adult homes, or who remained in health care facilities showed about a 1 point change. This was associated with an effect size of about 0.5, which is ordinarily a meaningful benchmark. However, over 18 months, those who deteriorated only 1 point on the DS remained at the same level in terms of EIC, leading to the conclusion that a deterioration of only 1 point is still a positive outcome. However, those patients who showed a difference of 2 points or more were likely to show deterioration in their EIC status. For example, in the Predictors study, the transition from home to assisted living was associated with a 2.3-point mean change and the transition from home to health care facility was associated with a mean change of 5.8 points on the DS.
The use of different measures of cognition, functioning, and behavior across the 3 studies (eg, the CUSPAD in the Predictors study and the NPI in DADE and 901 studies) might be seen as a potential limitation. However, the similarity of findings in spite of the heterogeneity of measures suggests robustness in the relationships observed. These analyses add to a growing body of literature supporting the validity of the DS. The DS has been shown in another recent study to be moderately to strongly correlated with the CDR-SB, 34 the Zarit caregiver burden scale, the DAD, and the Resource Utilization in Dementia (RUD-lite). 35 Additional work has evaluated the relationship of the DS to important economic outcomes, including risk of hospitalization, increased risk of nursing home admission, and increased risk of use of antipsychotics, 10 and it has been used in economic modeling. 22 Further support for the link between the DS and caregiver burden has been provided by the work of Lacey and colleagues 9 in an analysis of the 901 data. That study concluded that as care recipient dependence increased, caregivers reported increase in daily schedule disruption, greater lack of family support, and increased time as a caregiver. Lacey 36 analyzed the association between DS and caregiver measures of subjective burden and health status/utility and observed that caregiver burden increased as dependence on the caregiver increased. The analyses controlled for patient and caregiver age, patient gender, patient stage of cognitive impairment and number of ADLs limitations, behavioral problems, and country. Finally, Lacey and colleagues 37 studied the relationship between dependence with clinical measures of cognition, function, and behavior changes over time and concluded that the relationships between dependence and other clinical measures of cognition, functioning, and behavior can be observed over time.
In summary, this article provides convincing empirical evidence of the reliability, validity, and responsiveness to change in the DS across 3 independently conducted studies. The DS has been shown to be reliable and consistently correlated with cognition, functioning, and behavior, important variables for defining, evaluating, and understanding the effects of AD on patients and their families. Moreover, through structural equation modeling, it was shown that dependence is a concept that is related to cognition, function, and behavior but also distinct from these domains. Approximately 50% of the variance in dependence was predicted by the 3 measures, and the effect of cognition on dependence was not fully mediated by functioning, suggesting they are different concepts. Analyses of changes in the DS suggest that a 1-point change over time is associated with a positive outcome, whereas a change of 2 or more points represents a clinically meaningful deterioration in Predictors study data. The results presented in this article should increase the confidence of researchers and regulators in using and interpreting the DS as an end point in clinical trials for mild to moderate AD.
Pearson Correlations Between Change in DS and Other PRO Study Measures in the Predictors Study From Baseline to Month 18.a
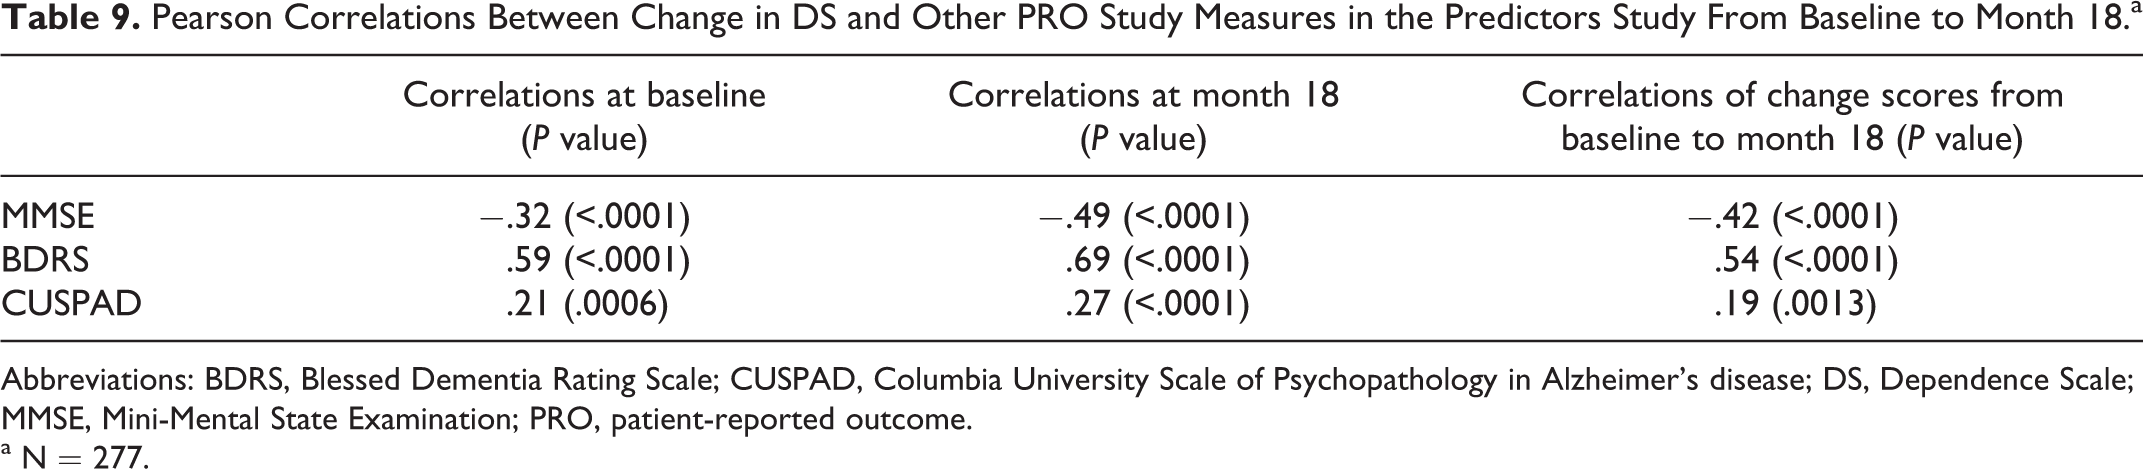
Abbreviations: BDRS, Blessed Dementia Rating Scale; CUSPAD, Columbia University Scale of Psychopathology in Alzheimer’s disease; DS, Dependence Scale; MMSE, Mini-Mental State Examination; PRO, patient-reported outcome.
a N = 277.
Footnotes
Acknowledgments
We are grateful to Tim Niecko, PhD, and Wen-Hung Chen, PhD, for statistical support. This study was sponsored by Janssen Alzheimer Immunotherapy Research & Development, LLC, and Pfizer Inc.
Declaration of Conflicting Interests
The authors declared the following potential conflicts of interest with respect to the research, authorship, and/or publication of this article: William Lenderking and Kathy Wyrwich are full-time employees of Evidera, formerly United BioSource Corporation, which was the paid consulting organization to Pfizer Inc and Janssen Alzheimer Immunotherapy Research & Development, LLC in connection with the development of this article. Marilyn Stolar and Kellee Howard were employees of United BioSource Corporation at the time this work was completed. Marilyn Stolar is currently at Yale Center for Analytical Sciences, Yale School of Public Health. Christopher Leibman is a full-time employee of Janssen Alzheimer Immunotherapy Research & Development, LLC. Loretto Lacey was a full-time employee of Janssen Alzheimer Immunotherapy Research & Development, LLC at the time the research was done. in the development of this article. Zoe Kopp was an employee of Pfizer Inc at the time this work was completed. Dr Stern’s work on the Predictors study is supported by NIA R01-AG07370.
Funding
The authors disclosed receipt of the following financial support for the research, authorship, and/or publication of this article: The project described in this article was sponsored by Pfizer Inc and Janssen Alzheimer Immunotherapy Research and Development, LLC.