
Abstract
The identification of blood biomarkers for Alzheimer’s disease (AD) could contribute for improvement in early diagnosis. To define AD biomarkers, we compared serum/plasma levels of amyloid β (Aβ), tau, cytokines, and biometals between AD and non-AD groups. Cognitive impairment was assessed by Mini-Mental Status Examination (MMSE) and Clinical Dementia Rating scales. Plasma concentrations of total Aβ, Aβ42, tumor necrosis factor α (TNF-α), and interleukin 6 were quantified by immunoassays. Serum biometal concentrations were determined using flame atomic absorption spectrometry. We found that serum zinc (Zn) was lower in patients with AD. After controlling for age, the MMSE score correlated with both TNF-α and total Aβ levels in the AD group, while the MMSE score correlated with iron only in the non-AD group. Our finding that blood Zn, TNF-α, and total Aβ are possible biomarkers for AD diagnosis and prognosis validates the pervious publication on potential biomarker in the Taiwanese population.
Introduction
Alzheimer’s Disease and Biomarkers
Alzheimer’s disease (AD) is a common and devastating disorder in later life. The worldwide prevalence of AD was 26.6 million in 2006 and is anticipated to quadruple over the next 40 years owing to longer life expectancy. 1 The diagnosis of AD is largely based on exclusion of other neurodegenerative diseases, and definitive diagnosis still requires pathological evaluation at autopsy. Early diagnosis with biomarkers may prevent the disease progression and benefit the development of effective treatments. With the emergence of several potential biomarkers for AD, the traditional diagnostic criteria for AD have been modified. Dubois et al proposed that in addition to the core clinical symptom of early and significant episodic memory impairment, there must be 1 or more abnormal biomarkers among structural neuroimaging by magnetic resonance imaging, molecular neuroimaging by positron emission tomography (PET), or cerebrospinal fluid (CSF) analysis of amyloid β (Aβ) or tau proteins. 2 The combination of clinical and biological approaches makes it possible to diagnose AD before the dementia stage. 3 Changes in these biomarkers could be indicative of disease progression and treatment response. Furthermore, novel biomarkers may provide new insights into the pathogenesis of AD. Candidate biomarkers derived from neuroimaging or measured in CSF have been reported, 4 but the expense and invasive nature of these procedures limited their wide application in clinical practice.
Advantages of Identifying Plasma Biomarkers
Peripheral blood samples are easy to obtain from large populations. Blood sampling is less invasive than lumbar puncture for CSF and far less costly than neuroimaging. In addition, serial blood testing would allow more accurate monitoring of disease progression or treatment outcome. Unfortunately, the sensitivity, specificity, and validity of the known markers are still insufficient to clearly distinguish AD for age-related mild cognitive impairment (MCI). Furthermore, it is not yet clear to what extent peripheral blood levels reflect pathogenic processes in the CNS.
Amyloid β
The hallmark pathological changes in brain of patients with AD are the presence of senile plaques and neurofibrillary tangles. Amyloid β 42 (Aβ42) isoform is the dominant component of AD plaques. The correlations between specific plasma Aβ species and neuropsychological impairments have been widely investigated. However, there has been little consensus on the relationship between plasma Aβ and disease state, due to different assay methods, patio, or patient selection criteria 5 as well as its complex interactions with reactive circulating proteins. 6 A longitudinal study showed that lower plasma levels of Aβ40 and Aβ42 were significantly correlated with faster cognitive decline. 7 Similarly, lower Aβ42 concentrations and Aβ42/Aβ40 ratios were observed in patients with AD and were inversely correlated with brain Aβ load as measured by Pittsburgh compound B PET. 8 However, majority of cross-sectional studies found no differences in plasma Aβ levels between patients with AD and healthy controls. 9 Given these inconsistencies, the value of serum Aβ species for the prognosis and monitoring of treatment responses requires further study.
Inflammatory markers
Chronic inflammatory process has been implicated in the neuropathology of AD. Neural insults trigger the production of both inflammatory and immunomodulatory cytokines that have deleterious and reparative effects on the brain. 10 Interleukins (IL-) 1, 4, 6, 10, 12, 16, and 18, tumor necrosis factor α (TNF-α), and several chemokines have been suggested as biomarkers for AD. A meta-analysis revealed higher peripheral concentrations of IL-6, TNF-α, IL-1β, transforming growth factor beta, IL-12, and IL-18 in AD. 11 Nonetheless, the experimental relationship between severity of AD and circulating cytokine levels has been inconsistent and requires more studies.
Biologically functional metals (biometals)
The disturbance of metal ion homeostasis has been implicated in the pathogenesis of several neurodegenerative disorders, including AD. Indeed, Aβ aggregation and toxicity could be triggered by the abnormal interactions with metal ions. Zinc (Zn), copper (Cu), and ferrous iron (Fe) were found at high levels in the cerebral Aβ plaques. 12 ,13 Currently, there is still no consensus on changes in serum biometal concentrations in patients with AD. 14,15
Role of Apolipoprotein E Genotype in the Chinese Population
Carriers of the ∊4 allele of apolipoprotein E (ApoE4) are at an increased risk of AD in both the Caucasian and the ethnic Chinese populations. 16 Although the prevalence rate of ∊4 in the Chinese population (8.1%) is lower than that in most of the Western populations, the association between the ApoE genotype and the serum cholesterol level is similar. 17 The ApoE genotype may influence serum biochemistry in both AD and nonclinical elderly populations.
Objective of This Study
One limitation of previous studies on biomarkers has been the lack of adjustment for ethnicity. It is not known whether the candidate biomarkers identified in the Western countries are relevant to other ethnic groups in Asia. Therefore, we examined potential serum biomarkers for AD diagnosis and disease severity in a Taiwanese population in this study.
We compared serum/plasma levels of Aβ, cytokines, and biometals between patients with AD and non-AD control to assess the utility of these serum constituents as AD biomarkers. Furthermore, we examined the association between disease severity, the degree of cognitive impairment, and the serum levels of these biomarkers in the Taiwanese population.
Materials and Methods
Participants
From 2009 to 2012, 28 patients with AD, 13 elderly individuals with MCI, and 6 healthy elderly participants were recruited from the geriatric wards and clinics of 3 different hospitals in southern Taiwan (Kai-Shuan Mental Hospital, Chang-Gung Memorial Hospital, and Chiayi branch, Taichung Veterans General Hospital). Informed consent was obtained from the participants and/or their primary caregivers. Ethical approval was obtained from the institutional review board of Kai-Shuan Mental Hospital (KSPH-2009-50) and Chang-Gung Memorial Hospital (100-0568C).
Diagnostic Criteria
All patients underwent a standardized investigative battery, including medical history, physical and neurological examinations, laboratory tests, and brain x-ray computed tomography (CT). Diagnosis of AD was made by psychiatrists according to the Diagnostic and Statistical Manual of Mental Disorders (Fourth Edition, Text Revision [DSM-IV-TR]) criteria. The MCI was defined using the Petersen rating criteria 18 (1) complaints of defective memory, (2) normal activities of daily living, (3) normal general cognitive function, (4) abnormal memory function for age, and (5) absence of dementia.
The inclusion criteria for patients were as follows: (1) older than 60 years, (2) diagnosed with AD by DSM-IV criteria, (3) no significant cerebrovascular disease as revealed by brain CT or a Modified Ischemic Score <4, (4) no significant abnormalities on routine laboratory tests that may interfere with the study, and (5) adequate visual and auditory acuity to allow for neuropsychological testing. For all participants, the exclusion criteria were (1) a past history of brain damage, (2) a significant history of substance abuse, (3) a history of major psychiatric illness, (4) short form Geriatric Depression Scale scores <5, (5) a major neurological disorder such as Parkinson’s disease, and (6) evidence of clinically relevant and uncontrolled hypertensive, cardiopulmonary, metabolic, or hematological conditions.
Neuropsychological AssessmentsGeneral cognitive functions were assessed by psychologists using the 11 item Mini-Mental State Examination (MMSE). 19 Dementia severity was assessed by psychiatrists using the Clinical Dementia Rating (CDR) scale. 20 A CDR score of 0 indicates normal cognitive capacity, whereas a CDR of 1, 2, or 3 indicates mild, moderate, or severe dementia, respectively. The CDR and Petersen criteria were used to differentiate the 6 cognitively normal participants from the 13 patients with MCI. Participants with memory complaints but who were not demented (CDR = 0.5) and those with normal cognitive function (CDR = 0) were grouped together and defined as the non-AD group. Depressive symptoms were assessed with a Chinese version of the 15-question Geriatric Depression Scale, short form.
Blood Sample Preparation
A 30 mL blood sample was drawn by venipuncture from patients in the morning after an overnight fast and aliquoted into 3 Venoject tubes (Glass Tubes BD Vacutainer [BD Vacutainer® Plus Plastic K2 EDTA Tubes 367525#, BD Vacutainer® Plus Plastic Serum Tubes 367820#]). Within an hour of blood sampling, 10 mL of whole blood sample was treated with heparin and protease inhibitors to obtain plasma (Roche, Germany), and the plasma together with the remaining two 10 mL serum samples were centrifuged at 3000 rpm for 10 minutes at 4°C. The supernatants were aliquoted in polypropylene tubes and stored at −80°C until analysis.
Enzyme-linked immunosorbant assays
Plasma samples were analyzed for total Aβ, Aβ42, IL-6, and TNF-α by specific commercial plate-based enzyme-linked immunosorbant assays (ELISAs): (1) Human Aβ (1×, 1-42) Assay Kit (IBL, Minnesota), (2) Human TNF-α Quantikine Kit (R&D Systems, Minnesota), and (3) Human IL-6 Quantikine Kit (R&D Systems). For all plasma protein measures, plasma samples were kept on ice during ELISA preparation and samples were subjected to only 1 freeze–thaw cycle. Assays were performed according to the respective manufacturer’s instructions. For samples measured twice using separate aliquots, the mean was used in the statistical analyses.
Serum Zn, Cu, and Fe determination
Flame atomic absorption spectrometry (FAAS, Perkin Elmer 5100PC, Waltham, MA, USA) was used for the measurement of serum Zn, Cu, and Fe. All serum samples were diluted 1:1 with 0.2% nitric acid (HNO3) and then aspirated into the FAAS. The signals were compared to a calibration curve constructed from aqueous standard solutions (Merck, Germany). Quality control was assured using standard reference materials (Seronorm Trace Elements Serum; Nycomed AS, Zurich, Switzerland). For Zn, Cu, and Fe, the detection limits were 0.006, 0.006, and 0.057 mg/L, respectively.
Apolipoprotein E genotyping
Genomic DNA was extracted from cheek swabs using Qiagen DNA Blood kits (#51162; Qiagen Inc, California). Two single nucleotide polymorphisms distinguishing the ApoE ∊2, ∊3, and ∊4 alleles were detected using specific primers and probes designed by Applied Biosystems Inc California. Assays were performed according to the manufacturer’s instructions. The primers distinguish the ∊2 allele from the ∊3 and ∊4 alleles at amino acid position 158 (NCBI rs7412) and the ∊4 allele from the ∊2 and ∊3 alleles at amino acid position 112 (NCBI rs429358). TaqMan real-time polymerase chain reaction (RT-PCR) assays were performed in an ABI 7900 HT RT-PCR system using a cycling program of 95°C for 10 minutes, 40 cycles of 95°C for 15 seconds, and 60°C for 1 minutes. One negative control (water) was included in each plate.
Statistical Analyses
All statistical analyses were performed using the SPSS v12.0 software package (SPSS Inc, Illinois). The Kolmogorov-Smirnov test was used to determine the normality of each data set distribution. Chi-squared tests were employed to compare demographic characteristics and other categorical variables between patients with AD and patients without AD. Nonpaired t tests and Mann-Whitney tests were performed to compare mean biomarker values from normally distributed and nonnormally distributed data sets, respectively. Correlations between plasma/serum levels of the 7 candidate biomarkers and the MMSE scores were assessed using Pearson correlation analysis or Spearman rank correlation analysis depending on the biomarker concentration distribution (parametric or nonparametric). Partial correlation adjusting for age was also employed to examine the correlations between candidate biomarkers and MMSE scores in AD and non-AD groups. All test results are presented as 2-tailed P values and P <.05 was considered statistically significant.
Results
Demographic Characteristics and Clinical Data of Participants
A total of 47 participants, 38 males and 9 females, were recruited for this study, including 28 confirmed patients with AD, 13 patients with MCI meeting the Petersen criteria, and 6 cognitively normal elderly volunteers. The normal elderly individuals and the patients with MCI comprised the non-AD group for purposes of analysis. The mean age of all participants was 81 ± 7.2 years and the mean MMSE score was 18.4 ± 5.8. The demographic characteristics and ApoE genotypes are presented in Table 1. The frequencies of the ApoE alleles across all participants were 1.1% for ∊4, 84% for ∊3, and 14.8% for ∊2. To examine candidate biomarkers in AD and non-AD groups, we divided participants by dementia severity according to CDR score. Mean age and gender ratio were not significantly different between the AD and non-AD groups (χ 2 = 1.058, P = .4, χ 2 = 1.461, P = .15). In both the groups, the ApoE allele frequencies followed the rank order ∊3 > ∊2 > ∊4. In the non-AD group, the ApoE allele frequencies were 89.4% for ∊3 and 10.5% for ∊2. In the AD group, the ApoE allele frequencies were 80.3% for ∊3 and 17.8% for ∊2.
Demographic Characteristics and Clinical Data in Study Participants. a
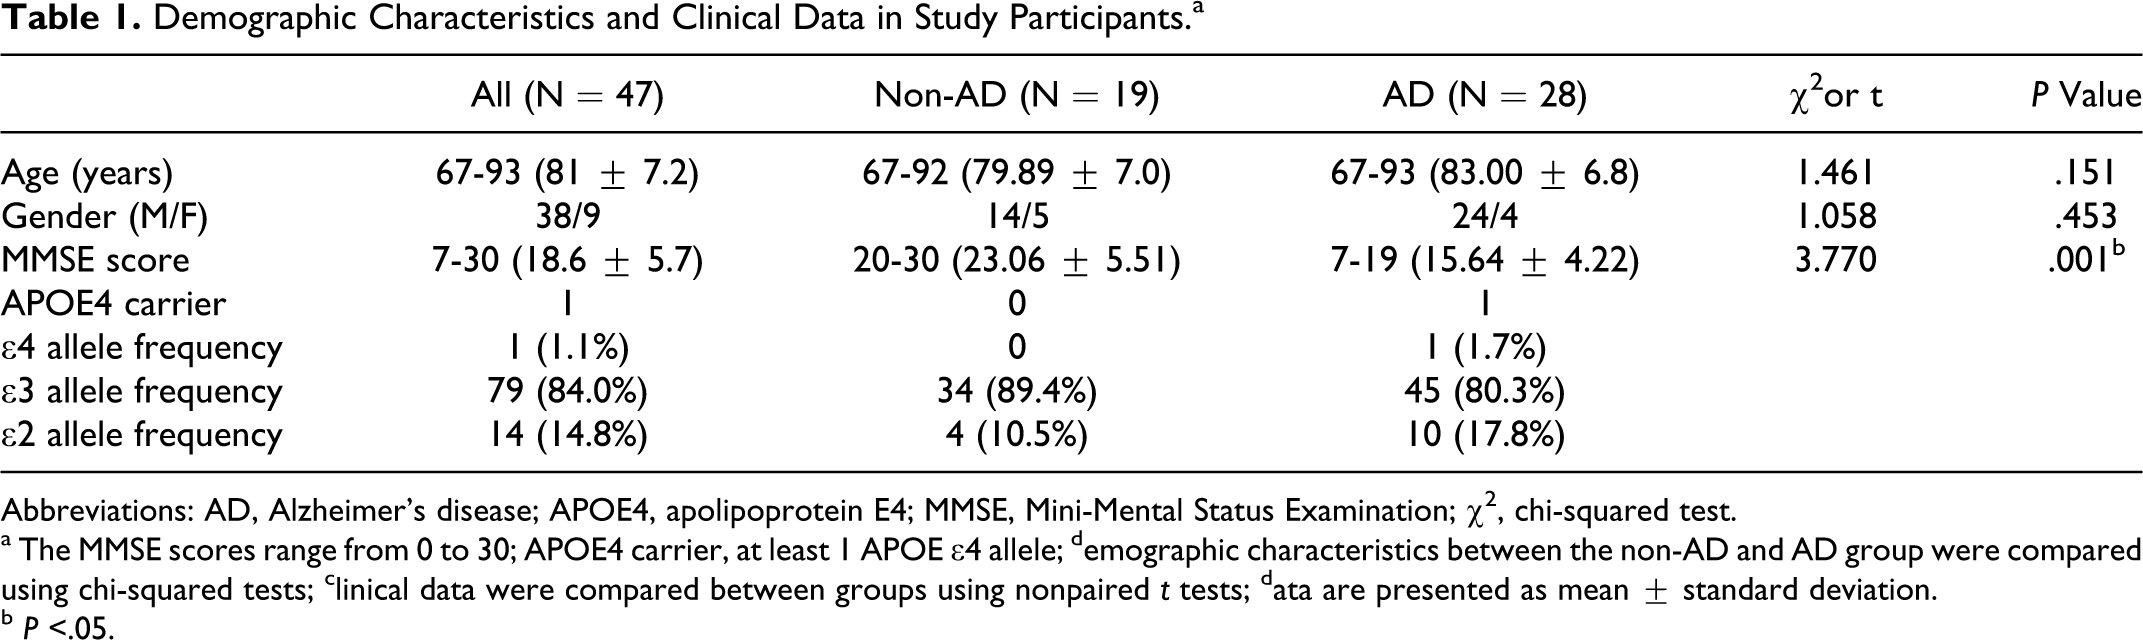
Abbreviations: AD, Alzheimer’s disease; APOE4, apolipoprotein E4; MMSE, Mini-Mental Status Examination; χ2, chi-squared test.
a The MMSE scores range from 0 to 30; APOE4 carrier, at least 1 APOE ∊4 allele; demographic characteristics between the non-AD and AD group were compared using chi-squared tests; clinical data were compared between groups using nonpaired t tests; data are presented as mean ± standard deviation.
b P <.05.
Plasma and Serum Biomarker Concentrations in Patients With AD and Non-AD Participants
To define potential serum or plasma biomarkers for AD, we compared plasma levels of cytokines and pathogenic proteins, and serum levels of biometals between patients with and AD and non-AD participants (Table 2). For the total study population, the mean (± standard deviation [SD]) serum biometal concentrations were Zn: 0.65 ± 0.12, Fe: 1.09 ± 0.32, and Cu 1.02 ± 0.21 (all in mg/L). For the total study population, the mean (±SD) plasma concentrations of the 4 measured proteins were total Aβ: 323.6 ± 64, Aβ42: 12.5 ± 16.8, TNF-α: 2.352 ± 1.33, and IL-6: 2.91 ± 1.99 (all in pg/mL). Plasma concentration of Aβ42 was undetectable in 13 participants and plasma levels of TNF-α were undetectable in 4 participants. Pearson correlation analysis revealed that the mean serum Zn concentration in the AD group was significantly lower than that in the non-AD group (Figure 1, 0.62 ± 0.9 vs 0.69 ± 0.1 mg/L; t = 2.086, P = .043), while serum Fe and Cu concentrations were not significantly different between the groups. Plasma concentration of Aβ42 was higher but total Aβ was lower in patients with AD compared to patients without AD, but these differences did not reach statistical significance.
Comparison of Candidate Biomarkers between AD and Non-AD Participants.
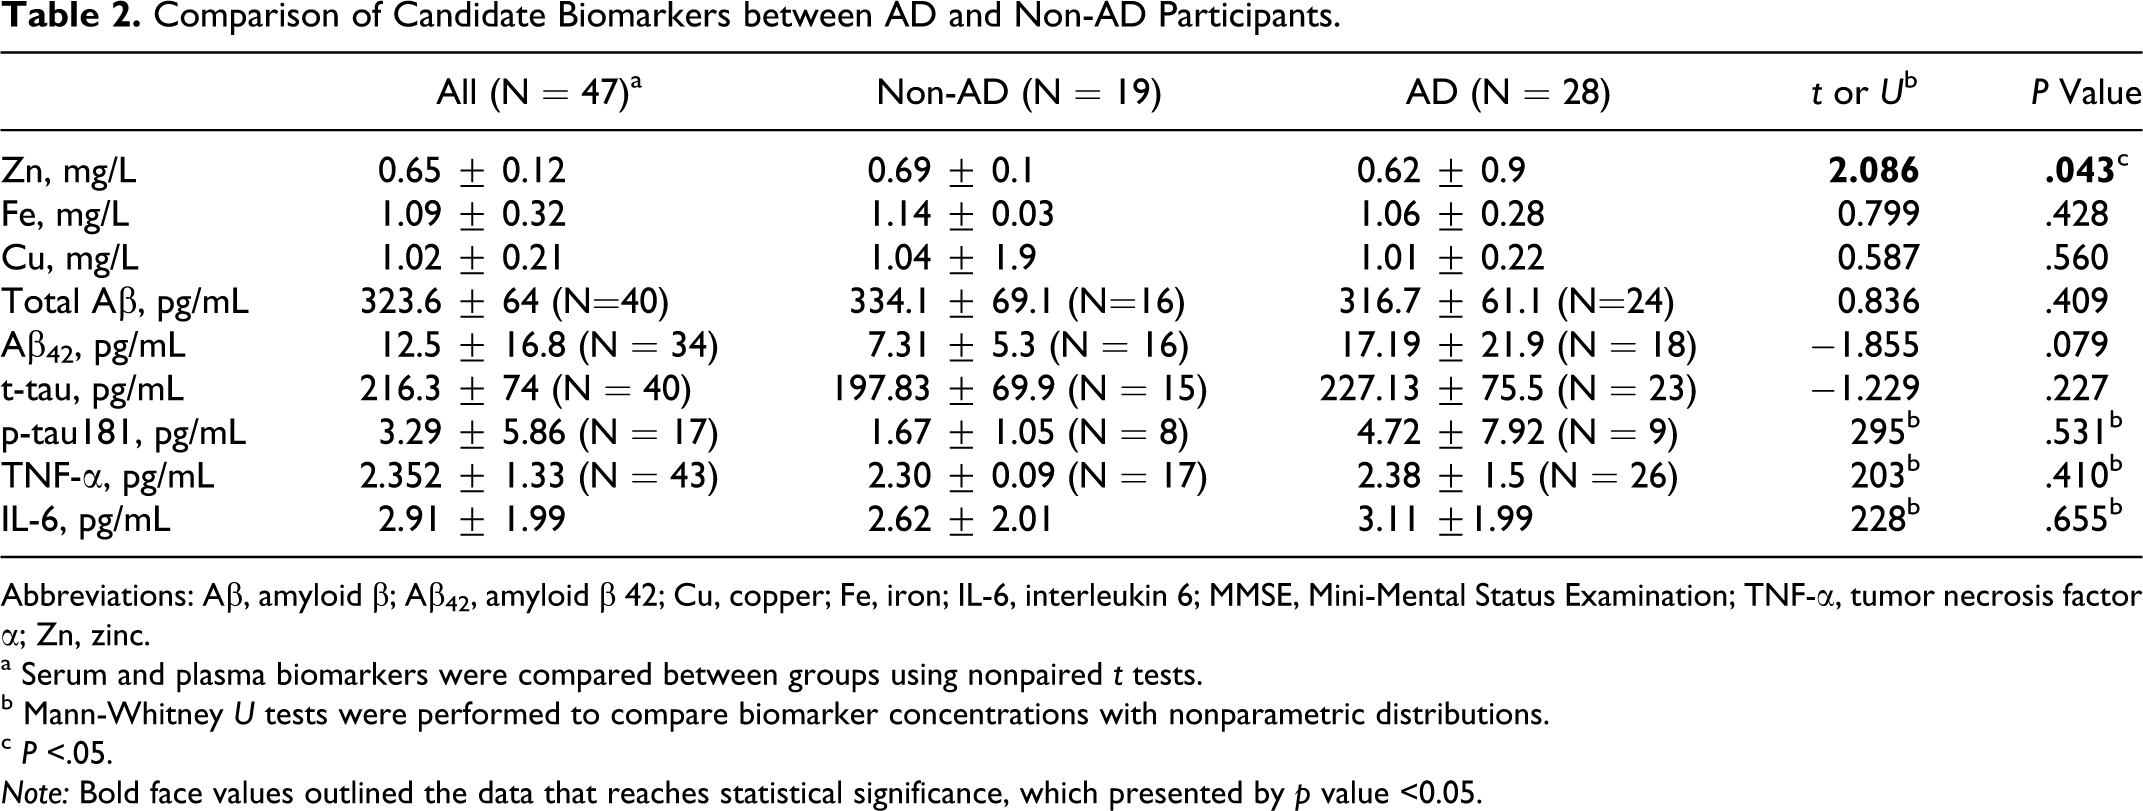
Abbreviations: Aβ, amyloid β; Aβ42, amyloid β 42; Cu, copper; Fe, iron; IL-6, interleukin 6; MMSE, Mini-Mental Status Examination; TNF-α, tumor necrosis factor α; Zn, zinc.
a Serum and plasma biomarkers were compared between groups using nonpaired t tests.
b Mann-Whitney U tests were performed to compare biomarker concentrations with nonparametric distributions.
c P <.05.
Note: Bold face values outlined the data that reaches statistical significance, which presented by p value <0.05.
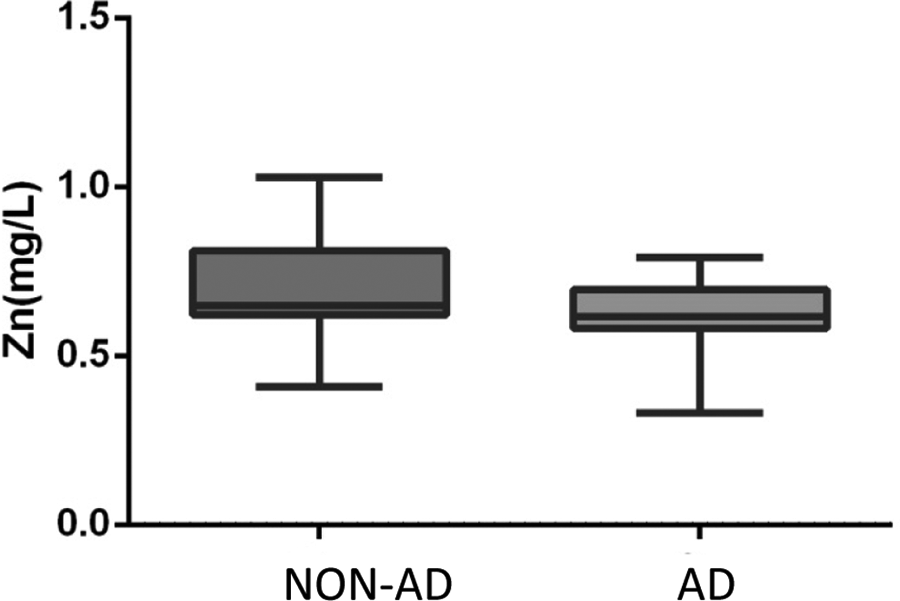
Box-and-whisker plots of plasma zinc concentration in the Alzheimer’s disease (AD) and non-AD group. Mean ± standard deviation plasma concentration of zinc across 2 clinical categories divided according to Clinical Dementia Rating scores. Statistical analysis was carried out by nonpaired t test. Data were presented as box-whisker plots, showing that plasma concentration of zinc was significantly lower in the AD group compared to that in the non-AD group (*P = .043).
Correlations Between Plasma/Serum Concentrations of Candidate Biomarkers and MMSE Scores
To examine which candidate biomarkers better reflect cognitive decline, we examined the correlations between the concentrations of measured proteins and biometals with the MMSE scores (Table 3). The Spearman rank correlation analysis revealed that plasma concentration of TNF-α was significantly and positively correlated with the MMSE score across all participants (Rs = 0.4140, P = .006; Figure 2A), indicating that plasma TNF-α was generally lower in patients exhibiting more severe cognitive impairments. Furthermore, the Spearman rank correlation analysis revealed that plasma TNF-α correlated with the MMSE score in patients with AD (Figure 2B, Rs = 0.5886, P = .0016) but not the non-AD group (Rs = 0.0071, P = .9774; Figure 2C). Thus, plasma TNF-α was lower in patients with AD with more severe cognitive impairments (lower MMSE scores). No other measured candidate biomarker was significantly correlated with the MMSE score (data not shown).
Correlations Between Candidate Biomarkers and MMSE Scores. a
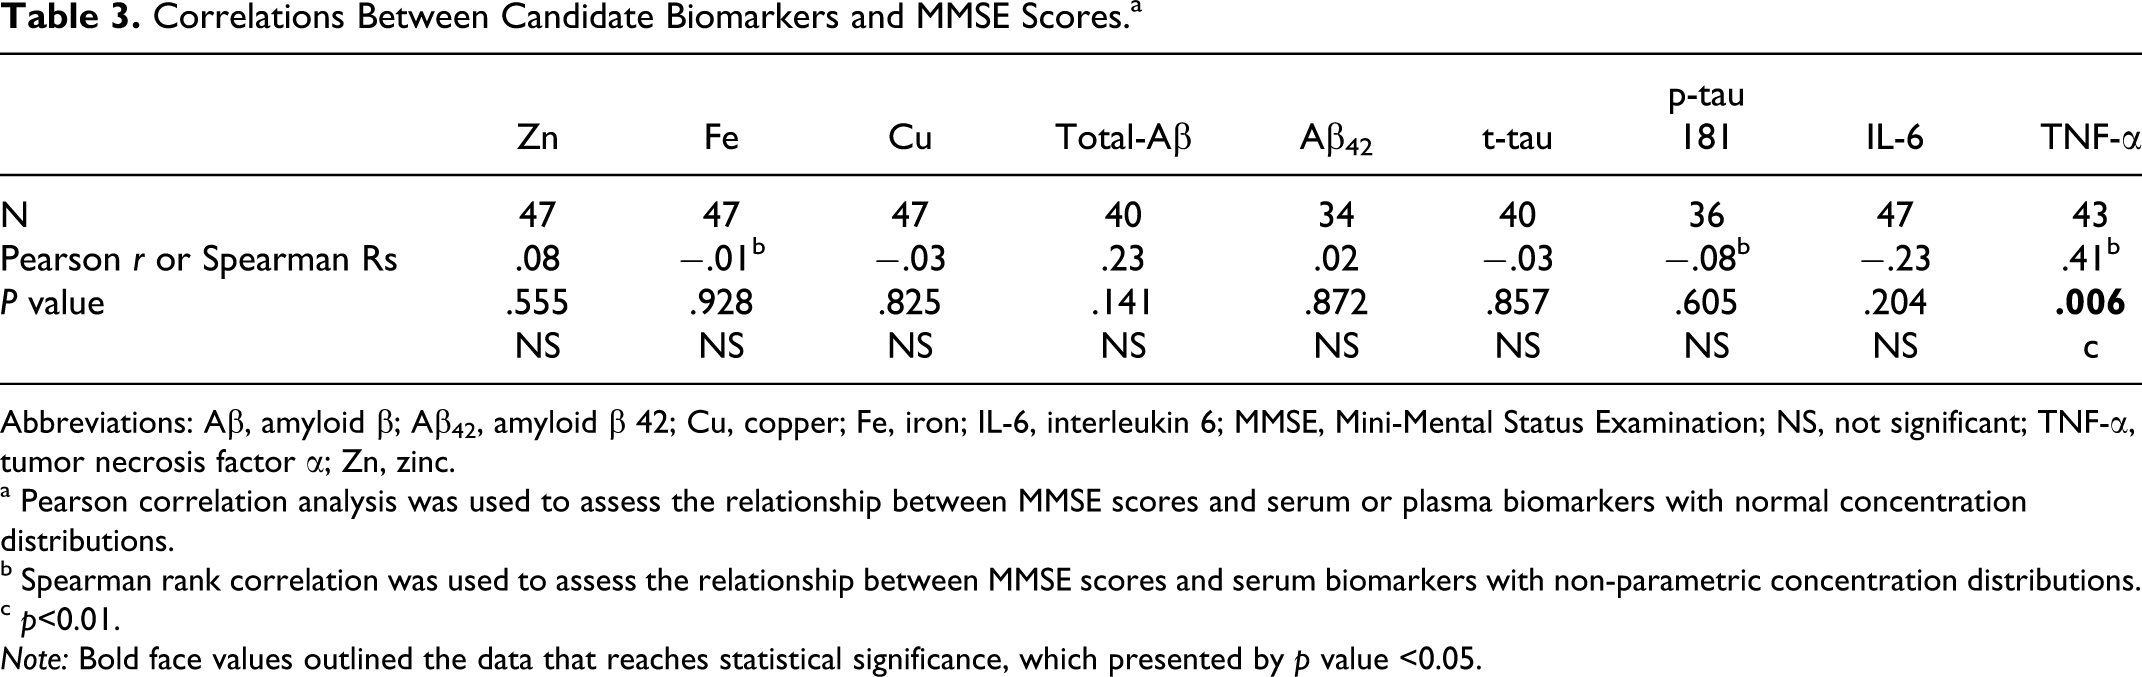
Abbreviations: Aβ, amyloid β; Aβ42, amyloid β 42; Cu, copper; Fe, iron; IL-6, interleukin 6; MMSE, Mini-Mental Status Examination; NS, not significant; TNF-α, tumor necrosis factor α; Zn, zinc.
a Pearson correlation analysis was used to assess the relationship between MMSE scores and serum or plasma biomarkers with normal concentration distributions.
b Spearman rank correlation was used to assess the relationship between MMSE scores and serum biomarkers with non-parametric concentration distributions.
c p<0.01.
Note: Bold face values outlined the data that reaches statistical significance, which presented by p value <0.05.
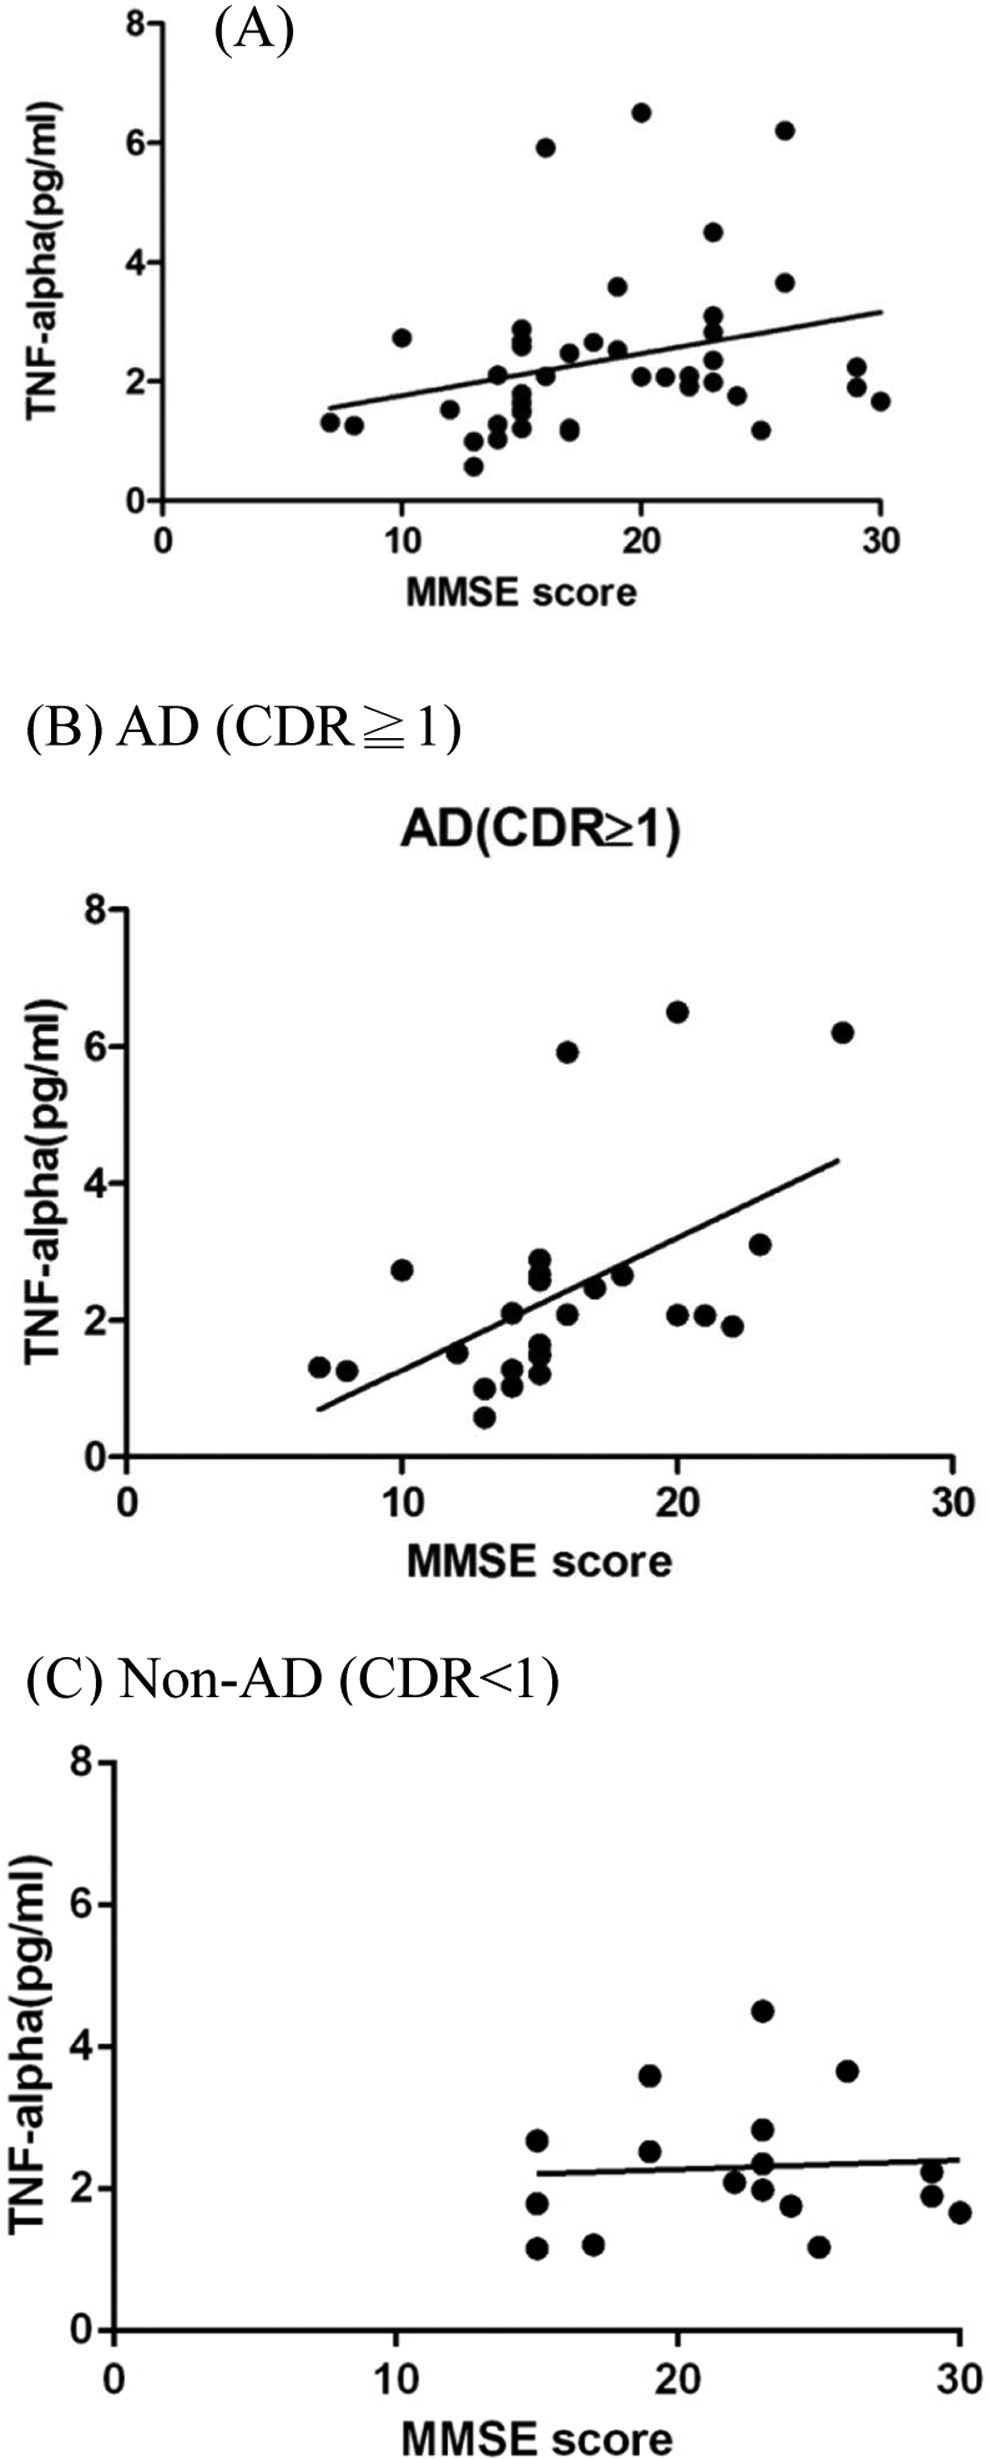
Spearman rank correlation analysis between the plasma tumor necrosis factor α (TNF-α) concentrations and the Mini-Mental State Examination (MMSE) scores.
Correlations of Plasma/Serum Biomarker Concentrations and MMSE Scores With Age
Age may impact the levels of circulating biomarkers; thus, we examined this association in the entire study group and separately in patients with AD and non-AD participants (Table 4). As expected, the MMSE score decreased with the increase in age (data not shown). In addition, there were significantly positive correlations between age and both plasma total Aβ (Rs = 0.47, P = .002) and IL-6 (Rs = 0.42, P = .003) in the entire study population. As age increased, we observed a nonsignificant decreasing trend in plasma Aβ42 (Rs = −0.26, P = .14) and serum Zn (Rs = −0.27, P = .07) concentrations. No correlations were found between age and serum/plasma levels of the remaining biomarkers (Table 4).
Correlations Between MMSE Scores and Candidate Biomarker Concentrations With Participant’s Age. a
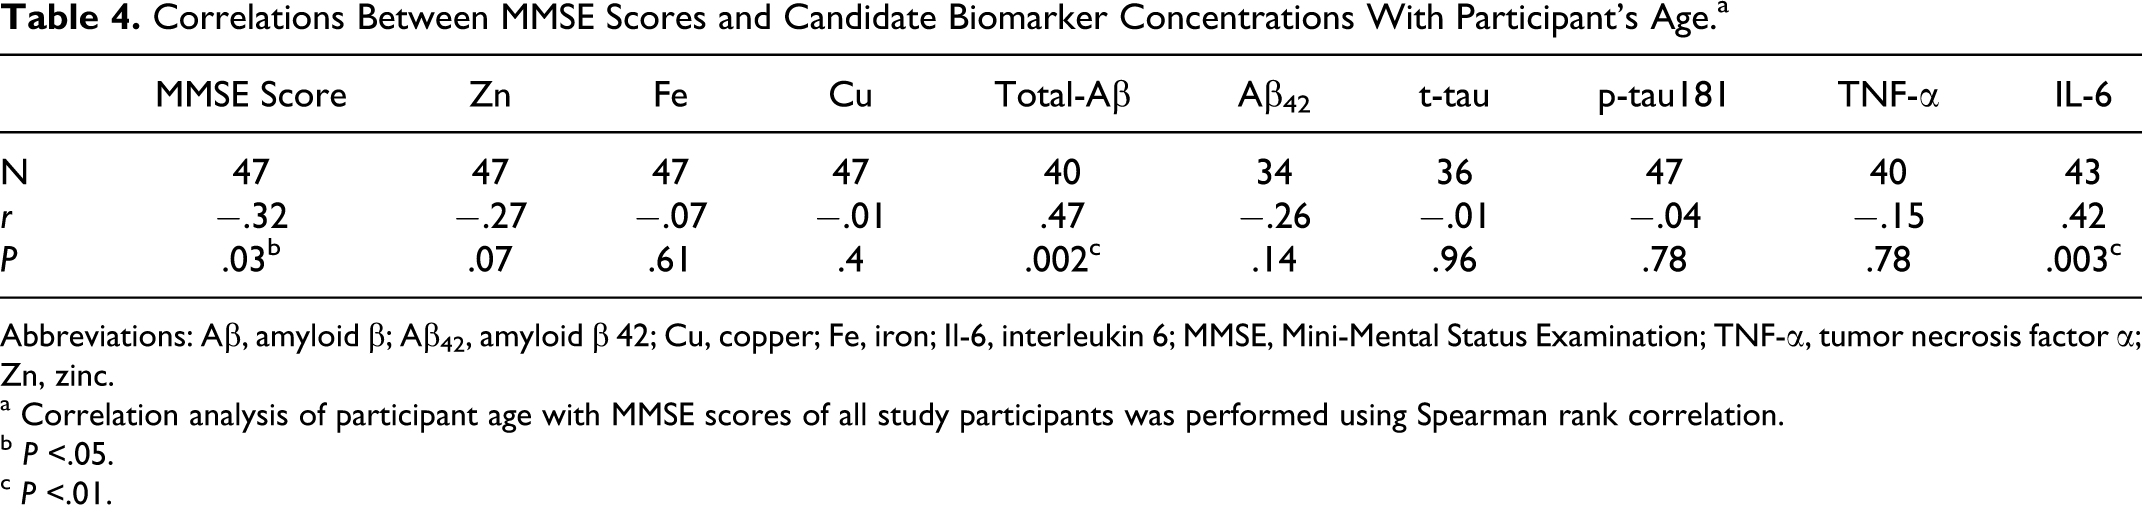
Abbreviations: Aβ, amyloid β; Aβ42, amyloid β 42; Cu, copper; Fe, iron; Il-6, interleukin 6; MMSE, Mini-Mental Status Examination; TNF-α, tumor necrosis factor α; Zn, zinc.
a Correlation analysis of participant age with MMSE scores of all study participants was performed using Spearman rank correlation.
b P <.05.
c P <.01.
We thus re-examined the correlations between the biomarker concentrations and cognitive impairment as assessed by the MMSE scores in all the 3 groups (total, AD, non-AD) after adjusting for age (Table 5). There was still a positive correlation between plasma TNF-α concentration and the MMSE score for the entire group and this correlation held for the AD group (r = .543, P = .005) but not for the non-AD group. In the entire sample, plasma total Aβ correlated with the MMSE score after controlling for age (r = .404, P = .011) and this correlation remained significant for the AD group (r = .489, P = .018) but not for the non-AD group. Plasma Aβ42 concentration increased significantly with the MMSE score (r = .53; P = .042) in the non-AD group but not in the AD group. Of the 3 biometals measured, the only significant correlation found was between serum Fe and the MMSE score in the non-AD group (r = −.47, P = .047).
Partial Correlation Analysis of Candidate Biomarkers and MMSE Scores.
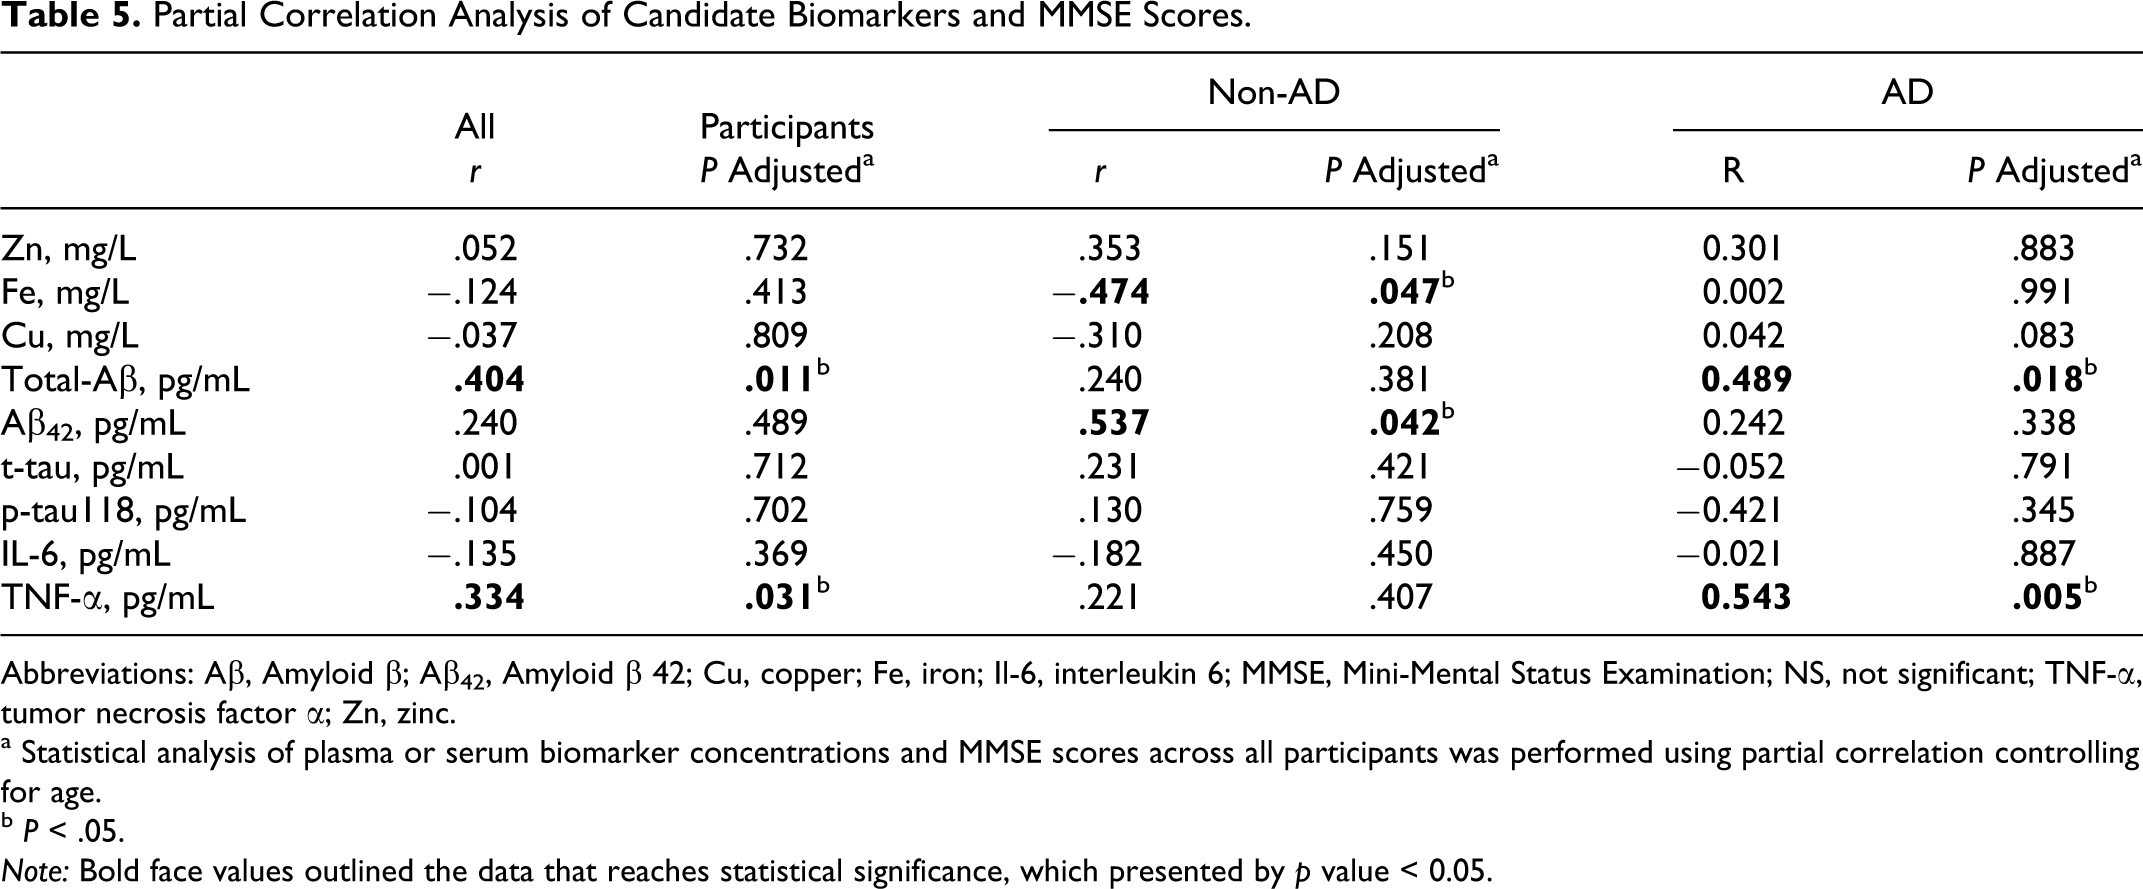
Abbreviations: Aβ, Amyloid β; Aβ42, Amyloid β 42; Cu, copper; Fe, iron; Il-6, interleukin 6; MMSE, Mini-Mental Status Examination; NS, not significant; TNF-α, tumor necrosis factor α; Zn, zinc.
a Statistical analysis of plasma or serum biomarker concentrations and MMSE scores across all participants was performed using partial correlation controlling for age.
b P < .05.
Note: Bold face values outlined the data that reaches statistical significance, which presented by p value < 0.05.
Discussion
We examined the differences in plasma or serum concentrations of biometals, pathogenic proteins, and cytokines between patients with AD and age-matched non-AD controls to define possible biomarkers of AD in the Taiwanese population. Among the 7 measured proteins and biometals, serum Zn concentration was the only potential candidate biomarker that clearly distinguished patients with AD from the non-AD participants independent of age. Plasma TNF-α and total Aβ concentrations were significantly correlated with the MMSE scores in patients with AD, while serum Fe concentration was significantly correlated with the MMSE scores in non-AD participants after controlling for age. These biomarkers, alone or in combination, may help distinguish AD from mild cognitive decline.
Role of Serum Zn Level in AD
The lower concentration of serum Zn observed in patients with AD confirms the results of several previous studies. 21 ,22 Zinc deficiency has been linked to dementia, 23 chronic inflammatory disease, 24 and the progression of other age-related diseases, such as atherosclerosis, diabetes type 2, and cancer. 25 The reduced concentration of serum Zn in patients with AD may result from Zn binding to Aβ and/or amyloid precursor proteins in the brains thus sequestering it from the serum. Alternatively, the decreased serum Zn may also associate with decreased brain ZnT-1 expression and subsequent alterations in cellular Zn distribution thus in turn contribute to AD progression by increasing Aβ processing and deposition. 22 A phase II study of the Cu/Zn ionophore PBT2 reported improved cognition in patients with AD, 26 suggesting that chronic Zn deficiency may contribute to the progression of AD-related cognitive dysfunction.
Nevertheless, lower serum Zn may also indicate either a dietary Zn deficiency or an acute phase response from infection, cancer, or inflammation. 27 The patients in our study were screened for infection and cancer. Zinc deficiency might also stem from inadequate nutrition in patients with AD. 21 Zinc deficiency is common in the normal elderly individuals 27 and the mean of our entire cohort (0.65 mg/L) is below the Zn deficiency cutoff level of 0.80 mg/L. 28 Thus, we cannot exclude the dietary Zn deficiency in our participants. Since many of our study participants came from institutions and high prevalence of undernutrition (45.5%) has been reported in the institutionalized elderly individuals, 29 Zn supplement might be considered in these population.
It should be noted, however, that several studies found no significant differences in serum Zn between patients with AD and control participants. 30,31 These discrepancies could reflect the differences in the criteria used to define AD and control groups. For example, Haines et al included several control participants with cognitive impairment as indicated by the MMSE scores. 30 A longitudinal study of our patients is needed to determine whether low serum Zn is indeed predictive of more rapid cognitive decline.
Inflammatory Cytokines in AD
We found no significant differences in plasma TNF-α or IL-6 concentrations between patients with AD and non-AD participants, consistent with a recent report. 32 However, plasma TNF-α concentration was lower in patients with AD showing greater cognitive dysfunction (as reflected by lower MMSE scores). Furthermore, this correlation in the AD group remained after controlling for age. Thus, elevated serum TNF-α appears to be a biomarker for better prognosis in patients with AD. Serum TNF-α and TNF-α/IL-1 ratios were lower in mild-moderate AD compared to severe AD and dementias due to vascular disease. 33 ,34 These data suggest the dysfunctional inflammatory processes in AD, but the significance of serum TNF-α to the pathogenesis of AD remains uncertain.
The mean plasma concentrations of our measured cytokines were within normal ranges according to a meta-analysis of several large-scale studies, 11 underscoring the reliability of these measurements. We also found that plasma IL-6 concentration significantly increased with age, consistent with earlier reports showing an increase in plasma IL-6 of 0.016 pg/mL per year of life. 35 The IL-6 is a potent inflammatory mediator, and 1 theory on the pathogenesis of AD postulates that neurodegeneration results from chronic inflammation caused by IL-6. 36 However, no increase in plasma or CSF IL-6 concentrations has been reported in patients with AD, 37 suggesting that if brain IL-6 release does contribute to the pathogenesis of AD, serum/CSF IL-6 does not reflect brain IL-6 production. 38
Plasma Total Aβ and Aβ42 in MCI, AD, and the Normal Elderly Individuals
Our study showed that plasma total Aβ increased with age across all participants and a positive correlation between plasma total Aβ and disease severity. The relationship between plasma Aβ and AD has been particularly confounding. 6 ,39,40 These inconsistencies may result, at least in part, from limitation in the current antibody-based detecting methods. Both plasma protein binding and oligomerization of Aβ could mask its epitopes, thus interfering with ELISA measurements, and this possible confounder may even differ between individual ELISA kits. The development of anti-Aβ oligomer-specific antibodies, which could obviate concerns about epitope masking, may provide a more reliable measure of Aβ oligomer levels in plasma.
In a longitudinal study following dementia-free control in elderly individuals and patients with AD for 4.5 years, both plasma Aβ40 and Aβ42 increased with age in normal participants but decreased after an initial increase in patients with AD. Furthermore, higher baseline plasma Aβ42 and Aβ40 concentrations were associated with a faster decline in multiple cognitive domains in the healthy participants. 41 The association between plasma Aβ concentration and cognitive decline in healthy elderly individuals suggested that Aβ changes may be an important factor in cognitive aging independent of AD. Future studies will be needed to examine the possibility of using plasma Aβ profiles to predict the progression of dementia and to monitor treatment response in patients with MCI/dementia. Due to low level and aggregate nature of Aβ42, the detection of serum Aβ42 has been a challenge. The level of total Aβ42 was undetectable in 13 participants in our sample. Future study of greater sample size and more sensitive detection method is necessary.
In conclusion, we found that the plasma levels of TNF-α and total Aβ correlated with cognitive function in AD in the Taiwanese population. Therefore, these are strong candidate biomarkers for monitoring disease progression and treatment response. The limitations of our study include the relatively small number of normal elderly participants and the greater proportion of male participants. Furthermore, only 1 ApoE4 carrier was found in this study cohort. The impact of ApoE genotype on circulating cytokines, proteins, and biometals warrants further study but requires much larger samples given the rarity of the ApoE4 allele, particularly in Asian participants.
Footnotes
Acknowledgments
We thank Yeou-lih Huang PhD (Department of Medical Laboratory Science and Biotechnology, Kaohsiung Medical University) for determinations of serum biometal concentrations.
Declaration of Conflicting Interests
The authors declared no potential conflicts of interest with respect to the research, authorship, and/or publication of this article.
Funding
The authors disclosed receipt of the following financial support for the research, authorship and/or publication of this article: Taiwan National Health Research Institutes grant (NHRI-EX101-9816NC), Taiwan National Science Council grant (NSC97-2320-B-010-027-MY3 and NSC100-2320-B-010-020), and Taiwan Ministry of Education Aim for Top University Grant.