
Abstract
Irreversible electroporation is a novel tissue ablation technique which entails delivering intense electrical pulses to target tissue, hence producing fatal defects in the cell membrane. The present study numerically analyzes the potential impact of liver blood vessels on ablation by irreversible electroporation because of their influence on the electric field distribution. An anatomically realistic computer model of the liver and its vasculature within an abdominal section was employed, and blood vessels down to 0.4 mm in diameter were considered. In this model, the electric field distribution was simulated in a large series of scenarios (N = 576) corresponding to plausible percutaneous irreversible electroporation treatments by needle electrode pairs. These modeled treatments were relatively superficial (maximum penetration depth of the electrode within the liver = 26 mm) and it was ensured that the electrodes did not penetrate the vessels nor were in contact with them. In terms of total ablation volume, the maximum deviation caused by the presence of the vessels was 6%, which could be considered negligible compared to the impact by other sources of uncertainty. Sublethal field magnitudes were noticed around vessels covering volumes of up to 228 mm3. If in this model the blood was substituted by a liquid with a low electrical conductivity (0.1 S/m), the maximum volume covered by sublethal field magnitudes was 3.7 mm3 and almost no sublethal regions were observable. We conclude that undertreatment around blood vessels may occur in current liver ablation procedures by irreversible electroporation. Infusion of isotonic low conductivity liquids into the liver vasculature could prevent this risk.
Introduction
Irreversible electroporation (IRE) is a relatively novel nonthermal ablation modality. 1 Irreversible electroporation is typically performed by inserting thin electrodes into the target tissue and delivering a number (8-100) of short (10-100 µs) high-voltage pulses across the electrodes, thereby producing field magnitudes in the tissue in an order of 1000 V/cm. These pulsed fields cause a large increase in cell membrane permeability to ions and macromolecules which fatally disrupts cell homeostasis. 2
Ablation of soft tumors by IRE has been demonstrated in a number of clinical studies. 3 -9 Irreversible electroporation ablation is not based on heating, which gives it 2 major advantages over other ablation modalities: (1) IRE does not destroy the extracellular matrix and (2) IRE is insensitive to thermal sinks. These advantages imply that it is safe and physically possible to use IRE to treat tissues which are in close proximity to vital vessels or are in contact with them. The first advantage implies that it is safe to perform IRE ablation in the vicinity of vital vessels because the structural properties of those vessels are preserved. 8,9 It is even possible to directly treat arteries without compromising their fluidic function. 10 The second advantage implies that it is physically possible to perform IRE ablation in the vicinity of large blood vessels. 11,12 In contrast to other ablation modalities based on heating or freezing, the thermal sink effect produced by large blood vessels does not hinder IRE ablation. From this last feature, it may be mistakenly concluded that the presence of blood vessels is irrelevant for IRE ablation. A subjacent objective of the present work was to illustrate that this is not the case.
The effectiveness for IRE depends on the temporal features of the sequence of pulses, but for a given set of temporal features (number of pulses, pulse duration, and repetition frequency), it is accepted that local IRE effectiveness depends mainly on the local field magnitude; an electric field threshold for IRE is typically defined for each tissue type and pulse protocol. 13 Therefore, any factor that may have an impact on the electric field distribution may have an impact on the ablation. In the case of the liver—which tends to be considered as homogenous in electrical terms—one of those factors may be the contrast in electrical conductivity between the liver parenchyma and the interior of the blood vessels. Indeed, recent numerical studies 14 -16 and in vivo studies 14,17 have revealed that this sort of heterogeneity may have a significant impact on IRE ablation. However, to the best of our knowledge, its impact on liver ablation has been neither observed clinically nor assessed for clinical relevance through numerical studies.
The purpose of this is to numerically analyze and quantify the potential impact of liver blood vessels on ablation by IRE due to their influence on the electric field distribution.
Materials and Methods
An anatomically realistic computer model of a male human liver, with its blood vessels (down to 0.4 mm in diameter), bones, and surrounding tissues, was employed in this study. The 3-dimensional (3-D) anatomical geometry was developed by the Korea Institute of Science and Technology Information. 18 The geometry was decimated and prepared for simulation using the Graphical Interface for Medical Image Analysis and Simulation software platform developed by the Center for Computational Imaging and Simulation Technology in Biomedicine at the Universitat Pompeu Fabra. 19 The main geometrical features of the modeled liver and its vasculature are indicated in Table 1.
Geometrical Measurements of the Liver and the Vessels Used in This Study.

Electroporation across pairs of needle probes was simulated. The 2 probes of the pair were parallel and aligned so that they would form the opposite sides of an imaginary rectangle. Six arbitrarily chosen locations and 4 separations (10, 15, 20, and 25 mm) per location were assayed. These locations correspond to probe insertions through the anterior part of the abdomen. Figure 1 shows the anatomic model together with the assayed locations (separation = 25 mm). Each needle probe, with a diameter of 1 mm, consisted of a passive shaft (length = 40 mm) and an active part (ie, the electrode) with a length of 10, 15, 20, or 25 mm. The penetration depth of the pair was adjusted to ensure a complete and superficial insertion of the active part into the liver, with a maximum proximal distance of 1 mm from the surface of the liver. This resulted in a maximum penetration depth of 26 mm within the liver.

Three-dimensional (3-D) geometrical representation of the 6 insertion locations assayed for the electrode pairs (in this case, the interelectrode spacing is 25 mm and the electrode length is 25 mm).
Electrode locations were carefully checked for ensuring that the electrodes neither penetrated the vessels nor were in contact with them. It was ensured that the minimum distance between the electrodes and any vessel was 0.2 mm. It was also ensured that the probes did not go through bone tissue. If these conditions were not met, the location of the probe pair was randomly modified a few millimeters (<5 mm), maintaining the above constraints regarding parallelism, separation, and penetration depth.
For each model (homogeneous and nonhomogeneous), 3 voltages across the 2 electrodes were assayed: 2000, 2500, and 3000 V. The total number of simulated cases for each model was 288 (6 locations × 4 separations × 4 electrode lengths × 3 voltage magnitudes). The electric field threshold for effective IRE was considered to be 700 V/cm. 2,15,20
The 3-D geometry was imported into COMSOL Multiphysics 4.3a (COMSOL AB, Stockholm, Sweden). The entire geometry was meshed using the COMSOL Multiphysics regular refinement method user-controlled tetrahedral mesh with a minimum element size of 0.1 mm. The total number of elements was above 2 200 000.
The electric field distribution was computed using the “electric currents (ec)” application mode of the AC/DC module of COMSOL. As in previous studies,
15,21
-24
nonlinear behavior was assumed for the hepatic tissue in order to model the increase in tissue electrical conductivity during pulse delivery due to electroporation. This behavior was modeled with the following sigmoid equation describing the dependency of tissue conductivity (σ) of electric field magnitude (

where σ0 is the conductivity of the tissue when no field is applied (ie, initial conductivity), σ f is the maximum conductivity the tissue can reach due to electroporation (ie, final conductivity), and T and W are 2 parameters that describe the morphology of the sigmoid (coarsely, inflection magnitude and slope, respectively). The set of values used for the hepatic tissue model was: σ0 = 0.2 S/m, σf = 0.5 S/m, T = 950 V/cm, and W = 200 V/cm. These values would correspond to hepatic tumors and have been inferred from experimental data by Prakash et al. 25 The values for healthy (normal) liver tissue would be σ0 = 0.05 S/m, σf = 0.3 S/m, T = 950 V/cm, and W = 200 V/cm, as also inferred from data by Prakash et al. 25 This set of values was also assayed in this study and the results obtained are reported as supplemental material. We deemed it more realistic to model tumor properties rather than healthy liver properties because IRE treatments mostly occur on tumor tissues (ie, the electrodes are inserted into the tumors).
The electrical conductivity of the other tissues was modeled as field independent. The conductivities of the vessels (modeled as blood containers), bones, and soft tissues filling the anatomy (modeled as a combination of muscle, fat, and body fluids) were 0.7 S/m, 0.02 S/m, and 0.2 S/m, respectively; these values were obtained from experimental data found in the study by Gabriel et al. 26 Conductivity values of the electrodes and the passive shafts were set to 1 × 10⁵ and 1 × 10⁻⁵ S/m, respectively.
For each case, a simulation was performed assuming the presence of the vasculature (σvessels = 0.7 S/cm) and another one was performed under the assumption that the liver was homogenous (σvessels = σliver). Both solutions were then compared. First, the size of the ablation volumes was compared (regions in which
In addition to the above-referred systematic study with 288 cases, for graphical illustration, 2 hypothetical treatment cases were simulated to emphasize the impact of undertreatment around vessels. First, case H1 was simulated in which the presence of a tumor (20.7 × 19 × 10 mm3) was modeled at a distance of 0.3 mm away from the right hepatic vein (Figure 2A). In this case, the distinctive conductive properties of the liver and the tumor were modeled according to the tumor conductivity models and parameters described above. In the second case (case H2), the impact of blood vessels on the IRE treatment was assessed by inserting the pair electrodes (active part = 25 mm and passive shaft = 50 mm) deep into the liver with a maximum penetration depth of 65 mm. The electrodes were located 1 mm from the right hepatic vein and the portal vein, which are 10.2 and 14.6 mm in diameter, respectively, and 3 mm from the middle hepatic vein, which is 8.1 mm in diameter.

X-Y plane plot of electric field magnitude during hypothetical treatment of a tumor. A, The 3-dimensional (3-D) geometry model. B, The homogenous model (σvessels ≠ σliver ≠ σtumor). C, The nonhomogenous model (σvessels = 0.7 S/m ≠ σliver ≠ σtumor) result. D, Result when the vessel is filled with low conductivity fluid (σvessels = 0.1 S/m ≠ σliver ≠ σtumor).
Furthermore, as it is common to employ more than 2 electrodes in IRE treatments, additional simulations were performed using 3-electrode and 4-electrode arrays. For each array model (homogeneous and nonhomogeneous), 2 active length (20 and 25 mm), 2 interelectrode spacing (20 and 25 mm), and 3 voltages across the electrodes pairs (2000, 2500, and 3000 V) were used. The total number of simulated cases for each array model was 12 (2 separations × 2 electrode lengths × 3 voltage magnitudes).
Results
Simulations Indicate That Undertreatment May Appear Around Vessels
Figure 2A shows the geometry of the modeled hypothetical treatment of a tumor (case H1), and Figure 2B and C shows a cross-section of the corresponding simulated electric field magnitude assuming that the liver is homogeneous (σvessels = σliver ≠ σtumor) and that it is heterogeneous (σvessels = 0.7 S/cm ≠ σliver ≠ σtumor), respectively. It can be observed that for the homogeneous case (Figure 2B), the treatment volume (regions in which
Impact of Vessels on the Treated Volume
Table 2 shows the result of volume analysis for the 576 simulations (288 homogeneous and 288 nonhomogeneous). The average treated volume (regions in which
Average of Treatment Volumes (for 6 Locations) and the Maximum Percentage Deviation Between Homogeneous and Nonhomogeneous Models.

Abbreviations: %D, maximum percentage deviation between the homogeneous and the nonhomogeneous cases; HT, homogeneous tumor tissue; NHT, nonhomogeneous tumor tissue.
The simulation results indicate that there are differences between homogeneous and nonhomogeneous cases regarding the treated volume. It can be observed that the average integrated volume in cm3 increases as electrode depth, spacing, and applied potential increase. The maximum percentage deviation of the tumor models ranged from 0.5% up to 6%.
Undertreatment Volume Quantification
The volume of tissue subjected to undertreatment because of the presence of blood vessels (heterogeneous case) was quantified by estimating the integrated volume inside the target region (regions in which
Volumes of Tissue Subjected to Undertreatment Because of the Presence of Blood Vessels.
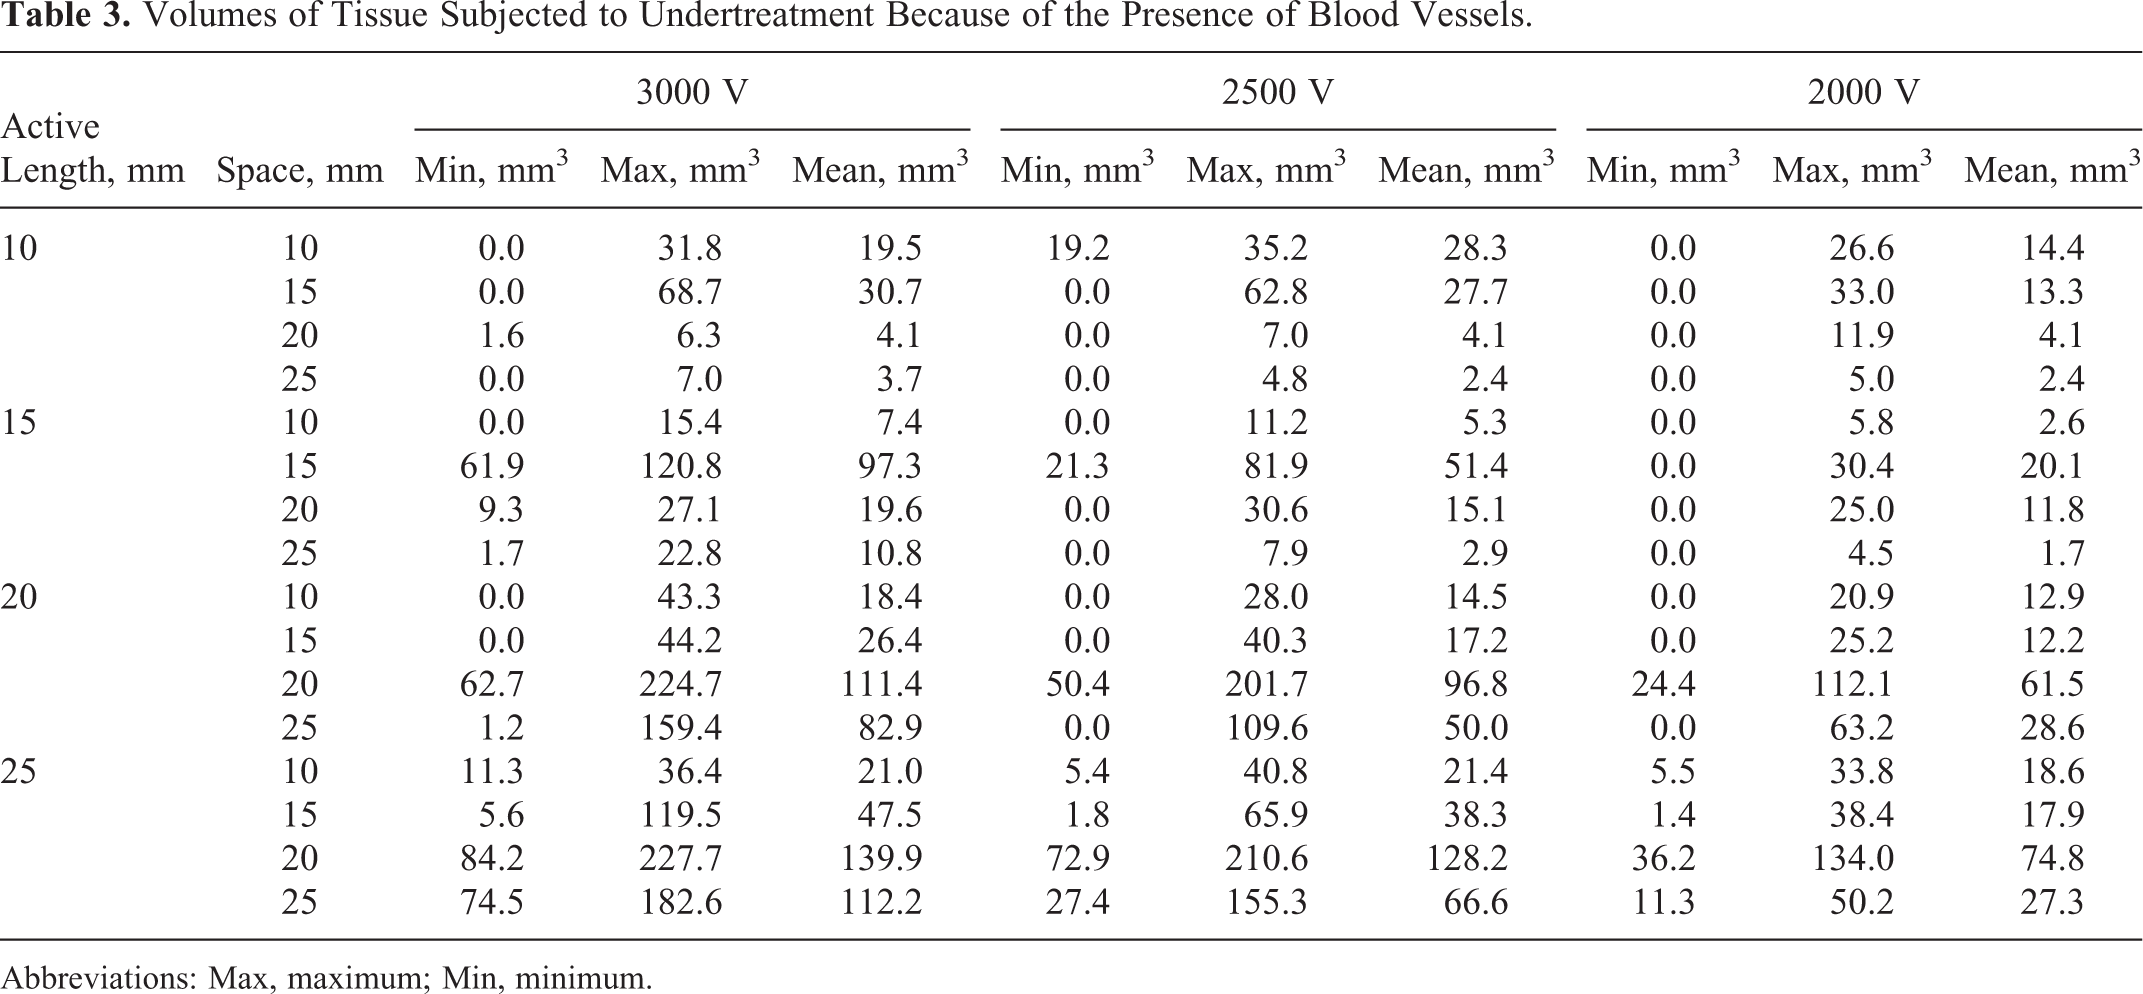
Abbreviations: Max, maximum; Min, minimum.
The results in Table 3 indicate that the minimum and maximum undertreatment volumes found for the 10, 15, 20, and 25 mm active lengths were 0 to 68.7, 0 to 120.8, 0 to 224.7, and 1.4 to 227.7 mm3, respectively. In some cases, in which the electrodes were inserted near very small vessels or >10 mm away from vessels with diameters ranging from 2 to 8 mm, the undertreatment volume was close to 0 mm3.
Figure 3 illustrates 2 cases of undertreatment around the vessels. The green regions represent the isosurfaces of treatment (
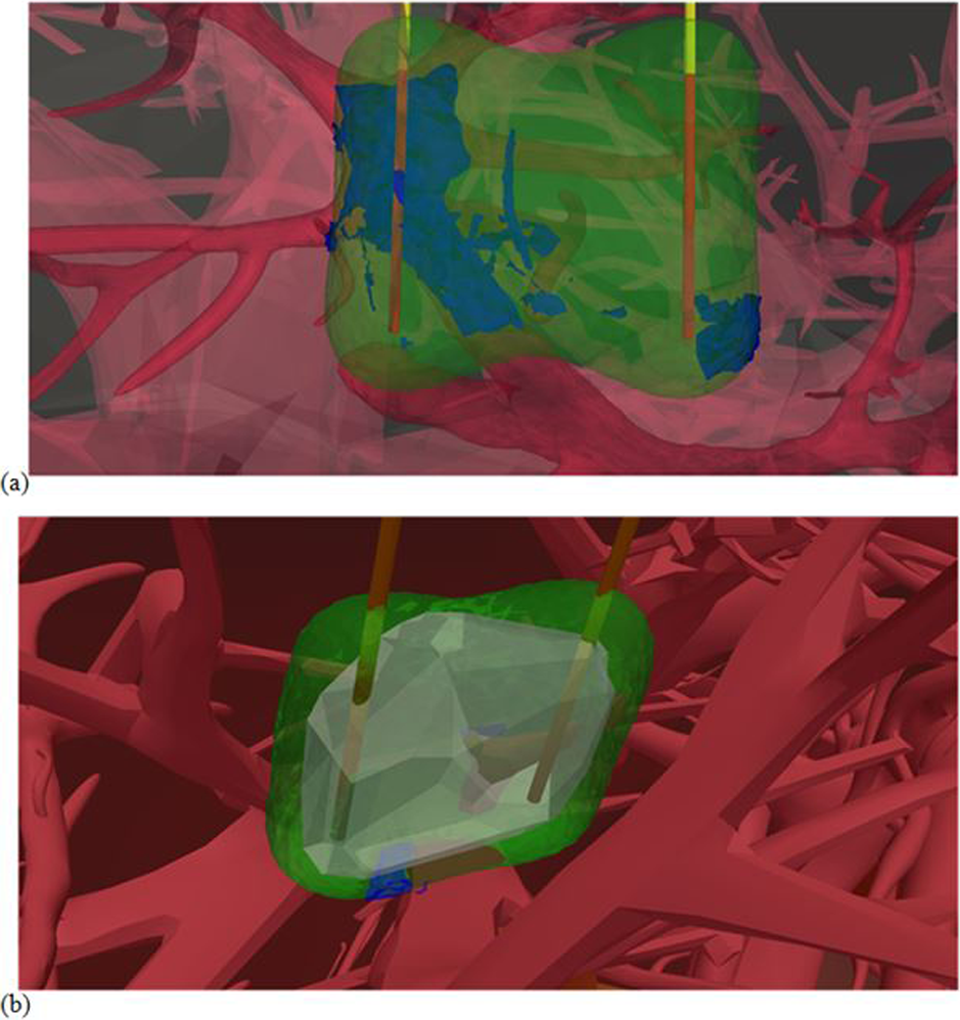
Three-dimensional (3-D) volume plot of vessels (red), homogenous treatment region (green), tumor region (gray, only in B) and untreated spots (blue). A, Deep treatment of liver (no tumor) close to the right hepatic vein and the portal vein with 25-mm electrode active length and spacing, 3000 V applied potential. B, Tumor case study close to vessels with 15 mm active length, 14 mm spacing, and 2000 V applied potential (case 2 dimensional [2-D] illustrated in Figure 2C).
The result depicted in Figure 3A (case H2) corresponds to the largest undertreatment volume found heuristically when very deep ablations were assayed. The numerical results corresponding to this case shown in Figure 3A indicate that the undertreatment volume was 1049, 731.6, and 313.2 mm3 for the 3000, 2500, and 2000 V applied potentials, respectively.
Simulated Probability of Undertreatment
The event rate of undertreatment was estimated from the 288 simulated cases, and it was considered to occur when there was at least an undertreated region (
The results in Table 4 indicate that the minimum and maximum probability of having undertreatment volume (≥ 1 mm3) found for the 10 mm active length electrode was 2/6 to 4/6 and for the 15, 20, and 25 mm active length electrodes were 2/6 to 6/6. Furthermore, it was found that the presence of vessels with a diameter ≥3 mm within the target region always produced at least a region of undertreatment with a volume ≥1 mm3.
Number of Cases of Undertreatment (Undertreated Volume ≥1 mm3) Out of the 6 Assayed Insertion Locations.

Three and 4-Electrode Arrays
In order to be further relevant to clinical treatment, we simulated 3-electrode and 4-electrode arrays with the various electrode configurations (20-25 mm depth and 15-25 mm spacing). This was performed by applying 2000, 2500, and 3000 V to the possible electrode sets and between the 2 diagonal pairs.
The result depicted in Figure 4 shows 4 possible treatment planning approaches for the targeted tumor in case H1 depicted in Figure 2. Figure 4A shows the result of a 2-electrode model with 15 mm active length. The distortion on the electric field distribution is clearly observed around the blood vessels. Figure 4B shows the result of 4-electrode array simulation with 15 mm active length. It can be observed that the 4-electrode array increased the treatment zone and reduced the undertreatment region; however, a small area of electric field distortion was still noticed around the vessel. Figure 4C shows the simulation result of 3-electrode array simulation with 20 mm active length. It can be observed that the increase in active length increased the treatment region; nonetheless, a small region of electric field distortion is also clearly noticed around the vessels. The result depicted in Figure 4D shows the result of low conductivity liquid infusion (0.1 S/m); see the next section. A uniform electric field distribution was produced and it was noticed that the undertreatment region around the vessels was completely covered.

X-Y plane plot of electric field magnitude during hypothetical treatment of a tumor. A, The nonhomogenous model (σvessels = 0.7 S/m ≠ σliver ≠ σtumor) two 15-mm electrodes model result. B, The nonhomogenous model (σvessels = 0.7 S/m ≠ σliver ≠ σtumor) four 15-mm electrodes model result. C, The nonhomogenous model (σvessels = 0.7 S/m ≠ σliver ≠ σtumor) three 20-mm electrodes model result. D, Result of two 15-mm electrodes model when the vessel is filled with a low conductivity fluid (σvessels = 0.1 S/m ≠ σliver ≠ σtumor).
Furthermore, we repeated the simulation of the maximum undertreatment volumes found in our study with 3-electrode and 4-electrode arrays in order to assess the impact of these approaches on the undertreatment volumes. The results depicted in Table 5 show the maximum undertreatment volume found in the repeated simulations. The maximum undertreatment volumes found for the 20 and 25 mm active lengths were 227.7, 291.9, and 215.7 mm3 for 2-, 3-, and 4-electrode arrays, respectively. In cases where the electrodes were inserted near a heavy set of vessels, a larger undertreatment volume was sometimes found.
Volumes of Tissue Subjected to Undertreatment Because of the Presence of Blood Vessels of Different Treatment Approaches.

Abbreviations: Max, maximum.
Simulated Potential Benefit of Infusing Low Conductivity Fluids Into Liver Vasculature for Preventing Undertreatment
In order to prevent undertreatment due to the heterogeneity conductivity caused by the liver vessels, we propose to inject the blood vessels with a low conductivity liquid so that the tissues become more homogeneous in terms of conductivity. Figure 2D illustrates that the electric field distribution obtained with a model in which the vessel has a conductivity of 0.1 S/m is almost indistinguishable when compared to that obtained with the homogenous model. More importantly, the region of tumor undertreatment observed in Figure 2C disappears in Figure 2D.
The results in Table 6 indicate that by reducing the modeled conductivity of blood vessels, the size of the undertreated volumes is extremely reduced, and in most cases, undertreatment is not noticeable at all. The event rate of undertreatment is reported in Table 7 when the conductivity of the vessels is set to 0.1 S/m rather than 0.7 S/m.
Average Undertreated Volume (mm3) for Different Electrical Conductivities of the Liver Vessels.

Number of Cases of Undertreatment (Undertreated Volume ≥ 1 mm3) Out of the 6 Assayed Insertion Locations When the Conductivity of the Vessels is 0.1 S/m.

Discussion
Complete ablation of viable tumor cells by achieving an adequate electric field distribution is the purpose of IRE treatment planning. Thus, understanding the impact of the treatment area characteristics, the electric conductivity heterogeneities, in particular, on the electric field distribution, is crucial to achieving optimal treatment. In this study, the impact of blood vessels in the treatment zone was examined in a realistic anatomical model consisting of liver, blood vessels, bones, and surrounding tissues that were obtained from human male computer tomography imaging. In earlier studies, it has been found that large blood vessels, because of their high conductivity, may interfere with electric field coverage of tumors in the liver. 14 -16 Golberg et al 14 described the impact of blood vessels on electric field distribution of IRE treatment, in which they experimentally demonstrated the need to increase the baseline field intensity around large vessels. Unsurprisingly, our study found that the distortion produced by the conductivity heterogeneity caused by the presence of a blood vessel was dependent on the vessel diameter and on the electrode’s distance to the vessel. This is in agreement with other previous studies. 14 -16,27 -29
In the present study, we have modeled the blood vessels as simple containers of blood. That is, they were modeled as homogeneous regions of higher electrical conductivity than the liver parenchyma. Unfortunately, our data model didn’t support the inclusion of vessel wall. Furthermore, the thickness of vessel walls varies enormously around arteries and veins, let alone variability in the structure between veins and arteries. The lack of existing data about vessel walls as well as the nonuniform geometry distribution of vessels limited the possibility of adding accurate vessel walls around our data model. However, to validate this simplification, an additional group of simulations was repeated with the inclusion of a 1-mm vessel wall around large hepatic veins and portal vein, as described in our previous study. 30 The results of these simulations is included in the supplemental materials (Figure 1 and Table 7). The results show that the presence of the wall reduces the influence of blood on the electric field distribution and the undertreatment volumes. However, the relative difference in undertreatment volume compared to the results reported here does not exceed 21%.
In terms of treatment volume size (Table 2), our results indicate that the impact of blood vessels will be mild for superficial liver IRE treatments. The maximum deviation in volume we observed was only 6%, which can be perceived as almost negligible if other confounding factors that influence the outcome of IRE are considered. For instance, tolerances when placing the electrodes are likely to cause a larger error in treatment planning. On the other hand, the observed regions of undertreatment around the blood vessels represent a potentially grave issue. We observed undertreatment in 65% of the analyzed cases (Table 4). This high incidence rate would increase if deeper treatments—such as the ones represented in Figure 3—were analyzed because the electrodes would be closer to even larger vessels. Therefore, we deem that undertreatment is likely to occur in current IRE liver treatments. It must be noted that IRE is particularly prescribed for ablations close to vessels, because in those scenarios, other ablative techniques based on temperature are not usable. 31 Whether undertreated regions of only 1 mm3 represent a real clinical threat is still debatable, particularly because in our analysis, undertreatment typically occurred at the periphery of the target volume and it must be presumed that in clinical IRE these locations would correspond to the safety margins considered during treatment planning. However, undertreatment certainly should be a matter of concern because any tumor cell left viable is a new potential tumor nodule. Furthermore, it must also be taken into account that we obtained much larger volumes of undertreatment, reaching up to 228 mm3 (Table 3). Therefore, although to the best of our knowledge no clinical cases of recurrence after hepatic IRE have been reported that were directly linked to undertreatment around vessels, we advise practitioners of liver IRE to carefully monitor any possible signs of recurrence around vessels during posttreatment follow-ups. Again, it is convenient to note that undertreatment around vessels has been experimentally reported by Golberg et al. 14
Different treatment planning approaches were included in our simulation in order to be more relevant to clinical applications. Three-electrode and 4-electrode arrays were simulated. Our results show an increase in the treatment zones and a decrease in the size of undertreatment volumes (Table 5). The 4-electrode array produced a larger treatment zone similar to the reported results in the study Appelbaum et al. 11
In order to prevent undertreatment due to the presence of vessels, we propose to replace blood in the liver vessels with an isotonic low conductivity liquid—such as a mixture of normal saline and dextrose 5%—so that the tissues are made more homogeneous in terms of conductivity. Our results indeed showed a huge improvement regarding cases of undertreatment (Table 7) and regarding the size of the undertreated regions (Table 6) when the conductivity of the vessels is set to 0.1 S/m. Similar results, not reported here, were obtained with higher (0.2 S/m) and lower (0.05 S/m) conductivities.
Delivery of low conductivity liquids into the liver vasculature could be performed either directly through percutaneous transhepatic portal catheterization, which has been used for islet transplantation, 32 or through hepatic vascular exclusion (HVE) maneuvers by deploying clamps through laparoscopy. 33 It is worth noting that total HVE has been used for gene therapy 34 or to improve the pharmacokinetics of chemotherapeutic drugs. 35 Several low conductivity solutions could be employed with a reasonable margin of safety. 36 -38 In particular, by diluting 1 part of normal saline (0.9% NaCl, σ37°C = 1.5 S/m) in 14 parts of dextrose 5% (σ37°C < 0.01 S/m), an isotonic solution with a conductivity of about 0.1 S/m would be obtained. Note that if the delivery technique does not substitute the blood but merely dilutes it, then the conductivity of the injected liquid would have to be adjusted to a lower value so that the resulting mixture had an adequate conductivity (0.1 S/m).
Conclusion
Due to their impact on electric field distribution, liver blood vessels may have an impact on IRE treatments in terms of treatment volume size and shape. This numerical study shows that the impact of blood vessels occurs around the medium-sized vessels and on the periphery of the treatment region, which may sufficiently distort the electric field distribution that resulted in undertreatment regions, with the potential effect on the quality of IRE cancer treatment. According to the reported results, the frequent random positions with different electrode settings indicated that the probability of undertreatment could occur frequently in hepatic IRE treatments. These undertreatment regions correspond to areas where the applied electric field is potentially sublethal. Therefore, caution is advised due to the possibility of these undertreated volumes to become new tumor nodules. This risk could be minimized by replacing blood in the liver vasculature, or by diluting it, with isotonic low conductivity liquids.
Footnotes
Acknowledgments
The authors would like to thank the Korea Institute of Science and Technology Information (KISTI) for their assistance in providing us with the anatomical geometry.
Declaration of Conflicting Interests
The author(s) declared no potential conflicts of interest with respect to the research, authorship, and/or publication of this article.
Funding
The author(s) disclosed receipt of the following financial support for the research, authorship, and/or publication of this article: This work received financial support from the Spanish Government through grants TEC2010-17285, TEC2011-27133-C02, and TEC2014-52383-C3 (TEC2014-52383-C3-2) and from the European Commission through the Marie Curie IRG grant “TAMIVIVE” 256376.
Supplemental Material
Supplementary material for this article is available online.
Abbreviations
References
Supplementary Material
Please find the following supplemental material available below.
For Open Access articles published under a Creative Commons License, all supplemental material carries the same license as the article it is associated with.
For non-Open Access articles published, all supplemental material carries a non-exclusive license, and permission requests for re-use of supplemental material or any part of supplemental material shall be sent directly to the copyright owner as specified in the copyright notice associated with the article.