
Abstract
The present study investigates how computed tomography perfusion scans and magnetic resonance imaging correlates with the histopathological alterations in renal tissue after cryoablation. A total of 15 pigs were subjected to laparoscopic-assisted cryoablation on both kidneys. After intervention, each animal was randomized to a postoperative follow-up period of 1, 2, or 4 weeks, after which computed tomography perfusion and magnetic resonance imaging scans were performed. Immediately after imaging, open bilateral nephrectomy was performed allowing for histopathological examination of the cryolesions. On computed tomography perfusion and magnetic resonance imaging examinations, rim enhancement was observed in the transition zone of the cryolesion 1week after laparoscopic-assisted cryoablation. This rim enhancement was found to subside after 2 and 4 weeks of follow-up, which was consistent with the microscopic examinations revealing of fibrotic scar tissue formation in the peripheral zone of the cryolesion. On T2 magnetic resonance imaging sequences, a thin hypointense rim surrounded the cryolesion, separating it from the adjacent renal parenchyma. Microscopic examinations revealed hemorrhage and later hemosiderin located in the peripheral zone. No nodular or diffuse contrast enhancement was found in the central zone of the cryolesions at any follow-up stage on neither computed tomography perfusion nor magnetic resonance imaging. On microscopic examinations, the central zone was found to consist of coagulative necrosis 1 week after laparoscopic-assisted cryoablation, which was partially replaced by fibrotic scar tissue 4 weeks following laparoscopic-assisted cryoablation. Both computed tomography perfusion and magnetic resonance imaging found the renal collecting system to be involved at all 3 stages of follow-up, but on microscopic examination, the urothelium was found to be intact in all cases. In conclusion, cryoablation effectively destroyed renal parenchyma, leaving the urothelium intact. Both computed tomography perfusion and magnetic resonance imaging reflect the microscopic findings but with some differences, especially regarding the peripheral zone. Magnetic resonance imaging seems an attractive modality for early postoperative follow-up.
Introduction
Partial nephrectomy is the recommended modality for treating small renal masses (SRMs) owing to robust oncological outcomes, preservation of the renal function, and a high cancer-specific survival. 1 During the past decade, ablative techniques have proved effective in selected patients in whom the modality has the potential benefits of low complication rates, decreased morbidity, and good oncological outcomes. 2 –4 However, in contrast to partial nephrectomy, cryoablation leaves no specimen for postoperative confirmation of the surgical margin, making the modality strongly dependent on follow-up imaging. Although postoperative contrast enhancement of a cryolesion can be a disturbingly and suspicious finding, it does not necessarily equal treatment failure. 5 –7 The mechanisms giving rise to contrast enhancement following renal cryoablation are not fully understood, and only a limited number of studies have systematically correlated imaging with histology. 8 –10
In the present study, we systematically investigated and in a descriptive manner correlated computed tomography perfusion (CT-p) and magnetic resonance imaging (MRI) characteristics of renal cryolesions to the underlying histopathological findings up to 1 month following laparoscopic-assisted cryoablation in a pig model.
Materials and Methods
The present study was conducted at Department of Urology and Clinical Medicine, Aarhus University and was approved by the Danish Authority on Animal Experiments (registry number: 2013-15-2934-00778). The Animal Research: Reporting of In Vivo Experiments guidelines on reporting animal experiments were adhered to. 11 All pigs were female Danish Landrace pigs weighing approximately 40 kg and being approximately 100 days old. All pigs were kept for 1 week at a certified research pigsty for acclamation and optimization of bowl function prior to surgery. Bilateral renal cryoablation was performed on all pigs after which they were returned to the pigsty facilities. The pigs were randomized into 3 groups and postoperatively kept in the pigsty for 1, 2, or 4 weeks, respectively, after which time each pig underwent a CT-p and MRI scans prior to an open, bilateral nephrectomy. Computed tomography perfusion was always performed prior to MRI. All pigs were humanely euthanized using an overdose of pentobarbital after nephrectomy.
Anesthesia and Postoperative Care
Preanesthesia medication consisted of 2 mL Penovet Vet (300.000 IU/mL), 4 mL Stresnil (40 mg/mL), 4 mL Dormicum Vet (5 mg/mL), and 10 mL Hypnomidate (2 mg/mL). During surgery, animals were under general anesthesia using Propofol 15 mL/h and kept pain free with an infusion of 10 mL/h Fentanyl (50 mg/mL). At each laparoscopic port site, 2.5 mL of Bupivacaine (5 mg/mL) was injected. A dose of 750 mg Cefuroxime was given both pre- and postoperatively, and an injection of 2 mL Finadyne (50 mg/mL) was administrated after surgery as well.
Postoperative pain management consisted of Finadyne paste (50 mg/g) for the first 4 days after surgery. The pigs’ well-being was systematically monitored and registered by means of a score chart for the first 5 days and thereafter by daily interactions with the animal caretakers.
Cryoablation Procedure
Using a standard 12 mm Hg CO2 pressure and 3-port laparoscopic approach, the kidneys were identified and mobilized allowing an intra-abdominal, ultrasound-guided cryoprobe placement (Analogic BK 4-Way Laparoscopic 8666-RF; Peabody, Massachusetts). One IceSphere 17-gauge cryoprobe (Galil Medical, Arden Hills, Minnesota) was inserted to a depth of 30 mm at the lateral rim of the kidney to a distance of 5 cm from the top of the upper pole. A multipoint 17-gauge Thermal Sensor (Galil Medical) was placed parallel with the cryoprobe at a distance of 10 mm. Cryoablation was delivered using the Visual-ICE System (Galil Medical) with argon gas for freezing and helium gas for thawing. The cryoablation consisted of a standard double-freeze cycle with 10 minutes of freezing followed by 6 minutes of passive thaw and then 2 minutes active thaw. The same procedure was performed on the contralateral kidney.
Computed Tomography Perfusion and MRI Imaging
All CT-p examinations were performed using a 320-detector row CT-scanner (Aquilion ONE, Toshiba Medical Systems, Otawara, Japan). A total dose of 30 mL Optiray 350 (ioversol; Covidien, Mansfield, Massachusetts) was used as contrast agent for intravenous injection. The CT-p scan protocol consisted of 19 consecutive 4D volumes. Scan time was 49 seconds. Scan parameters were set to 100 kV, 150 mA, and pitch 0.5. Images were routinely reconstructed with 0.625-mm soft algorithm axial plane and reformatted in orthogonal planes (axial, sagittal, and coronal). The reconstructed data sets were postprocessed on a stand-alone workstation (Vitrea 6.3, Vital Images, Toshiba Medical Systems, Minnetonka, Minnesota). For analysis, the input artery was selected by placing a 100-mm2 circular region of interest (ROI) in the center of the abdominal aorta and a second ROI in normal renal parenchyma. Parametric perfusion maps were generated with the following perfusion parameters—arterial flow (tissue perfusion measured in mL* min−1*100 g−1), blood volume (measured in mL*100 g−1), and permeability (measured as ktrans in mL*min−1*100 g−1). The CT-p examinations were evaluated by an experienced board-certified senior uroradiologist with more than 10 years of experience. The CT-radiologist was blinded to the length of the follow-up.
The MRI examination of the renal parenchyma involved a respiration-triggered examination of the pigs in the supine position on a 3-T magnet (Siemens Magnetom Skyra, Siemens, Erlangen, Germany) and a body coil with 18 channels. Three sequences were performed before intravenous contrast was administered—axial 4 mm T2 turbo spin echo (TSE), axial 5 mm T1 gradient echo sequence with fat saturation (FS), and coronal 4 mm T2 TSE. Intravenous contrast, Dotarem (gadoterate meglumine, 279.3 mg/mL; Guerbet, France), was administered at 0.2 mL/kg body weight, and a nondynamic postcontrast 4-mm coronal T1 TSE sequence with FS was undertaken (T1FS + gadoterate meglumine contrast agent [Gd]). A board-certified senior radiologist with 8 years experience in body MRI evaluated the images. The MRI radiologist was blinded to the length of the follow-up.
Histopathology
A section was cut through the center of the cryolesion in order to obtain optimal fixation. After fixation in standard 10% buffered formalin, the tissue containing the cryolesions and the surrounding normal renal parenchyma was cut in 4-mm thick sections and dehydrated in a Tissue-Tek VIP tissue processor (Nagano, Japan). Following dehydration, the tissue was embedded in paraffin and cut at 2 to 3 μm and stained with hematoxylin and eosin, Masson trichrome (MT), pan-cytokeratin (AE1/AE3PCK26, in a Ventana XT immunostainer), and Prussian blue (PB). Histological examinations were performed by an experienced pathologist with more than 35 years of experience in genitourinary pathology. The pathologist was blinded to the length of the follow-up.
Results
No peri- or postoperative complications were observed, thus no pigs were excluded from the study. Table 1 lists CT-p, MRI, and pathological findings for each of the 3 follow-up stages subdivided into cryolesion zones.
CT-p, MRI, and Histological Findings Following Cryoablation.
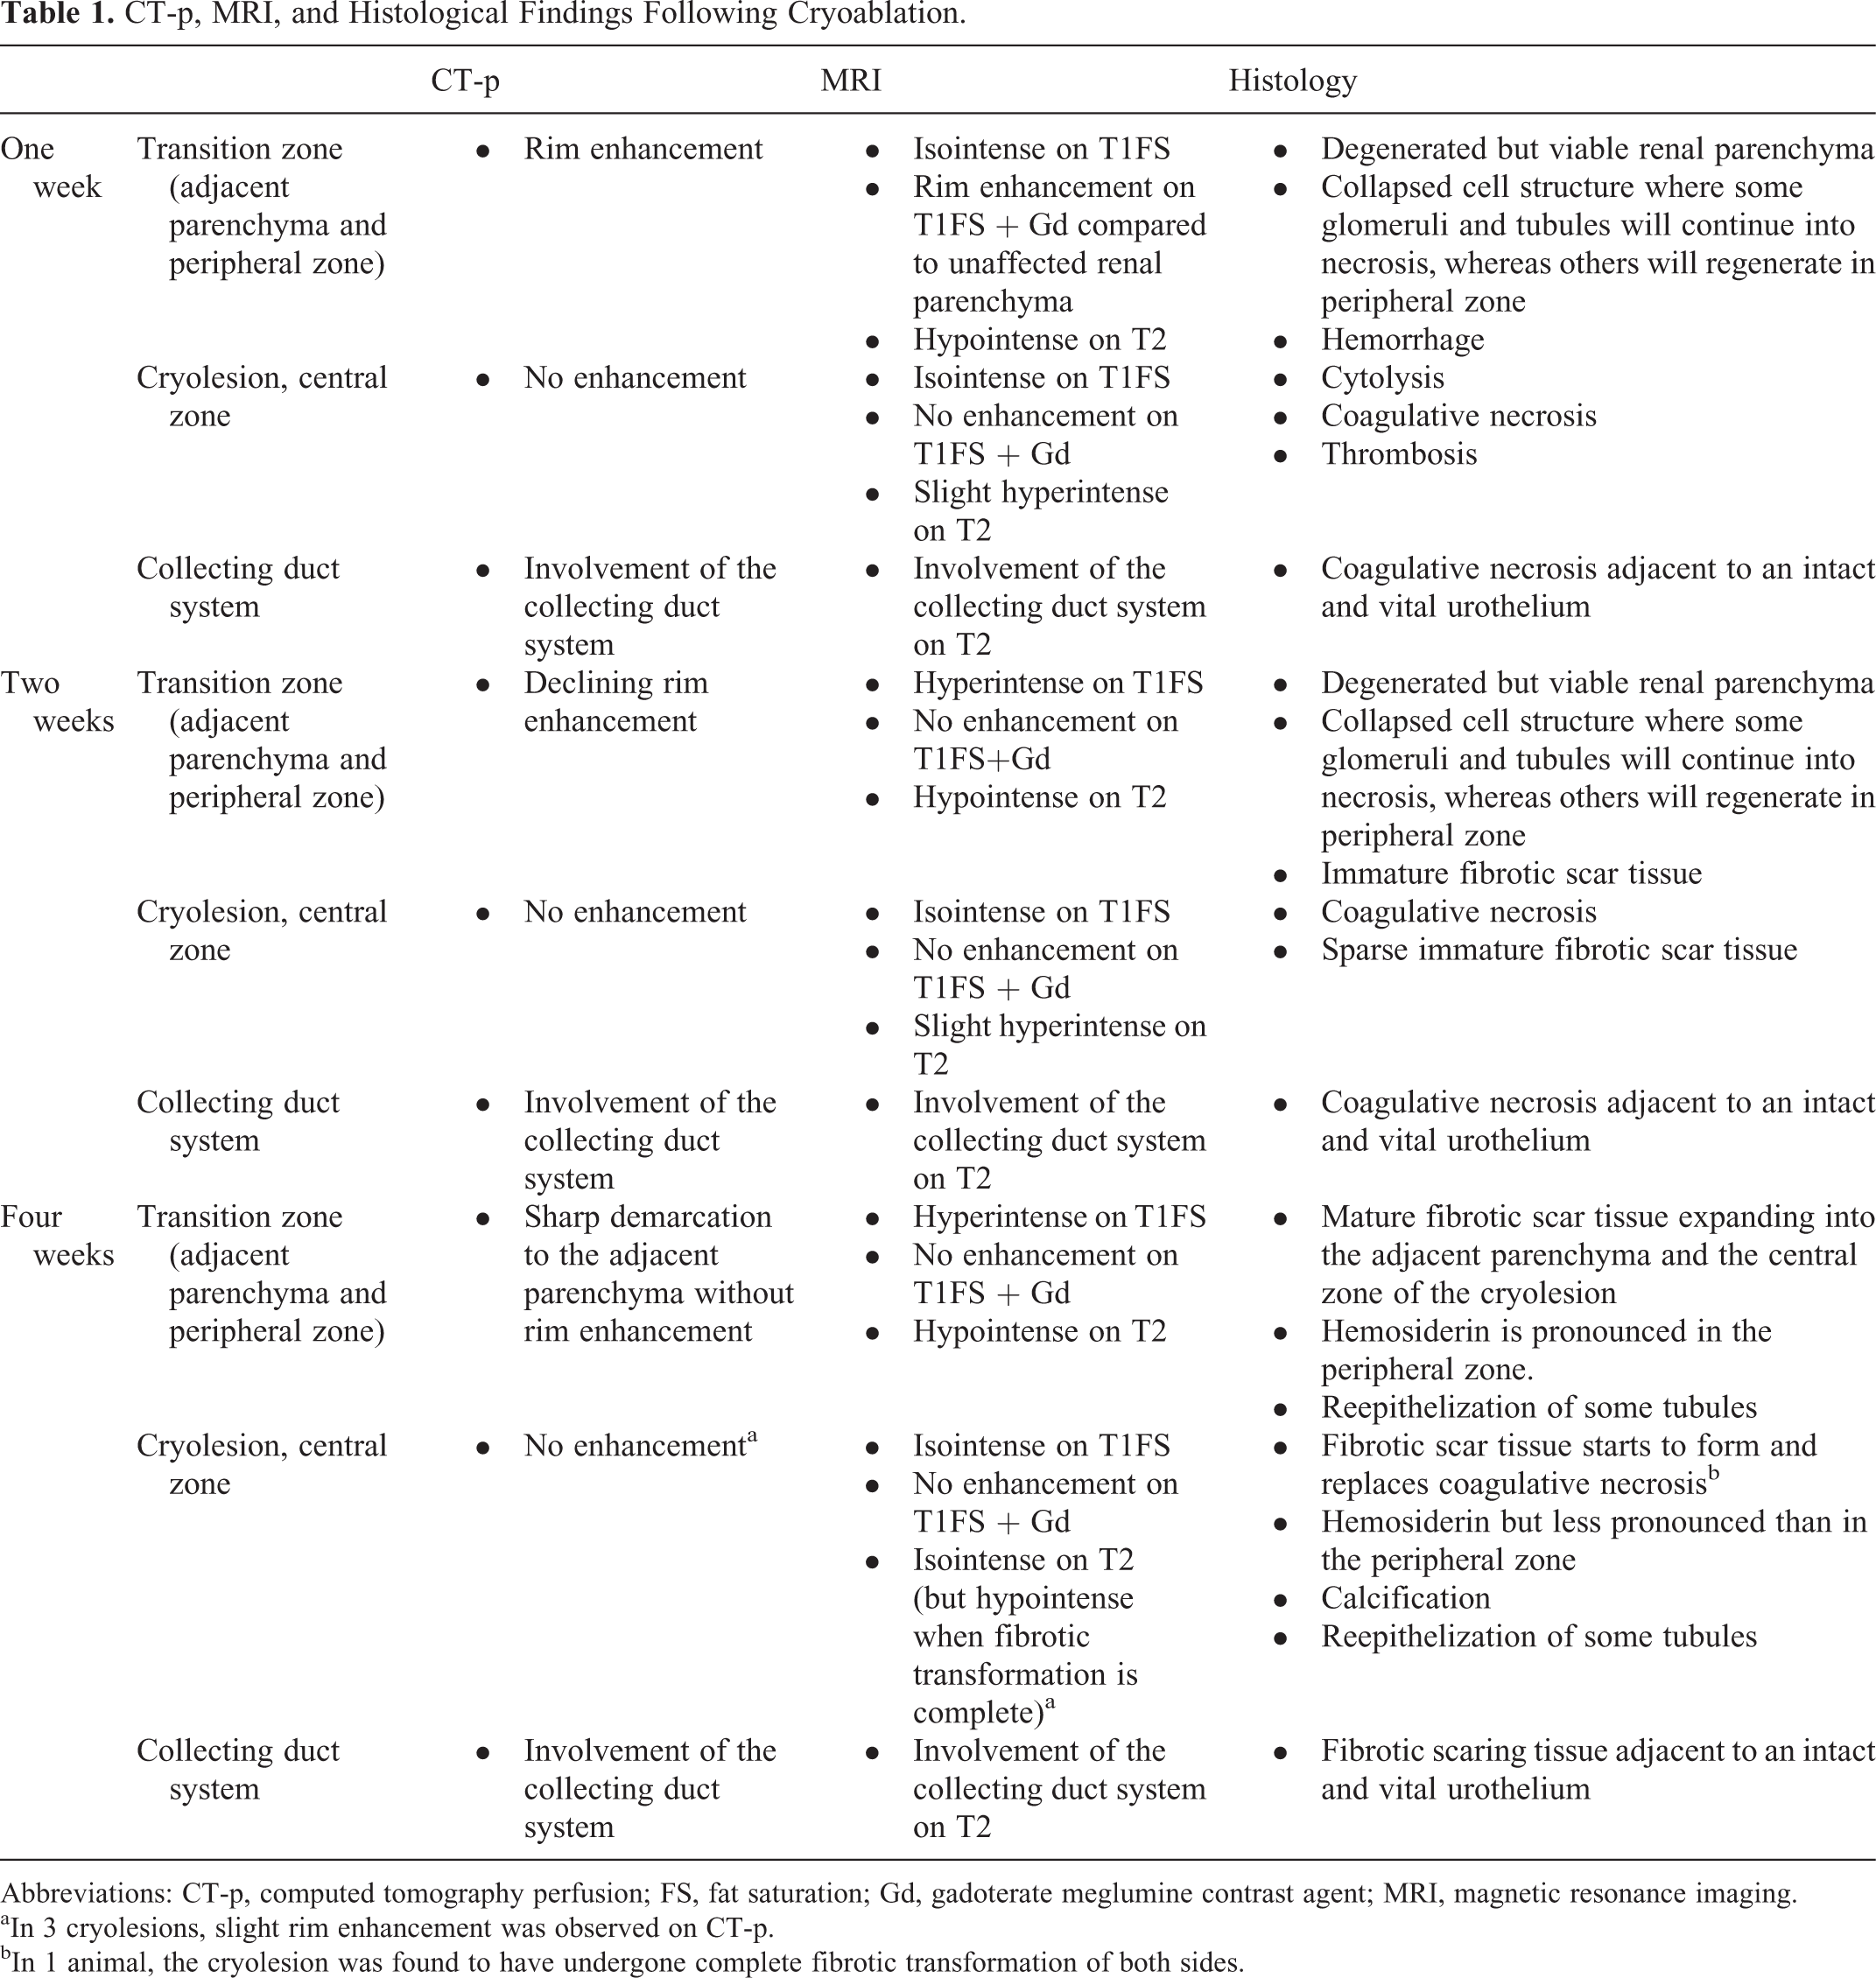
Abbreviations: CT-p, computed tomography perfusion; FS, fat saturation; Gd, gadoterate meglumine contrast agent; MRI, magnetic resonance imaging.
aIn 3 cryolesions, slight rim enhancement was observed on CT-p.
bIn 1 animal, the cryolesion was found to have undergone complete fibrotic transformation of both sides.
Macroscopic Development
In the 1-week group, the cryolesions were sharply demarcated with edematous appearances and blood stasis. In the 2- and 4-week groups, the cryolesions retracted and the edematous appearance changed to a pale/fibrotic appearance (Figure 1).

Clinical photos immediately after nephrectomy. A, The cryolesion 1 week after laparoscopic-assisted cryoablation (LCA) with an edematous appearance and blood stasis. B, The cryolesion 2 weeks after LCA where it continues to appear slightly edematous but with fibrotic transformation starting in the transition zone. C, The cryolesion 4 weeks following LCA where the fibrotic transformation is almost complete and the cryolesion has reduced in size by approximately 25%.
Transition Zone (Adjacent Parenchyma and Peripheral Zone)
On CT-p examination, rim enhancement was found in the late part of the corticomedullary phase in the 1- and 2-week groups (Figure 2A and B). In the 4-week group, the cryolesions appeared sharply demarcated in relation to the adjacent parenchyma, and rim enhancement was no longer present in the majority of the cryolesions (n = 7 of 10; Figure 3A and B). In the remaining 3 cases, rim enhancement was still present, however, less prominent than in the 1-week group. On T1FS + Gd images, rim enhancement was found surrounding the hypointense cryolesion in the 1-week group (Figure 2C). Rim enhancement was still present, however, less prominent in the 2-week group and was no longer present in the 4-week group. On T2 images, a hyperintense signal was seen in the adjacent parenchyma in the 1-week group, indicating edema (Figure 2D). This signal was less prominent in the 2-week group and no longer present in the 4-week group. Furthermore, on T2 images, a hypointense area was found separating the cryolesion from the adjacent parenchyma at all 3 stages of follow-up, indicating hemorrhage in the transition zone (Figure 2D). In the 2-week group, and less pronounced in the 4-week group, a hyperintense signal at the precontrast T1FS, and with no changes after contrast administration (T1FS + Gd), was seen central to the hypointense area, indicating hemorrhagic components rather than contrast enhancement.
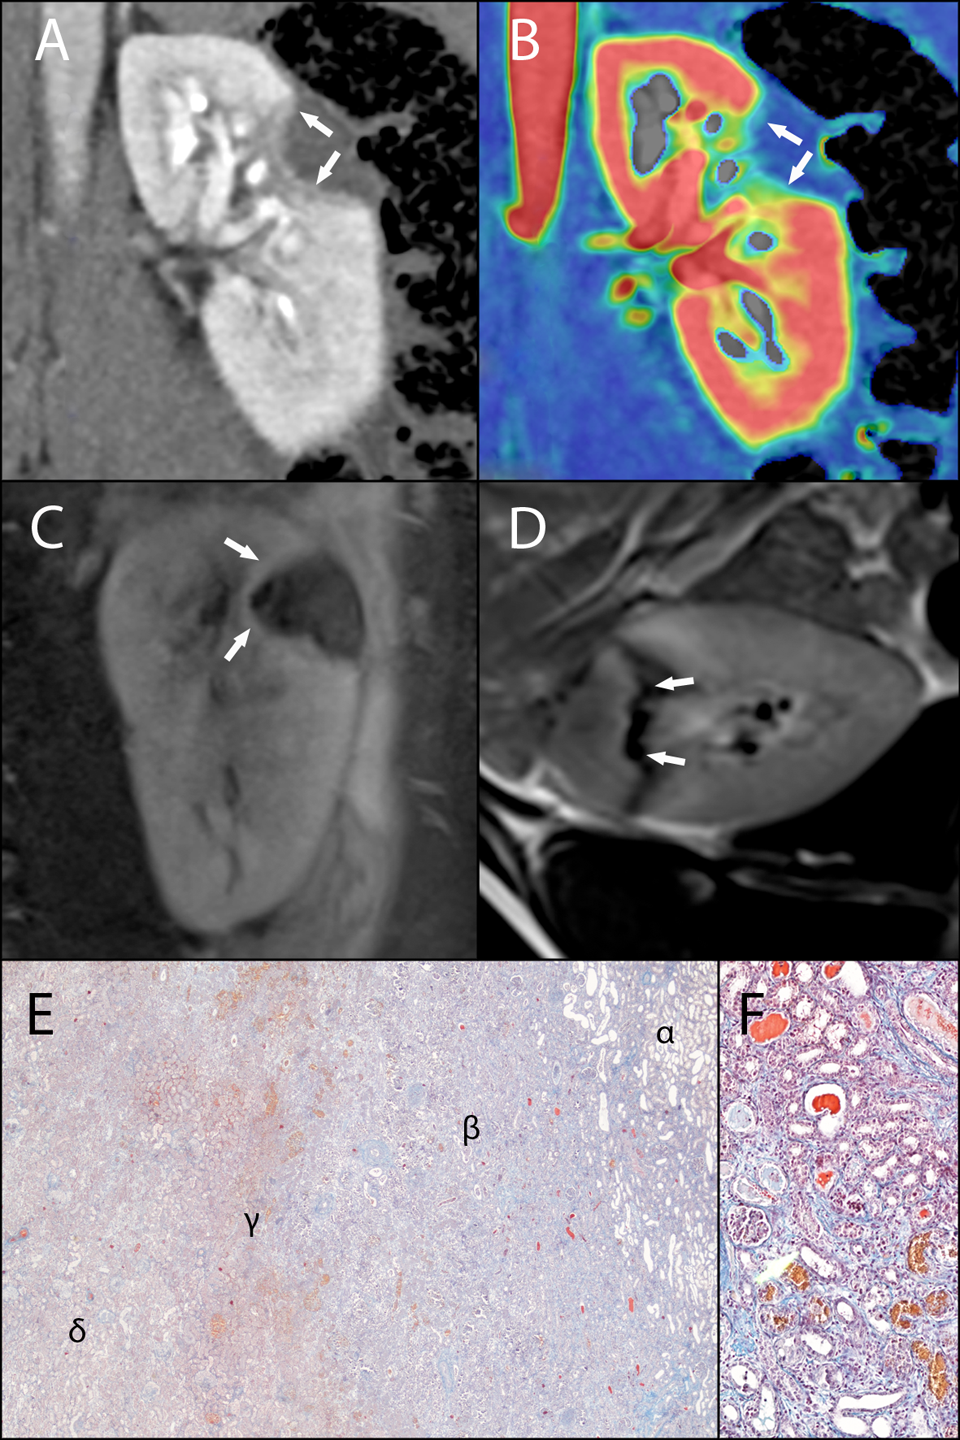
Computed tomography perfusion (CT-p), magnetic resonance imaging (MRI), and histology images 1 week after laparoscopic-assisted cryoablation (LCA). A and B, The (CT-p) images in the corticomedullary phase with rim enhancement in the transition zone. No contrast enhancement is seen in the central zone of the cryolesion. C, Rim enhancement at the transition zone on a contrast-enhanced T1 weighted MRI image with fat saturation. No contrast enhancement is seen in the central zone. D, a T2-weighted MRI image with a hypointense area at the transition zone that encircles the central zone. E, The transition zone (×20, Masson trichrome [MT]) with degenerated but viable renal parenchyma (α) and the peripheral zone with fibrotic scar tissue (β) and hemorrhage (γ) encircling the central zone with coagulative necrosis (δ). F, The peripheral zone (×100, MT) with a collapsed cell structure where some glomeruli and tubules will continue into necrosis, whereas others will regenerate (F).

Computed tomography perfusion (CT-p), magnetic resonance imaging (MRI), and histology images 4 weeks after treatment. A and B, CT-p images in the corticomedullary phase illustrating a sharp demarcation of the cryolesion without rim enhancement. C, A contrast-enhanced T1-weighted MRI image with fat saturation giving the impression of late contrast enhancement in the cryolesion, but a prior noncontrast-enhanced T1-weighted image with fat saturation shows hyperintensity in the same location (small picture). D, The transition zone (×40, pan-cytokeratin [PCK]) with arrows pointing at viable tubules with reepithelization. E, The transition zone (×100, Prussian blue [PB]) with hemosiderin located in the peripheral zone. F, An intact urothelium toward the renal collecting duct system enclosed by fibrotic tissue (×20, Masson trichrome [MT]).
The different layers of the transition zone were clearly evident on microscopic examination (Figure 2E). A slightly degenerated but viable renal parenchyma was found in the 1- and 2-week groups. In the 4-week group, fibrotic scar tissue was seen infiltrating the adjacent parenchyma surrounding the cryolesion. Furthermore, an area (the peripheral zone) was seen with a distinct structure of collapsed cells where some tubules and glomeruli will continue into necrosis, whereas others will regenerate (Figure 2F). A narrow area of hemorrhage marked the transition from the peripheral zone of collapsed cells to the central zone of the cryolesion. In the 2-week group, the peripheral zone was dominated by fibrotic scar tissue, separating the cryolesion from the adjacent parenchyma. In the 4-week group, the peripheral zone was seen merging with the central zone as fibrotic scar tissues started to replace the coagulative necrosis. Prussian blue revealed hemosiderin accumulated in the peripheral zone in the 2 and 4-week groups (Figure 3E). In the 2-week group, much of the hemosiderin was interstitial, whereas much of the iron was resorbed into macrophages in the 4-week group. Pan-cytokeratin staining indicated reepithelization of some tubules as viable looking epithelium was seen in some tubules in peripheral zone and outer rim of the central zone in the 4-week group (Figure 3D).
Cryolesion Central Zone
No nodular or diffuse contrast enhancement was found in the central zone of the cryolesions at any follow-up stage on neither CT-p nor MRI. On T2 images, the central zone was found to be slightly hyperintense in the 1- and 2-week groups, indicating residual hemorrhagic components. In the 4-week group, the cryolesion appeared isointense, except for 1 pig in which the cryolesions were found to appear hypointense—being consistent with histology showing complete fibrotic transformation.
On microscopic examination, the outline of the cells was found to be preserved but with a ghostly appearance compatible with coagulative necrosis in the 1-week group. In the 2-week group, coagulative necrosis was still predominant, but fibroblasts had migrated into the central zone and sparse immature fibrotic scar tissue was starting to develop. In the 4-week group, fibrotic scar tissue was more pronounced but still areas with coagulative necrosis was present, except in 1 pig where the entire cryolesion had become fibrotic. Prussian blue revealed hemosiderin accumulated in outer rim of the central zone in the 4-week group (Figure 3E).
Renal Collecting System
On both CT-p and MRI examination, the renal collecting system appeared to be involved in the cryolesions at all 3 stages of follow-up. On microscopic examination, all cryolesions were found to extend to the collecting system as either coagulative necrosis or fibrotic scar tissue. The urothelium was found to be unaffected and intact in all cases, even though coagulative necrosis or fibrotic tissue enclosed the urothelium (Figure 3F).
Discussion
This is the first study applying both CT-p and 3-T MRI for simultaneous investigation on how these modalities reflect the in vivo histological development of renal parenchyma up to 4 weeks after cryoablation. The strength of an in vivo model with respect to ablative studies is that normal blood circulation in the organ ensures naturally occurring inflammatory and regenerative processes.
Cryoablation is a well-established treatment modality in patients with SRMs who are unfit for more extensive surgery. The modality offers good oncological control with the advantage of low complication rates. 4,12,13 Currently, the point in time at which complete ablation of the tumor should be defined has not yet been established but consensus seems to be gathering for 1 to 3 months after treatment. 14 Furthermore, a correct understanding and interpretation of the early postprocedural images remain essential to the credibility of cryoablation. Renal cryoablation has been studied in various models, and both the cellular response to freezing and zonal development of the cryolesion are well described. 9,15 –18 However, the majority of such studies have been limited to the investigation of the acute tissue response and to a much lesser extent the clinically important correlation with follow-up imaging.
A large animal model with solid tumors would be very beneficial in a wide range of surgical studies, including ablative research. However, most animal models with solid tumors are based on rodents, especially genetically engineered mice. Mice differ significantly from humans in size, physiology, and anatomy, limiting their usefulness in many surgical studies. The larger size of the pig and its similarity in anatomy, physiology, metabolism, and genetics to humans makes it an ideal model organism. Pigs, like humans, also require multiple genetic alterations to develop cancer and no model encompassing all these factors is presently commercially available. 19 Despite not having a solid renal mass, the pig was found to be the most ideal model organism for use in the present study, owing to the anatomy of the kidney with true calices and a high degree of resembles regarding the vascular system. 20 –22 Furthermore, utilizing the same clinical equipment as in patient management was prioritized.
On MRI, all cryolesions were clearly distinguishable from the adjacent renal parenchyma at all stages of follow-up by a 1- to 2-mm hypointense area on T2 images. In clinical studies, this hypointense area is observed in the majority of cases at early follow-up but has been found to disappear on more long-term follow-up. It has been argued that this hypointense zone is likely to represent the sublethal peripheral zone where some cells will regenerate, whereas others will continue into necrosis. 10,23 In this study, the peripheral zone was clearly visible on MT-stained histology specimens. Hemorrhage was seen in this part of the transformation zone in the 1-week group, and PB specimens revealed hemosiderin located throughout the peripheral zone and the outer rim of the central zone in the 4-week group. These findings support the hypothesis that the hypointense signal seen on T2 images represents various stages of hemoglobin degeneration ending with hemosiderin.
In the present study, rim enhancement was found in the transition zone on CT-p as well as contrast-enhanced MRI. The exact location of the contrast media causing the rim enhancement is difficult to pinpoint, but the findings in this study suggest that it may occur in the outer rim of the peripheral zone. Intact blood vessels were found in this area in the 1-week group, in which rim enhancement was seen. Furthermore, rim enhancement was found to subside in the 2 and 4-week groups, in which fibrotic scar tissue became predominant. Previous clinical studies have also reported persistent rim enhancement on both CT and MRI in relation to tumor treatment. In contrast to nodular enhancement, which is highly suspicious for residual or recurrent tumor, rim enhancement has been observed to persist for several months before subsiding. 5 –7,24
With respect to ablative treatment, imaging modalities are limited by resolution and uncertainty of the viability of cells within the peripheral zone, thus increasing the risk of over- and underreporting the true extent of disease control. 7,25,26 Computed tomography offers good spatial resolution (ability to distinguish 2 structures a small distance apart as separate) whereas MRI offers a comparable spatial resolution but with a far better contrast resolution for soft tissues (ability to distinguish the differences between 2 similar but not identical tissues, that is, distinguish between differences in signal intensity in an image). The superiority of MRI with respect to soft tissue contrast resolution was clearly demonstrated in this study, portraying the zonal structure of the cryolesion, making MRI an attractive modality for early postoperative follow-up.
The effects of cryoablation on the renal collecting system have only rarely been studied. 27,28 In addition, the majority of studies reporting on outcomes and complications following renal cryoablation have generally not included detailed information regarding tumor location, thus it remains unclear whether tumors in the vicinity of the collecting system are safe to treat using cryoablation. In the present study, follow-up imaging found the collection system to be involved in all cryolesions but found no indication of postoperative urinoma or fistula formation. This was consistent with no pigs having any signs of postoperative complications. On microscopic examination, coagulative necrosis and fibrotic tissue formation were found to extend to the collecting system but with a vital and intact urothelium separating the cryolesion from the collecting system. This indicates that the urothelium and underlying supportive connective tissue are likely to have a higher threshold to thermal injury compared to renal parenchyma and that cryoablation of central and endophytic located tumors is feasible.
In this study, the central zone of the cryolesion was found to consist of coagulative necrosis that was gradually being replaced with fibrotic tissue during the 4-week follow-up period. On imaging, the central zone of the cryolesion was found to be without perfusion on CT-p as well as MRI. Additionally, as described in other studies, the current study found the central zone to appear slightly hyperintense in the 1-week group after which it became iso-hypointense on T2 as fibrotic tissue formed. 10,29
This study has several limitations. The most significant limitation being that the present animal model is a nontumor model, thus limiting the direct transferability of the results to clinical practice. However, in clinical practice an ablative margin of 5 to 10 mm normal renal tissue is often desirable, which can be studied particularly well in this normal renal parenchyma model. In addition, it would be of great interest if a group of pigs were followed for an even longer period of time (eg, 3 months), allowing for investigation of the final stages of parenchyma regeneration and the corresponding imaging. Also, imaging all pigs at each follow-up stage would have allowed for a more precise investigation of the cryolesion development over time but would also have excluded the possibility for direct histological correlation.
Conclusion
Cryoablation effectively destroys renal parenchyma, leaving the urothelium intact in this in vivo model. Both CT-p and MRI reflect histology findings but with some differences between the 2 modalities, especially regarding the peripheral zone. Magnetic resonance imaging seems an attractive modality for early postoperative follow-up owing to a detailed demarcated ablative margin toward the renal parenchyma.
Footnotes
Abbreviations
Acknowledgments
The authors thank BK Medical for providing the necessary cryoprobes and Covidien for providing disposable laparoscopic equipment. The participating medical students for their dedicated assistance during surgery. Susanne Munk and Jesper Rosenstrøm Laursen from the Department of Radiology for developing the CT-p protocol. Margit Haislund, Helle Gloggengiesser Darø, and Ole Christiansen from the Department of MRI for developing the MRI protocols. The animal caretakers at Påskehøjgaard for providing the pigs. Gitte Kragh for a comprehensive language revision of the manuscript.
Declaration of Conflicting Interests
The author(s) declared no potential conflicts of interest with respect to the research, authorship, and/or publication of this article.
Funding
The author(s) disclosed receipt of the following financial support for the research, authorship, and/or publication of this article: The first author has conducted the research supported by a grant from The Danish Cancer Society. In addition, the project has been supported by Karen Elise Jensen Fonden, Emil C. Hertz Fonden, and A.P. Møller Fonden.