
Abstract
Irreversible electroporation has clinically been used to treat various types of cancer. A plan on how to apply irreversible electroporation before practicing is very important to increase the ablation area and reduce the side effects. Several electrical models have been developed to predict the ablation area with applied electric energy. In this experiment, the static relationship between applied electric energy and ablated area was mathematically and experimentally investigated at 10 hours after applying irreversible electroporation. We performed the irreversible electroporation on the liver tissue of Sprague Dawley rats (male, 8 weeks, weighing 250-350 g). The ablated area was measured based on histological analysis and compared with the mathematical calculation from the electric energy, assuming that the tissue is homogeneous. The ablated area increased with the increase in applied electric energy. The numerically calculated contour lines of electric energy density overlapped well with the apoptotic area induced by the irreversible electroporation. The overlapped area clearly showed that the destructive threshold of apoptosis between electrodes is electric energy density level of 5.9 × 10⁵ J/m3. The results of the present study suggested that the clinical results of the irreversible electroporation on a liver tissue could be predicted through mathematical calculation.
Keywords
Introduction
Irreversible electroporation (IRE) has been used to treat various types of cancer clinically. 1 –6 The IRE is conducted through electrodes to deliver electrical energy that consists of a series of short-duration and high-intensity electrical pulses. The high-intensive electric energy produces irreversible structural changes in the cell membrane, which causes cells to undergo apoptotic pathways and consequently necrotic cell death. 7,8 This nonthermal mechanism of IRE is a big advantage, as compared to thermal ablation such as radiofrequency ablation, because the major blood vessel and nerve architecture as well as the extracellular matrix are preserved during IRE. 9 –13 This enables IRE-induced lesions to be rapidly healed within 2 weeks after treatment. 14 This also enables a surgeon to apply IRE to complicated pancreatic cancer. 1
Planning how to apply IRE is important before practicing. Simulations on the electric field distribution were used to correlate the experimental data with the aim to predict the ablation area with electric field strength to be applied. 9,10,15 The ablated area reportedly increases with the applied electric field strength, characterizing the threshold of IRE in accompanied conductivity increase in applied tissue. However, these simulations have limitations to reflect significant parameters including applied electric energy. To overcome the complex geometry of targeted tissue, Bergues Pupo et al, Dev et al, and Čorović et al have used an array of needle electrodes 16 –18 or point current source 19 for the electric fields. The mathematical models are in good agreement with the region of ablated tissue measured from histology of liver tissue. 20 However, there has been no report of histological and mathematical matching based on the electric energy in real tissue analysis.
In this study, we introduced the formula to express analytical electric energy and compared it to experimental results. Most studies assumed that the radius of electrodes was negligibly small, as compared to the distance between the electrodes, 17 however, the exact electric field can be calculated. 21 We performed the IRE on the liver tissue, measured the ablated area based on histological analysis, and compared it with the mathematical calculation from the electric energy assuming that the tissue is homogeneous. We focused on the static relationship between electric energy and the physiological response of targeted tissue mathematically and analytically at 10 hours after treating of IRE when apoptosis in IRE-applied tissue is severe. 22
Materials and Methods
Analytic Modeling of the Ablation Area
We developed a model that can predict the area of tissue to be ablated or damaged from apoptosis by electroporation to provide guidance during the electroporation experiment. The model considers time dependence of the critical electric field of ablation based on the concept of applied electric energy. The criterion of the ablation is that the local electric field strength exceeds a critical value. 23 –26 Assuming the time-independent electrical conductivity of tissue, 8 this criterion results in a time-independent ablation area. However, in an experiment, the ablated area increases as the time of electric shock increases, and this has been empirically modeled by a reduction in the critical electric field over time. 27 The reduction is empirical and needs further clarification. In our modeling, we assumed that the reduction in the critical electric field originates from the applied electric energy, which is closely related to the electric field but increases over time. The energy is a function of electric field and time. At a constant time, the applied electric energy is a representation of the electric field, and so the criterion of critical electric field and its energy are the same. Our model thus reproduces previous research 23 –26 for constant time. As the time increases, the electric energy also increases. The applied electric energy is assumed to irreversibly cause pores in cell membrane and apoptosis. 23 In other words, we use the criterion of the critical electric field that reduces over time, and the reduction behavior is determined by the applied electric energy. This behavior applies to a certain range of the time and the field strength near experimentally used values. This is because an infinitely long time and an infinitely small electric field do not cause pore formation. In addition, the electric field criterion is a step function and predicts whether the ablation occurs. However, the criterion is statistical in the real situation 27 and was beyond the scope of this study.
The formulation of electric energy criterion is as follows. The electric power p per unit volume is E 2/ρ, where E is the electric field, and ρ is the resistivity of the tissue. The applied electric energy density w is p·t, where t is the time duration of the electric field application. Then

If w exceeds a critical value wc , then ablation occurs. To predict the ablation area, we need to know both t and E.
The electric field of the tissue is calculated with the following assumptions. Usually, the electrodes’ length is larger than the distance between the electrodes, and the effect of tissue surface can be neglected. So, we assumed a 2-dimensional problem with 2 cylindrical electrodes and zero potential at infinity. As a first approximation, the applied electric energy is cumulative. Hence, we solved the problem for an electric field time independently and considered the effect of time later.
The simplified electroporation problem has the analytic solution of electric field. The electric potential Φ (x, y) is obtained by solving the Laplace equation,
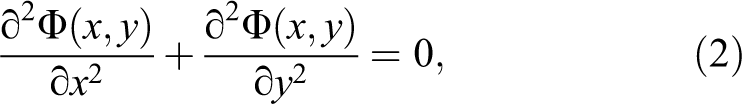
according to the boundary condition described above. We assumed the homogeneity of tissue, so that the dielectric constant did not enter the Equation 2. D is the distance between the centers of the electrodes, and a the radius of the electrodes (Figure 1A). The voltages of the left and right electrodes are V
0 and −V
0, respectively. The electric field of the parallel electrodes, or the conducting cylinders, is calculated using the method of image charges.
28
Let

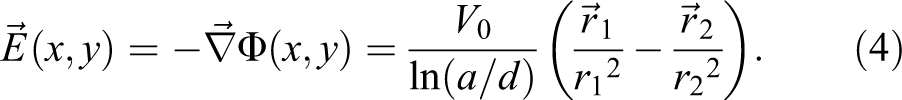
and the electric field is given by

The photo of the electrodes used in the experiment.
The solution of electric field, the applied voltage, and time duration of pulses gives applied electric energy density and ablation area. Let n be the number of the pulses, and Δt the time duration of the pulse. From Equation 1,

where,
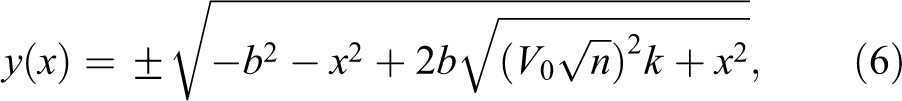
where, b = D/2 − di, and k = Δt/[ρwcln(a/d)] . The area of ablation is obtained by numerically integrating the area in the boundary using Mathematica software (Wolfram Research, Champaign, Illinois). The ablated area is determined by the geometry of the system (b, a/d) and the applied voltage and the time
In short, if we assume that the ablation occurs for the applied electric energy density larger than the critical value, then the areas of ablation for given applied voltages, V
0, and numbers of pulses, n, are the same for same
In Vivo Experimental Procedure
This study was approved by the Institutional Animal Care and Use Committee at the Seoul National University College of Medicine. Eight-week-old male Sprague Dawley rats weighing 250 to 350 g were used. All of the animals received humane care from properly trained professionals in compliance with the institutional guidelines of Seoul National University and current international laws and policies. The rats were maintained in a conventional animal colony and were adapted for a period of 2 weeks to provide relaxation before testing.
The animals were anesthetized with an intraperitoneal injection of 10 mg/kg Zoletil (Virbac, Carros, France) solution that was administrated throughout the procedure. A 15-mm midline abdominal incision was made under sterile conditions after shaving, and subsequently, the liver was entirely exposed. The electrodes fabricated with stainless steel wires with diameter of 100 μm, length of 5 mm, and center-to-center distance of average 2 mm (±0.16) were carefully inserted perpendicularly to the surface of liver to a depth of 5 mm (Figure 1). 22 Then, 8, 32, and 64 rectangular direct current pulses of 100 μs width were sequentially applied at a frequency of 1 Hz with applied voltages of 150, 350, and 500 V/cm, 22 which prevents heating around tissue near the electrodes because of higher dissipation of thermal energy as reported in a previous study, 22 using a pulse generator (Nano-porator; SolcoBiomedical Ltd, Co, Korea). As a result of simulation for temperature distribution, these electric conditions did not cause thermal damage to liver tissues. 22 A total of 36 rats were used. An IRE lesion was created per lobe of liver in rat, having a total of 3 lesions in a liver, to isolate the effect of electric pulses of neighboring lesions. The location of lesion was marked with tissue ink. 22 Subsequently, the abdominal wall was sutured, and the animals were kept alive until 10 hours at which time the applied tissues undergo severe apoptosis. 7,22 All animals were then checked every couple of hours to ensure that they recovered from surgery and stayed healthy without complications. The regions from the liver tissues that had been treated as well as the untreated regions distant to the lesions were harvested after 10 hours of IRE, and the animals were then euthanized. The liver segments were fixed in 10% (vol/vol) buffered formalin, dehydrated, embedded in paraffin, and then sectioned with a microtome with an axial cut through the plane normal to the direction of the electrode length, without decreasing the strength of the electric fields that were applied, as in the previous study. 22 Each sample was stained with hematoxylin and eosin (H&E) to assess the state of necrosis, and terminal deoxynucleotidyl transferase dUTP nick end labeling (TUNEL) assay kit (S7100; Millipore, Temecula, California) was used to assess apoptosis. Terminal deoxynucleotidyl transferase dUTP nick end labeling is a method for detecting DNA fragmentation that results from apoptotic signaling cascades by labeling the terminal end of nucleic acids.
The slides for the TUNEL assay were imaged with an image acquisition system (Olympus BX-51 with digital imaging system [Image-Pro plus 4.5]), and the area colored brown by TUNEL staining was then analyzed via Matlab to quantify the degree of apoptosis in the region of interest.
Results
Figure 2B shows the macroscopic images of H&E staining of liver tissue at 10 hours of IRE operation. In this case, the electrode diameter, the distance between the electrodes, the applied voltage, and the number of electric pulses were 0.1 mm, 1.0 mm, 1 kV, and 64 pulses, respectively. The H&E staining delineates the effects of IRE around the electrodes as expressed in a previous study. 22 The affected area includes the tissues surrounding the electrodes and between the electrodes. The lesions at the site of electrodes (the dotted circle “E”) become significantly injured, which is microscopically eosinophilia, as compared to the normal parenchyma. The eosinophilia is ascribed to the chromosomal shrinkage of cells and demolished collagen structures. The boundary between demolished and normal tissues is a congested zone, which may be ascribed to the regeneration process. The capillaries near the electrodes are preserved within the destructive tissue zone.
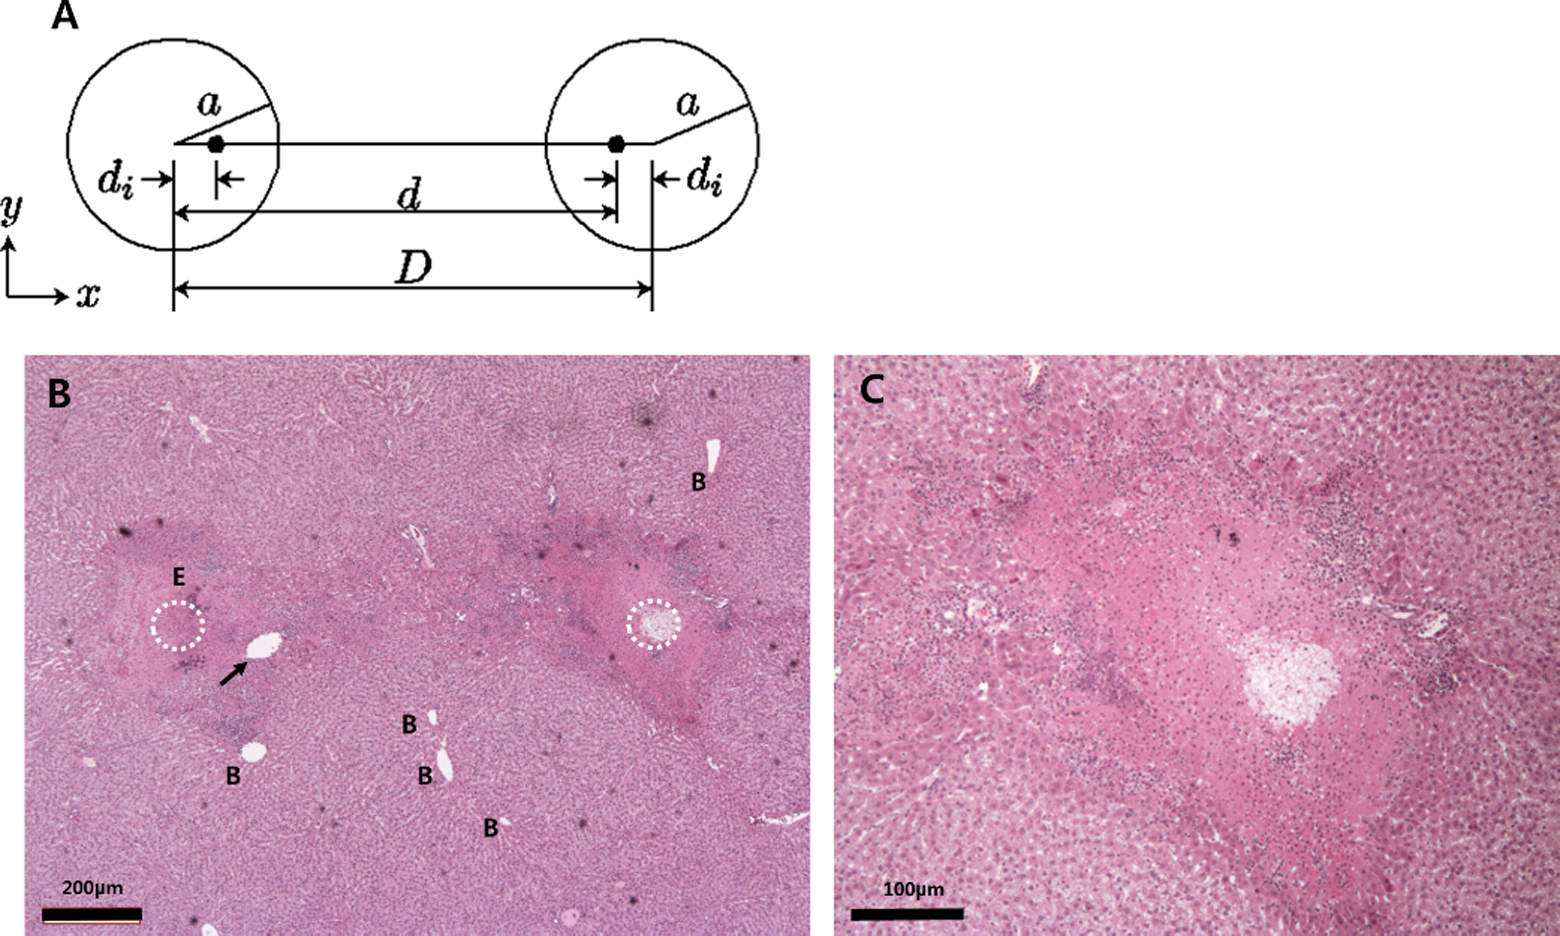
The geometry of the 2 electrodes and the macroscopic image of irreversible electroporation (IRE)-treated liver tissue with hematoxylin and eosin (H&E) staining at 10 hours post-IRE operation. A, “a” is the radius of an electrode, “D” is the distance between the centers of the electrodes, and “d” is the distance between the image charges. B, In this experiment, “a” is 0.1 mm, “D” is average 2.0 mm (±0.16), the applied voltage is 500 V, and the number of electric pulses is 64. The dotted circles (“E”) denote the positions of electrodes, and the arrows indicate the blood capillary that was preserved within destructed tissue. C, The image of the right side electrode “B.” Tissue around electrode has a distinct boundary with normal tissue and dense aggregation of many chromosomes due to destructive extracellular matrix, unlike normal morphology of tissue.
These phenomena were more apparent as a form of apoptosis in TUNEL assay. Figure 3 exhibits the apoptotic appearance at 10 hours after applying IRE, that is, brownish by TUNEL staining. As expected, these apoptotic areas tend to be more widened with applied electric energy. Low electric energy induces apoptosis only at the area surrounding the electrodes, regardless of anode or cathode. Apoptosis at the area between the electrodes seems to start with the applied electric energy of wc = 5.9 × 10⁵ J/m3, which should be an electrically critical point for entire destruction by electroporation. Figure 4 graphs the relationship between the apoptotic area and the applied electric energy. The apoptotic area increased almost linearly with rising applied voltages and applied pulsing numbers, that is, increasing with applied electric energy.

Typical macroscopic images of irreversible electroporation (IRE)-treated liver tissue with terminal deoxynucleotidyl transferase dUTP nick end labeling (TUNEL) assay. The normal tissue shows no staining, whereas the IRE-treated tissues show the pathological apoptosis near the electrodes. With increasing applied electric energy, the apoptotic ablation area is gradually widened. The critical applied electric energy is 5.9 × 10⁵ J/m3 for all the cases. All images were magnified to ×4.
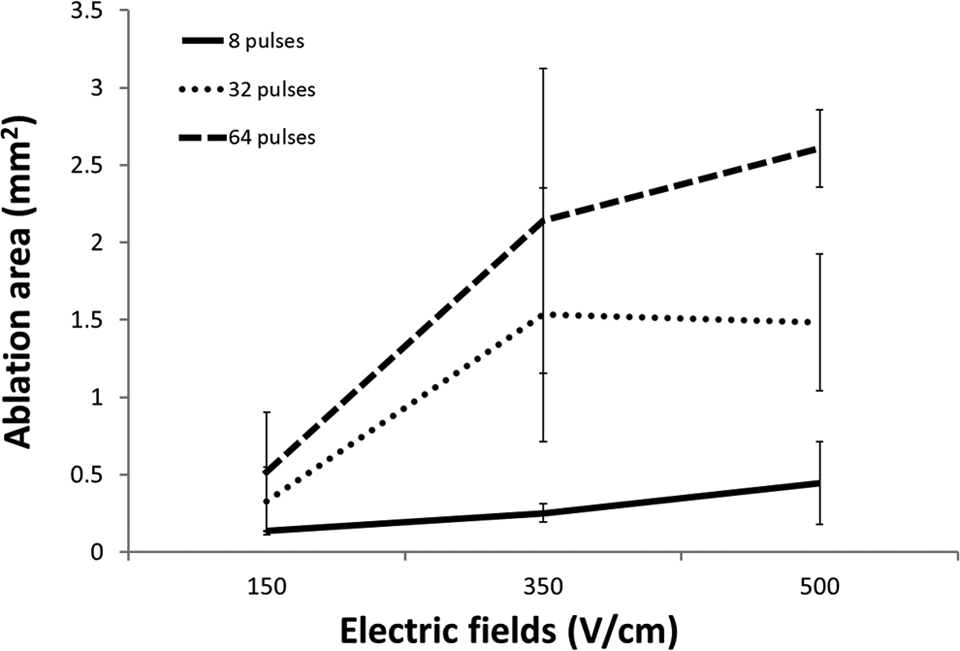
A graph for the ablation area. The tendency of apoptotic area is increasing with applied electric energy at 10 hours after irreversible electroporation (IRE).
Figure 5 shows the fitting of electrically injured area, as compared to mathematically calculated apoptotic areas. The calculation for their fitting was based on the electric energy, that is, applied voltages and pulsing numbers (total duration time). In Equation 6, the ablation area was calculated by the curve of points with the critical electric energy. In the curve equation, ρwc
is an unknown value that was found by fitting the experimental ablation area versus

The fitting of the ablation area obtained in the experiment to that produced by the theoretical model. The model explains the trend in the ablation against a measure of applied electric energy

The contours of the electric energy density and the shape of ablated tissue according to the fitted theoretical model. The contours are similar to those of the ablation area obtained in the experiment, indicating that the theoretical model explains the trends in the ablated area. The arrow indicates the boundary of the ablated tissue, and the numbers in the last figure are the strength of the electric field normalized to the critical electric energy density for an ablation of 64 pulses. In other tissues, where the arrows are not indicated, the boundary can be found by comparing colors with those in the last subfigure as arrows. ps indicates pulses.

The superposition of terminal deoxynucleotidyl transferase dUTP nick end labeling (TUNEL) assay with isoelectric energy density curves. The superposition clearly shows the consistency of the applied electric energy with the simulation, especially exhibiting that the entire destruction between electrodes starts at 5.9 × 10⁵ J/m3. The electric energy density above 5.9 × 10⁵ J/m3 causes the tissues to undergo apoptosis.
Discussion
As in previous reports, 7,22 the H&E staining showed a well-demarcated margin between the untreated and the treated regions with widespread pale eosinophilic cytoplasm, congestion in sinusoids, hemorrhage, pyknosis, karyorrhexis, and rupture of connective tissues in Figure 2. Some of the blood capillaries in the treated section were preserved without hemorrhage, which would contribute to a quick recovery of the tissues treated through microcirculation. Even though the sites of the electrodes are not exactly recognized, the loosened surrounding tissues indicate the location of the electrodes. The difference may be due to the presence of coagulative necrosis by thermal injury. 30 Recently, several studies on tissues near the electrode have shown such observations: reporting vaporization, carbonization, coagulation, enzyme denaturation, and so on, as a result of the application of electric energy. 30 However, electroporation did not always exhibit a thermal effect but a much weaker effect on the adjacent tissues in many other cases.
The H&E staining has been usually utilized to evaluate the destructive area of IRE in liver tissue. 2,20,22,30 –32 However, the evaluation was based on results from necrosis. In the present study, the ablation area was evaluated according to apoptosis using TUNEL assay. The TUNEL assay shows the breakage of DNAs, which is an important biochemical indicator of apoptosis. In addition, TUNEL staining provides the clear boundary between ablated area and nonaffected area by distinguishable color. As expected, the treated tissue exhibited fiercely apoptotic appearances at 10 hours after ablation, particularly around and/or between the electrodes in TUNEL assay.
Figure 4 shows the ablation area based on the apoptotic area, which analytically exhibited linearity in response to the increase in the applied voltage and the number of pulses. Figure 5 also supported the relationship of the total amount of electric energy with the ablation area. The electroporated ablation from the experiment was compared with our theoretical model, and the results showed consistency. The model’s electric energy threshold 5.9 × 10⁵ J/m3 is similar to those of previous studies: 2.6 × 10⁵ J/m3 for rabbit livers with 8 pulses of 100 µs duration and threshold electric field of 700 V/cm33 and 1.2 × 10⁶ J/m3 for porcine livers with 99 pulses of 100 µs duration and threshold electric field of 423 V/cm. 10
However, the histological analysis and mathematical simulation did entirely not produce identical results. The apoptotic areas for the 32 pulses at 700 and 1000 V/cm were quite similar, possibly as a result of the errors in the experimental procedures. Because the electrodes are flexible, the electrode positions at the histological section are slightly crooked even when the wire was guided by polydimethylsiloxane polymer. 22 Thus, Figure 3 exhibits wider electrode sites for 8 pulses at 150 V/cm and narrower for 32 pulses at 150 V/cm. These could explain the errors in our analysis. In addition, liver tissue might be inhomogeneous since it involves cells, extracellular matrix, blood capillaries, and various kinds of blood cells. These properties can cause distortions in the homogeneous distribution of the electric field within the tissue, resulting in an insufficient delivery of electric energy needed to produce an irreversible transmembrane potential. 34 The injured spots for the electrodes in Figure 3 were asymmetrical, and noninfluenced areas were observed in the ablated tissue. 35 Also, the effect of conductivity change with time as electroporation progresses, or dynamic conductivity, should be explored. 3,27,33,34,36 The change is caused by the opening of membrane pores. The conductivity change results in the change in the ablation area.
The strength of the applied electric field depends on the conductivity of the tissue between the electrodes as well as the cell, which affects the electrostatics of the system. Therefore, there were regions between the electrodes where IRE could not be achieved, even though a sufficient electric energy was applied to irreversibly cause damages to the cells between the electrodes. For these reasons, even though the same amount of electric energy was applied, the apoptotic rate had a slight variation. Figure 6 indicates the results calculated by assuming homogeneity of the tissue. Thus, the ablated areas were apparently symmetric for both electrodes, completely destroying the tissue starting at the electric energy of 5.9 × 10⁵ J/m3. As in Figure 7, this simulation was consistent with the experimental results, even though there were errors in the sites where the electrodes were introduced. Samples at which the electric energy of over 5.9 × 10⁵ J/m3 was applied (350 V/cm, 32 ps; 350 V/cm, 64 ps; 500 V/cm, 32 ps) appeared to be fully apoptotic up to the line of electric field of 500 V/cm for 64 ps and larger fields for smaller pulse numbers. Our model was simple and did not include properties of heterogeneity of applied tissue and thermal effects due to IRE, but the simulation based on electric energy was good. A similar tendency has been reported in other studies. 36 Thus, this simulation can help practitioners better design and predict the effects of electroporation as a clinical treatment.
Recently, a question was raised concerning the reliability of numerical simulation to predict the ablation of IRE. 37 Wimmer et al compared the numerical simulation and experiment of IRE and concluded that a numerical simulation underestimates the ablation area for some cases. First, it is possible that the applied electric energy criterion would improve their simulation. In their experiments, the voltage and the pulse application time were changed simultaneously, so it is difficult to predict whether the critical electric energy criterion, or the time-dependent critical electric field criterion, would fit better than the constant critical electric field criterion used in their numerical simulation. Second, it is likely that the conductivity change over electric field 3,27,33,34,36 would improve it. To improve their simulation in the future, we compared an unsuccessful and a successful case. The unsuccessful case is the use of bipolar electrodes, which have the positive and negative voltage pole in 1 electrode (protocol no. 6 in 37 ). The successful case was the use of 2 parallel electrodes (protocol no. 4 in 37 ). The 2 cases have the same experiment conditions, except for the geometry of the electrodes. Since the difference is time independent, the conductivity change as a function of static electric field may improve their simulation.
The limitations of this study are that the thermal effects from electric fields were not reflected in the theoretical calculation when analyzing the apoptotic area, even though other studies have insisted that reversible electroporation, and even IRE, does not introduce thermal effects, even near the electrode. An additional study is required to accurately assess this effect in terms of the performance in simulations and actual experiments.
Here, we attempted to take into account the apoptotic area for liver tissue with applied electric energy densities. The experimental and theoretical results obtained could facilitate the application of electroporation as a clinical treatment.
Footnotes
Abbreviations
Declaration of Conflicting Interests
The author(s) declared no potential conflicts of interest with respect to the research, authorship, and/or publication of this article.
Funding
The author(s) received no financial support for the research, authorship, and/or publication of this article.