
Abstract
Purpose:
To evaluate a method for reducing metal artifacts, arising from dental fillings, on cone-beam computed tomography images.
Materials and Methods:
A projection interpolation algorithm is applied to cone-beam computed tomography images containing metal artifacts from dental fillings. This technique involves identifying metal regions in individual cone-beam computed tomography projections and interpolating the surrounding values to remove the metal from the projection data. Axial cone-beam computed tomography images are then reconstructed, resulting in a reduction in the streak artifacts produced by the metal. Both phantom and patient imaging data are used to evaluate this technique.
Results:
The interpolation substitution technique successfully reduced metal artifacts in all cases. Corrected images had fewer or no streak artifacts compared to their noncorrected counterparts. Quantitatively, regions of interest containing the artifacts showed reduced variance in the corrected images versus the uncorrected images. Average pixel values in regions of interest around the metal object were also closer in value to nonmetal regions after artifact reduction. Artifact correction tended to perform better on patient images with less complex metal objects versus those with multiple large dental fillings.
Conclusion:
The interpolation substitution is potentially an efficient and effective technique for reducing metal artifacts caused by dental fillings on cone-beam computed tomography image. This technique may be effective in reducing such artifacts in patients with head and neck cancer receiving daily image-guided radiotherapy.
Introduction
Cone-beam computed tomography (CBCT) images are often obtained on head and neck (H&N) radiotherapy patients and used to ensure accurate positioning of the patient on the treatment table. 1 -4 However, many patients with H&N cancer have high-density metal objects in their oral cavity such as dental fillings and implants. These high-density objects can induce metal artifacts in CBCT images. These artifacts, also known as streak or starburst artifacts, are the result of inconsistencies in the CBCT projection data. These inconsistencies arise due to photon starvation and beam hardening because the attenuation coefficient of metal in the range of diagnostic X-rays is much higher than that of soft tissue and bone. 5 Metal artifacts may result in a significant reduction in image quality, which may limit the use of image-guided radiotherapy (IGRT) and inhibit the ability of therapists and physicians to accurately interpret CBCT image data.
Several methods have been developed to reduce metal artifacts and improve image quality in spiral computed tomography (CT) 6 -16 and CBCT. 17 -23 These metal artifact reduction (MAR) techniques are broadly classified as interpolative and iterative methods. The former method involves interpolating over the high-density objects in the projection data, followed by reconstruction of the modified projection data. This so-called interpolation substitution method reduces streak artifacts but often induces additional artifacts and accepts a loss of information from structures surrounding the high-density objects. 17 Iterative techniques tend to perform better, however, they are computationally intensive. Thus, their use may be limited for IGRT patients, where images need to be reconstructed while the patient is on the treatment table.
In this study, we propose a basic interpolation substitution method to reduce metal artifacts in CBCT. Our method is intended for H&N radiotherapy patients with metal dental fillings and implants. To our knowledge, the interpolation substitution method has not been highly utilized for MAR in CBCT images in H&N radiotherapy. We demonstrate the efficacy of our method using a custom-built H&N phantom with dental fillings as well as the imaging data from 3 H&N radiotherapy patients.
Materials and Methods
Theory
Acquiring a CBCT image begins by positioning the patient on the treatment table. Next, an X-ray beam rotates around the patient as a detector records a series of 2-dimensional projection images. Then, a CBCT reconstruction algorithm transforms the projection images into a 3-dimensional (3D) volumetric image set. The volumetric image set consists of a series of axial slices through the patient allowing visualization of the individual’s anatomy. If metal implants or fillings are present in the patient, they can highly attenuate the beam and create a region, or shadow, in the projection images where almost no X-rays are detected. Attempting to reconstruct projection images with these metal shadows results in artifacts due to inconsistencies in the projection data. By interpolating over the metal in the projection images, the inconsistencies may be removed from the projection data. Thus, reconstructing the modified projection data results in a volumetric image set with reduced artifacts.
Interpolation Substitution Method
A description of the interpolation substitution method is shown in Figure 1. First, a series of CBCT projection images were obtained from the kilovoltage (kV) X-ray imaging device on the TrueBeam (Varian Medical Systems, Palo Alto, California). These projection images were then reconstructed to form a 3D (volumetric) data set using the iTools software (Varian Medical Systems). This image set was then imported into Matlab (Mathworks, Natick, Massachusetts) for processing. Individual images containing the metal were segmented using the method of Otsu. 24 This technique sets a threshold in which pixel values above this value are considered metal and pixel values below are considered as nonmetal. Using this segmentation technique, a mask of the area in and bordering the metal objects in the volumetric image set was created. This volumetric mask was then forward projected using the iTools software to obtain a mask of the metal objects in the projection images. The masked projection images were then imported into Matlab and used to interpolate over the metal objects in the original projection scans. The interpolation algorithm smoothly interpolates inward from the pixel values on the boundary of the metal objects by solving Laplace equation, which minimizes the integrated square of the gradient of the pixel values. Hence, the boundary pixels are not modified. The new projection images, with the metal interpolated out of the data set, were backprojected to create a new volumetric image set using the iTools software. This new interpolated volumetric image set has virtually no metal objects (ie, there are no pixel values above the metal threshold). The net result is a volumetric image set with artifacts either reduced or significantly removed. Since interpolation removes the metal objects, the last step involves artificially inserting the objects back into the new, artifact-reduced volume. This was done by locating the positions of the metal objects in the original volume, using the mask, and inserting the original metal pixel values at their original positions.

Flowchart of the interpolation substitution method used in the metal artifact reduction (MAR) method to reduce artifacts.
Phantom Studies
The H&N phantom shown in Figure 2 was built using a plastic container, vinyl brackets, mouth guard, mounting putty, and metal dental fillings. The vinyl brackets were used to simulate the mandible. The mouth guard and mounting putty represent the densities of the oral cavity and teeth, respectively. The container was filled with water to simulate soft tissue. A total of 5 dental amalgam fillings shaped into 5-mm spheres were placed into the mouth guard using the mounting putty. A separate mouth guard with only mounting putty and no metal fillings was also made. From the phantom, projection images and the resultant CBCT images were obtained from the kV imaging system on the TrueBeam. One set of images was obtained using the mouth guard with metal fillings, and a separate set of images was obtained using the mouth guard without metal. Thus, the second image set provides a “ground truth” to evaluate the effectiveness of our artifact reduction technique.

Photograph of the head and neck (H&N) phantom used to analyze the interpolated substitution method of metal artifact reduction. The phantom consists of a container, vinyl brackets, mouth guard, mounting putty, and spherical dental amalgam fillings. The dental fillings are not visible in the image since they are within the mounting putty.
Clinical Application
In addition to the phantom studies, the interpolation substitution method was applied to 3 different patient cases. Three sets of projection data were obtained from patients who had received radiotherapy for H&N cancer. Each patient had varying degrees of metal objects in or around the oral cavity that resulted in artifacts in the reconstructed image sets. Thus, each patient provided unique clinical examples of metal artifacts that could be reduced by applying our method.
Quantification
Using CBCT data acquired from the TrueBeam of the phantom and 3 patients, the interpolation substitution method described previously was implemented using Matlab and the Varian iTools software. Artifact reduction in the phantom data was evaluated by comparing the mean and standard deviation of the pixel values in the artifact regions for the original images, artifact-reduced images, and the images obtained without the metal objects. In patient data, it was not possible to obtain images without the metal objects in place. Therefore, regions of interest (ROIs) consisted of the artifact regions in the original images and in the artifact-reduced images. For comparison purposes, ROIs were also selected in similar anatomical regions that were not affected by the metal objects (ie, contralateral or superior/inferior to the artifacts). Similar to the phantom data, the mean and standard deviation in pixel values were compared.
Results
For all images shown in this article, a window level of 375 Hounsfield units (HU) and a window width of 2750 HU were selected.
Phantom Studies
Figure 3 shows the same slice from 3 different image reconstructions of the phantom data. Figure 3A shows the original CT slice with the metal artifacts, Figure 3B shows the artifact-reduced CT slice, and Figure 3C shows the CT slice of the same phantom without any metal dental fillings. Hence, Figure 3C provides the ground truth to compare with Figure 3B. Comparing Figure 3A to Figure 3B, the artifacts from the dental fillings are significantly reduced. The streak posterior to the vinyl brackets in Figure 3B appears to be more prominent than in Figure 3A, but overall the image appears more uniform. Comparing Figure 3B to Figure 3C, the artifacts are reduced but are not completely removed. Although the goal in artifact reduction would be to convert Figure 3A to Figure 3C, a satisfactory result is to simply reduce the magnitude of the metal artifacts in the original image and elucidate more soft tissue regions, as Figure 3B appears to do.
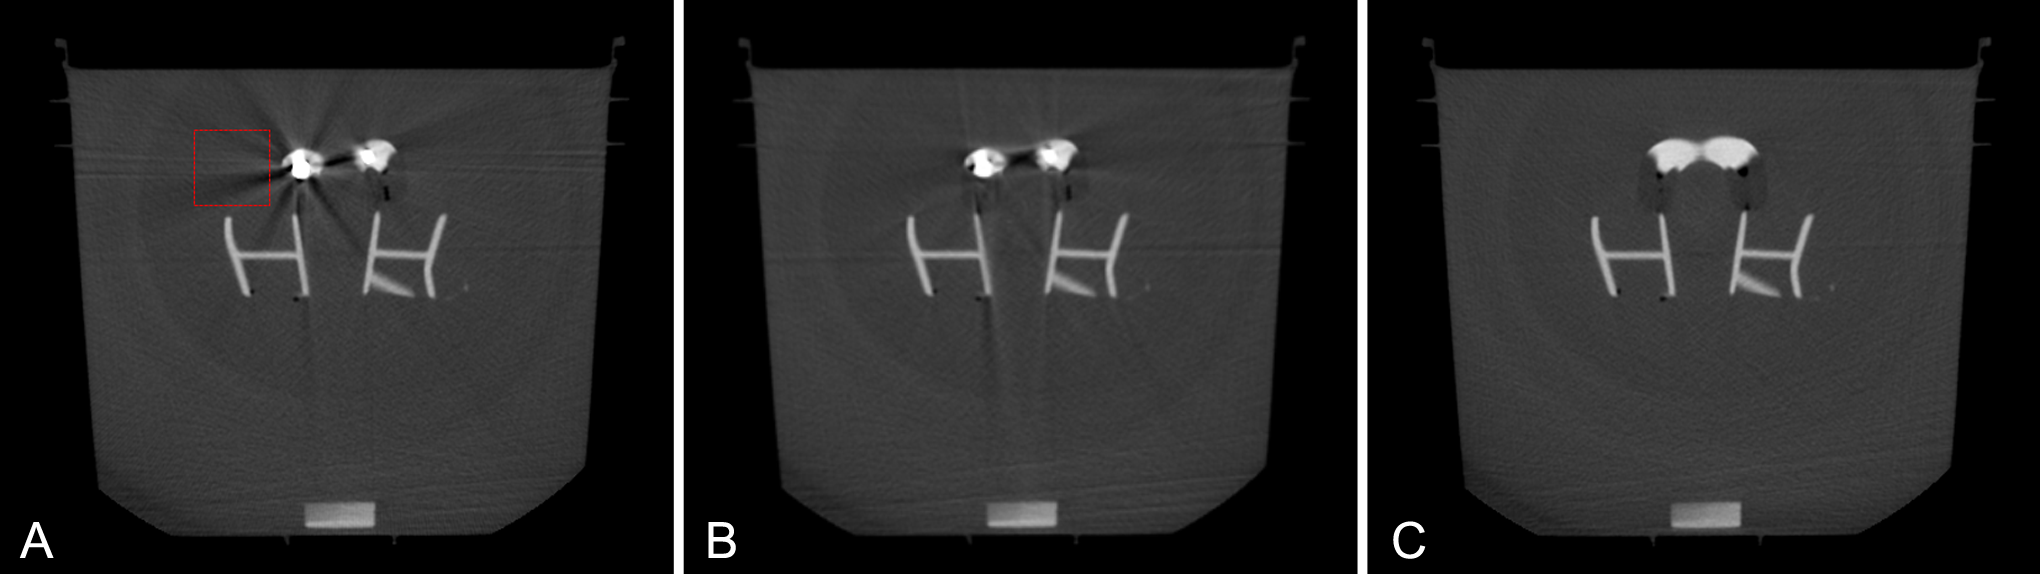
Cone-beam computed tomography (CBCT) reconstruction of the head and neck (H&N) phantom. A, Image of the phantom with metal dental fillings. B, Artifact-reduced image of the phantom with metal dental fillings. C, Image of the phantom without metal dental fillings. The dotted outline (red) on the image (A) indicates the artifact region of interest (ROI). The same ROI was used for analysis of all 3 images.
Table 1 lists a comparison of the mean and standard deviation of the HU for the artifact region in the original, processed, and ground truth images shown in Figure 3. For all 3 images, the mean pixel values were within 10 HU, and hence, artifact reduction did not have a significant impact on this value. However, the interpolation substitution algorithm significantly reduced the standard deviation within the ROI. In particular, the standard deviation of the artifact-reduced image is now much closer to the ground truth image, indicating a reduction in the magnitude of the streak artifact.
Density Values (HU) From Regions of Interest in the Phantom and Patient CBCT Images.a

a SD is the standard deviation of the pixel values located within the region of interest, and mean is the average of the pixel values within the region of interest.
Patient Images
Three sets of data from patients with H&N cancer with metal objects in the oral cavity were utilized in order to evaluate the clinical effectiveness of the artifact reduction technique. Patient 1 in Figure 4A and B demonstrates minor artifacts. Patient 2 depicted in Figure 5A and B demonstrates intermediate artifacts, and patient 3 depicted in Figures 6A and B demonstrates major artifacts.
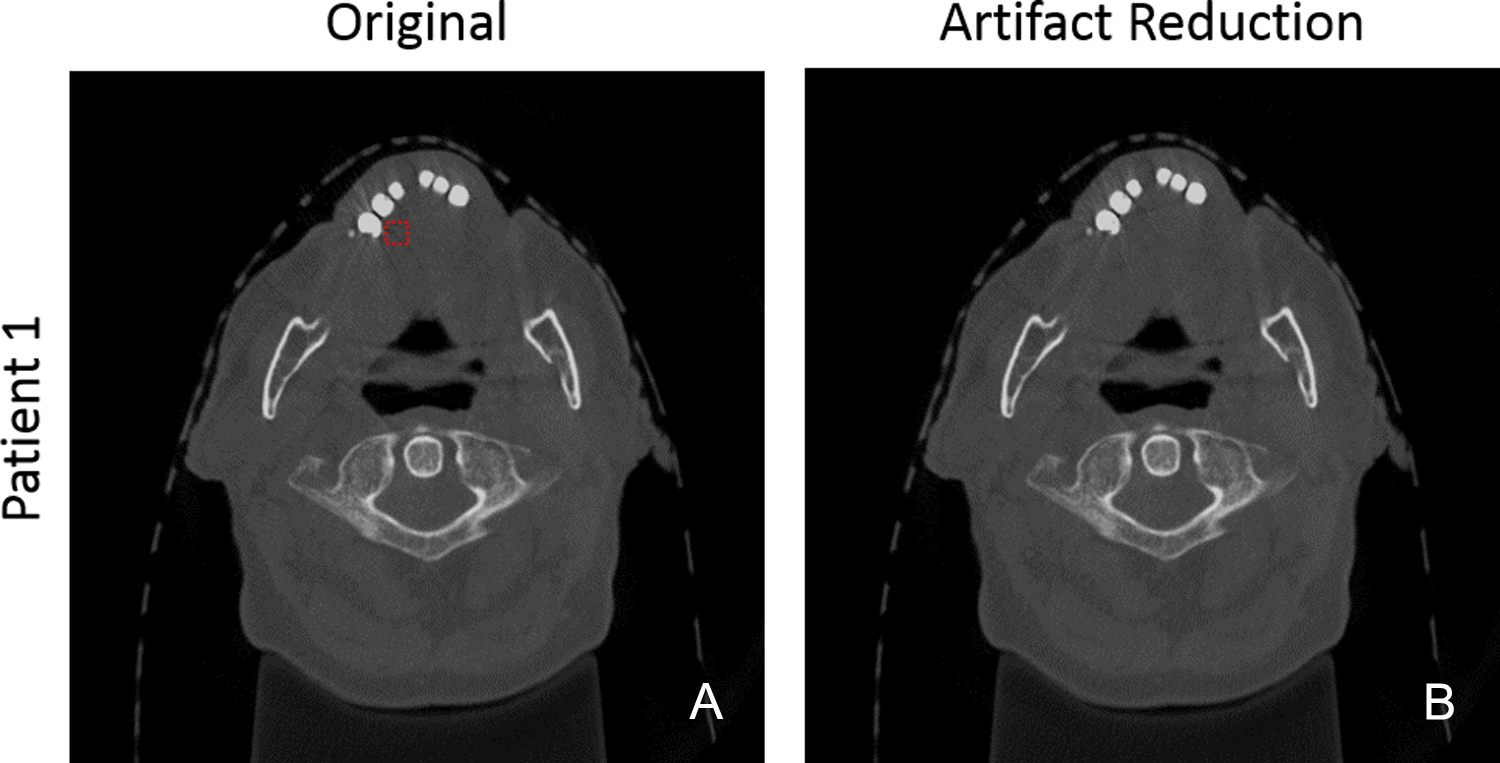
Cone-beam computed tomography (CBCT) reconstructions of patient 1—(A) original image and (B) following application of the interpolation substitution method. The dotted outline (red) on the original image (A) indicates the artifact region of interest (ROI). The same ROI was used for analysis of both images. The same ROI on an adjacent slice was used to calculate the “without metal” statistics presented in Table 1.
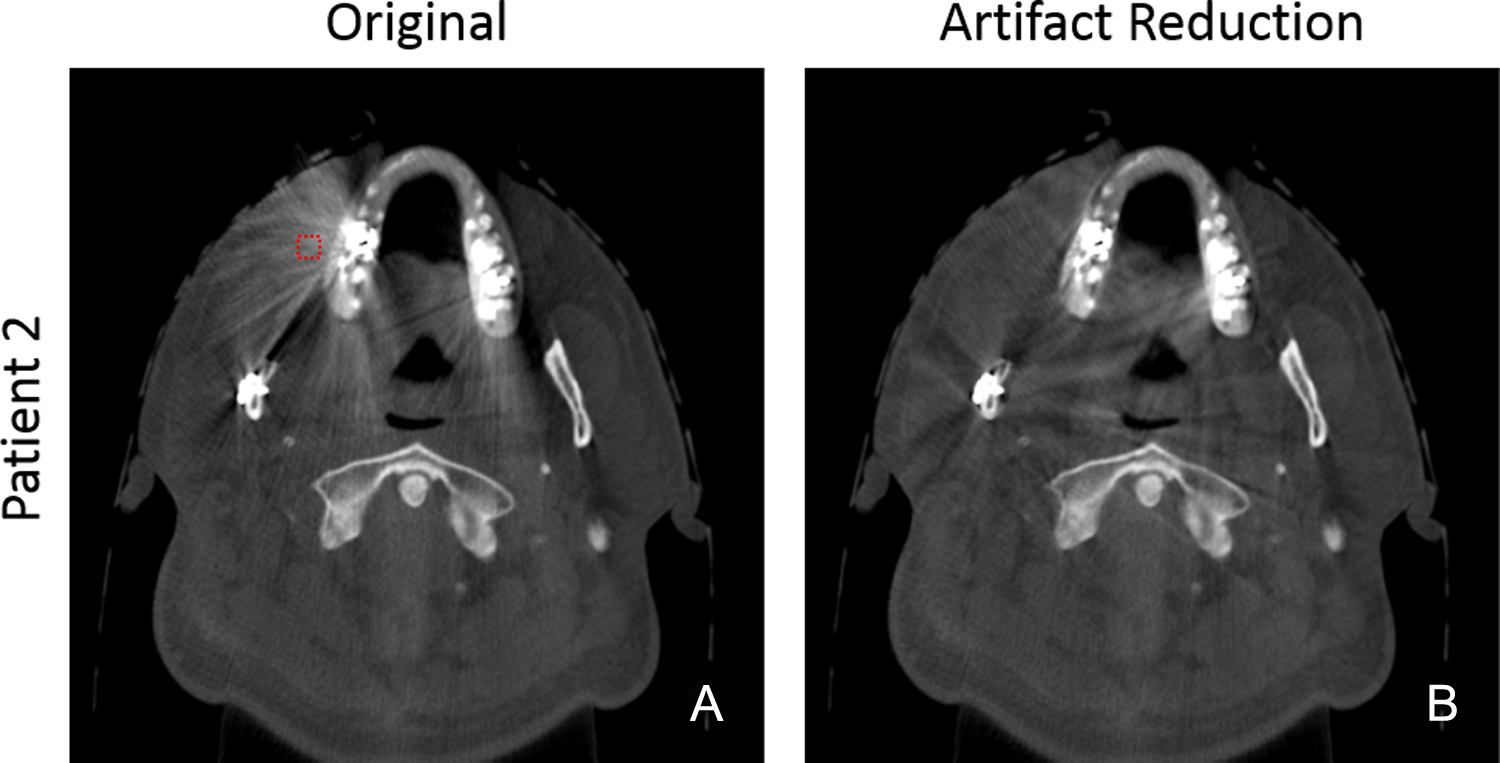
Cone-beam computed tomography (CBCT) reconstructions of patient 2—(A) original image and (B) following application of the interpolation substitution method. The dotted outline (red) on the original image (A) indicates the artifact ROI. The same ROI was used for analysis of both images. The same ROI on an adjacent slice was used to calculate the “without metal” statistics presented in Table 1.

Cone-beam computed tomography (CBCT) reconstructions of patient 3—(A) original image and (B) following application of the interpolation substitution method. The dotted outline (red) on the original image (A) indicates the artifact ROI. The same ROI was used for analysis of both images. The same ROI on an adjacent slice was used to calculate the “without metal” statistics presented in Table 1.
Figure 4A depicts a slice from the original CBCT volume obtained from patient 1, and Figure 4B represents the same slice after artifact reduction. This case represents a patient with one, small metal object in their oral cavity. Hence, the initial artifacts are very minor. This case is meant to demonstrate that the interpolation substitution method can be implemented on cases with minor artifacts without altering overall image quality or other regions of the image. Comparing Figure 4A to Figure 4B, the artifacts surrounding the metal object in the top left of the image were all decreased in intensity. As intended, the remainder of the image in Figure 4B was unchanged in comparison to Figure 4A. From Table 1, a slight reduction in the mean pixel value is observed in the artifact-reduced image, relative to the original image. Likewise, a reduction in the standard deviation of the artifact ROI is also observed. For both metrics, the interpolation substitution method resulted in mean and standard deviations which were much closer in value to those of a similar ROI located contralateral to the metal artifact.
Figure 5A shows a slice from the original CBCT volume obtained from patient 2, and Figure 5B represents the same slice after artifact reduction. This patient represents a very common presentation, in which many patients may have 1 or 2 metal dental objects in their oral cavity that significantly degrade the image quality surrounding the objects. Metal objects are seen in the top left of Figure 5A and 1 smaller object in the center left region of the image. Overall, there is a significant artifact reduction in Figure 5B as shown by the removal of the streak artifacts in the left half of Figure 5A. Similar to the previous image, Table 1 shows a reduction in both the mean and the standard deviation in HU of the artifact-reduced image versus the original image. The resultant average value of the ROI in the artifact-reduced image is now much closer in value to that of a similar ROI inferior to the artifact region.
Figure 6A depicts a slice from the original CBCT volume obtained from patient 3, and Figure 6B represents the same slice after artifact reduction. This case represents a patient with significant metal hardware in the oral cavity, resulting in large image-degrading artifacts. Comparing Figure 6A to Figure 6B, the region surrounding the metal objects in the top left of the images becomes much more uniform with fewer streaks after implementing our method. Streak artifacts throughout the remainder of the image were also reduced. In comparing the magnitude of the pixel values, there is a significant reduction in the mean value and standard deviation in HU of the ROI after applying the interpolation substitution algorithm. However, the mean value is still significantly larger than that of an ROI superior to this image slice. Hence, although the severity of the artifacts is greatly reduced, artifacts still exist for this difficult case.
Discussion
We have described here a method to reduce metal artifacts in H&N CBCT images using an interpolation substitution method. This method resulted in reduced artifacts in phantom and patient cases presented. The magnitude of artifact reduction is quantified by the reduction in ROI standard deviation in each case. Furthermore, our cases demonstrate the clinical efficacy of our MAR method, which can be potentially implemented within the TrueBeam platform.
A noticeable reduction in the severity of metal artifacts was observed in all cases presented. As expected, our algorithm performed best in the phantom, although it did not bring the image back to the ground truth quality. The decrease in ROI standard deviation from Figure 3A to Figure 3B demonstrates a quantitative decrease in image artifacts. The lack of significant change in ROI mean from Figure 3A to Figure 3B demonstrates little to no change in information. However, the change in mean from Figure 3C to Figure 3B demonstrates that the pixel values in Figure 3A and B may not be accurate since they differ from the ground truth in Figure 3C. This could be the result of a loss of information during the acquisition of the CBCT projection data due to the initial presence of the metal objects.
When the interpolation substitution method was implemented on more complicated data such as in a patient, a significant reduction in image artifacts was noted. Qualitatively, the image improvement was most noticeable for patient 3 in Figure 6A and B, who had the most significant artifacts in the original image. From a quantitative viewpoint, images with less complex metal objects, such as Figures 4A and 5A, had resultant pixel values within the metal ROIs that were closer to those in the nonmetal regions than that from Figure 6A. Thus, other techniques may be needed for complex metal objects.
As has been reported previously, interpolation substitution methods have resulted in the induction of additional artifacts. 17 The phantom images in Figure 3 demonstrate artifacts that become more prominent after implementing our technique. Comparing Figure 3A and Figure 3B, the artifact posterior to the vinyl bracket becomes slightly more prominent after implementing our method.
This interpolation substitution method excels in computational efficiency and simplicity. Our technique requires an initial reconstruction followed by a forward projection and a second reconstruction. Iterative methods generally result in a greater reduction in artifacts but are more computationally expensive. 25 -31 Since our artifact reduction technique is intended for application in IGRT, the time efficiency is a key aspect of our method.
In conclusion, the interpolation substitution technique successfully reduced artifacts in the H&N phantom and patient cases as demonstrated by the reduction in standard deviations in different ROIs containing artifacts. Future work will be directed at developing a more robust method of segmenting metal objects within the CBCT images and developing a user interface for application of our technique in H&N IGRT.
Footnotes
Acknowledgments
The authors acknowledge the support of Drs Anna Szaderska and Stephen Macleod for providing the fillings and dental implant materials used in the phantom studies.
Declaration of Conflicting Interests
The author(s) declared no potential conflicts of interest with respect to the research, authorship, and/or publication of this article.
Funding
The author(s) received no financial support for the research, authorship, and/or publication of this article.