
Abstract
Purpose:
This study aimed to detect the sensitivity of Delt 4 on ordinary field multileaf collimator misalignments, system misalignments, random misalignments, and misalignments caused by gravity of the multileaf collimator in stereotactic body radiation therapy.
Methods:
(1) Two field sizes, including 2.00 cm (X) × 6.00 cm (Y) and 7.00 cm (X) × 6.00 cm (Y), were set. The leaves of X1 and X2 in the multileaf collimator were simultaneously opened. (2) Three cases of stereotactic body radiation therapy of spinal tumor were used. The dose of the planning target volume was 1800 cGy with 3 fractions. The 4 types to be simulated included (1) the leaves of X1 and X2 in the multileaf collimator were simultaneously opened, (2) only X1 of the multileaf collimator and the unilateral leaf were opened, (3) the leaves of X1 and X2 in the multileaf collimator were randomly opened, and (4) gravity effect was simulated. The leaves of X1 and X2 in the multileaf collimator shifted to the same direction. The difference between the corresponding 3-dimensional dose distribution measured by Delt 4 and the dose distribution in the original plan made in the treatment planning system was analyzed with γ index criteria of 3.0 mm/3.0%, 2.5 mm/2.5%, 2.0 mm/2.0%, 2.5 mm/1.5%, and 1.0 mm/1.0%.
Results:
(1) In the field size of 2.00 cm (X) × 6.00 cm (Y), the γ pass rate of the original was 100% with 2.5 mm/2.5% as the statistical standard. The pass rate decreased to 95.9% and 89.4% when the X1 and X2 directions of the multileaf collimator were opened within 0.3 and 0.5 mm, respectively. In the field size of 7.00 (X) cm × 6.00 (Y) cm with 1.5 mm/1.5% as the statistical standard, the pass rate of the original was 96.5%. After X1 and X2 of the multileaf collimator were opened within 0.3 mm, the pass rate decreased to lower than 95%. The pass rate was higher than 90% within the 3 mm opening. (2) For spinal tumor, the change in the planning target volume V18 under various modes calculated using treatment planning system was within 1%. However, the maximum dose deviation of the spinal cord was high. In the spinal cord with a gravity of −0.25 mm, the maximum dose deviation minimally changed and increased by 6.8% than that of the original. In the largest opening of 1.00 mm, the deviation increased by 47.7% than that of the original. Moreover, the pass rate of the original determined through Delt 4 was 100% with 3 mm/3% as the statistical standard. The pass rate was 97.5% in the 0.25 mm opening and higher than 95% in the 0.5 mm opening A, 0.25 mm opening A, whole gravity series, and 0.20 mm random opening. Moreover, the pass rate was higher than 90% with 2.0 mm/2.0% as the statistical standard in the original and in the 0.25 mm gravity. The difference in the pass rates was not statistically significant among the −0.25 mm gravity, 0.25 mm opening A, 0.20 mm random opening, and original as calculated using SPSS 11.0 software with P > .05.
Conclusions:
Different analysis standards of Delt 4 were analyzed in different field sizes to improve the detection sensitivity of the multileaf collimator position on the basis of 90% throughout rate. In stereotactic body radiation therapy of spinal tumor, the 2.0 mm/2.0% standard can reveal the dosimetric differences caused by the minor multileaf collimator position compared with the 3.0 mm/3.0% statistical standard. However, some position derivations of the misalignments that caused high dose amount to the spinal cord cannot be detected. However, some misalignments were not detected when a large number of multileaf collimator were administered into the spinal cord.
Introduction
The development of radiotherapy technology, particularly stereotactic body radiation therapy (SBRT) and stereotactic radiosurgery (SRS), can significantly decrease the overall radiation treatment time of patients. However, these methods compel high requirements to computational accuracy of treatment planning system (TPS), treatment position fixation of patient, determination of tumor target, machinery, and dose performance of a linear accelerator to improve tumor control probability and protect normal tissues. Verification of SBRT and SRS treatment planning, particularly 3-dimensional (3D) verification and mobile target verification, is associated with several problems. A possible method to resolve such problems is by developing a 3D dose verification instrument. The implementation of this plan depends on discriminating the actual irradiation of pretreatment planning and planning relative pass rates.
The limitations of the multileaf collimator (MLC) position are mainly attributed to 2 aspects: (1) precision of the MLC control system and (2) gauged absolute precision of the MLC leaf position. 1 Generally, the MLC position accuracy is ≤1 mm. 1,2 A report published in European Society for Therapeutic Radiology and Oncology (ESTRO) shows that the position accuracy of MLC is ±0.5 mm following the adjustable authentication of the radioactive treatment. 3 Multileaf collimator misalignments cause dose deviation of the tumor and the normal tissue. LoSasso et al 4 reported that a 0.5 mm system error of an MLC leaf can result in 5% dose deviation for a 10 mm gap in the dynamic treatment. Luo et al 5 presented that a 0.2 mm MLC system error can cause 1% dose deviation in the prostate target region. Rangel and Dunscombe 6 also reported that MLC misalignments ≤0.5 mm in the prostate and MLC misalignments ≤0.3 mm in the head and neck can change equivalent uniform dose ≤2.0% in the clinical target volume and in organs at risk ≤2.0 Gy. Therefore, the positioning and repeatability accuracies of the MLC should be considered. 7
The misalignments of the MLC in the SBRT and SRS treatment planning results challenge the existing 3D verification method. The traditional intensity-modulated radiation therapy (IMRT) dose validation uses an ionization chamber and a film. However, this method is inconvenient and can only be used to provide a 2-dimensional (2D) dose distribution. 8 A 2D verification equipment, such as a film and a 2D ionization chamber array, had been commonly used to verify MLC position in the past. 9,10 The pass rate of a field dose verification cannot represent the 3D dose pass rate within the whole irradiation range. A 2D dose can be independently measured but produces serious deviation compared with the accumulated 3D measurement dose. 11
This study aimed to investigate the dosimetric differences caused by MLC misalignments and the sensitivity of small dose differences detected by a 3D verification dose instrument (Delt 4) in SBRT of spinal tumors.
Materials and Methods
Materials
The 3D dose verification instrument used in this study was Delt 4, which is a p-type Si detector produced by ScandiDos AB (Sweden). Delt 4 was composed of a semiconductor matrix with a specific angle and consisted of 1069 tiny semiconductor detectors. The size of the detector was 0.78 mm2. The distance between the detectors in the center region (6.00 × 6.00 cm) was 0.50 cm. The distance between the detectors exceeding the center area was 1.00 cm. The effective detection range was 20.00 × 20.00 cm.
The accelerator used was a TrueBeam-type linear accelerator produced by Varian Co (Varian Co. Ltd. [USA]). X-ray energy was 6 MV. The TPS used was a Varian Eclipse version 11.0. The algorithm used was AAA calculation. The size of the computational grid was 0.10 × 0.10 × 0.1 cm.
Verification of Common Treatment Field
To investigate the sensitivity of different distances between the detectors (0.50 and 1.00 cm) to the misalignments of MLC, we designed 2 types of fields with areas of 2.00 cm (X) × 6.00 cm (Y) and 7.00 cm (X) × 6.00 cm (Y). The boundaries of the 2 fields in the X direction were within or beyond 6.00 × 6.00 cm (Figure 1). The dose distribution of the 2 fields was calculated using TPS. The MLC produced by TPS was edited with Matlab software (MathWorks Co. Ltd. [USA]), and X1 and X2 of MLC were opened by 0.10, 0.20, 0.90, 1.00, 2.00, and 5.00 mm. The gantry degree of the accelerator was 0°. The collimator degree was 0°. The output was 50 MU. Delt 4 was positioned at the center of the accelerator and irradiated by the accelerator 3 times. The mean value of Delt 4 was recorded.

Position relationship between the field and the Delt 4 detector: (A) 2.00 cm (X) × 6.00 cm (Y) field size and (B) 7.00 cm (X) × 6.00 cm (Y) field size.
The TPS results obtained by measuring the MLC error with Delt 4 were compared with the calculation results of the TPS planning. (1) The maximum dose deviation was ±3.0%. The maximum deviation distance was ±3.0 mm (3.0 mm/3.0%). (2) The maximum dose deviation was ±2.5%. The maximum spatial distance was ±2.5 mm (2.5 mm/2.5%) and so on: (3) 2.0 mm/2.0%, (4) 1.5 mm/1.5%, and (5) 1.0 mm/1.0%. The dose difference between the result of treatment planning and Delt 4 verification was analyzed using the percentage of γ index values, which were ≤1 defined the agreement between a measured and calculated dose distribution.
Spinal Tumor
Spinal tumor was subjected to adjustable authentication, and the spinal cord should be protected (Figure 2). A total of 3 cases were assessed. The average value of the 3 experimental data was calculated. The average planning target volume (PTV) was 135 cm3. A total of 9 fields were set in the radiotherapy treatment planning. The gantry angles of the fields were 100°, 120°, 140°, 160°, 180°, 200°, 220°, 240°, and 260°. The MLC produced with TPS was edited with Matlab software. The MLC closer to the center of field was designated as close. The MLC may also collide with each other. Therefore, the close error of the MLC could not be simulated. Only the MLC position that shifted to the same or open direction was simulated. The following circumstances were simulated: (1) in the first type of system error, X1 and X2 of MLC were simultaneously opened by 0.25, 0.50, 0.75, 1.00, and 2.00 mm and abbreviated as open 0.25 mm (0.50, 0.75, 1.00, and 2.00 mm); (2) in the second type of system error, only X1 of MLC was opened within 0.25, 0.50, 0.75, 1.00, and 2.00 mm and abbreviated as open A 0.25 mm (0.50, 0.75, 1.00, and 2.00 mm); (3) in the random error, X1 and X2 of MLC were randomly opened within 0.20, 0.50, 0.80, 1.00, and 2.00 mm and abbreviated as random 0.20 mm (0.50, 0.80, 1.00, and 2.00 mm); (4) the MLC was simulated to move within 0.20, 0.50, and 1.00 mm or −0.20, −0.50, and −1.00 mm of the same direction under the action of gravity and abbreviated as gravity 0.20 mm (0.50 and 1.00 mm) or gravity −0.20 mm (−0.50 and −1.00 mm). The original plan was abbreviated as original.
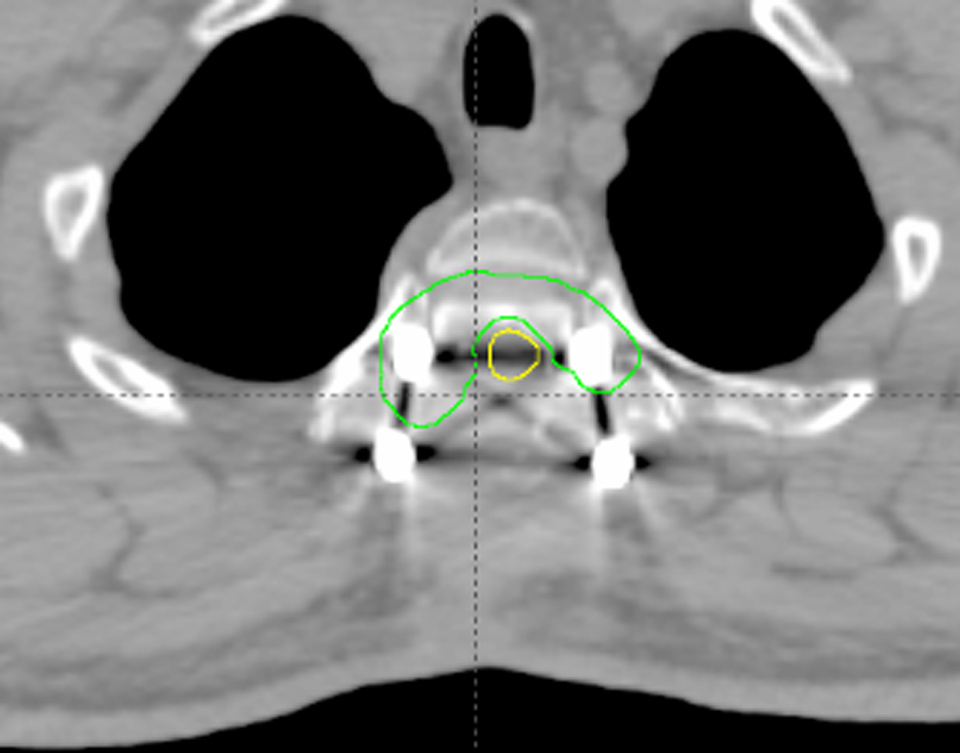
Schematic of spinal tumor.
The PTV was 1800 cGy and divided into 3 fractions. Reverse IMRT planning was designed. The mode of exercise of the MLC was dynamic.
The difference between the Delt 4 measurement result and the original result induced by misalignments of different MLC measurements was analyzed through γ criteria of 3.0 mm/3.0%, 2.0 mm/2.0%, and 1.5 mm/1.5% as the statistical standard. Experimental results were compared using multiple mean comparison of variance analysis with SPSS 11.0 software to determine statistical significance.
Results
Pass Rate of Misalignments of Ordinary Field MLC Investigated Using Delt 4
Figure 3 presents the comparison between the pass rate of the 2.00 × 6.00 cm field size opened within different distances in the X direction (Delt 4 measurement) with the 2.00 × 6.00 cm field calculated using TPS under different statistical standards (3.0 mm/3.0%, 2.5 mm/2.5%, 2.0 mm/2.0%, and 1.5 mm/1.5%). With 3.0 mm/3.0% as the statistical standard, the pass rate was 100% when the X1 and X2 directions were opened within 0.50 mm, decreased to 95.5% when the directions were opened within 1.00 mm, and decreased to 76.2% when the directions were opened within 2.0 mm. With 2.5 mm/2.5% as the statistical standard, the pass rate of the original was 100%. The pass rate decreased to 95.9% when the directions of X1 and X2 were opened within 0.30 mm and decreased to 89.4% when the directions were opened within 0.5 mm. With 2.0 mm/2.0% as the statistical standard, the pass rate was 86.2% when the MLC did not deviate. With 1.5 mm/1.5% as the statistical standard, the pass rate increased from 57.1% (open 0.00) to 66.0% (open 0.40 mm) when the directions were opened within 0.40 mm.
Comparison of the pass rate of the 2.00 × 6.00 cm field with γ index criteria of 3.0%/3.0 mm, 2.5%/2.5 mm, 2.0%/2.0 mm, and 1.5%/1.5 mm for spinal tumor.
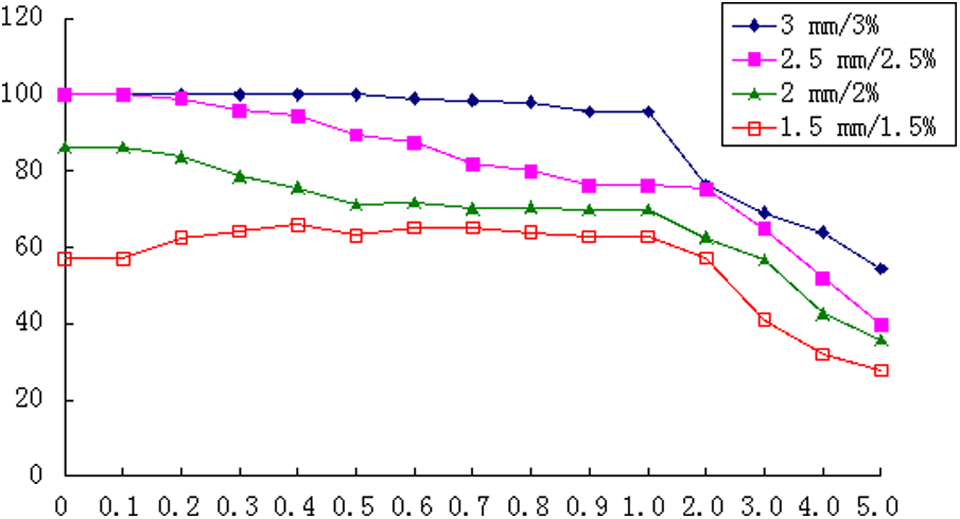
Figure 4 presents the pass rate of the 7.00 × 6.00 cm field opened within different distances in the X direction (Delt 4 measurement) compared with the 7.00 × 6.00 cm field calculated using TPS. With 3.0 mm/3.0% as the statistical standard, the pass rate of the original was 100%. The pass rate was 100% when the X1 and X2 directions of the MLC were opened within 0.7 mm, decreased to lower than 95% when the directions were opened within 3.0 mm, and increased to higher than 90% when opened within 5.0 mm. With 2.5 mm/2.5% as the statistical standard, the pass rate of the original was 100%. The pass rate decreased to lower than 95% when the X1 and X2 directions of MLC were opened within 3.0 mm and increased to higher than 90% when opened within 5.0 mm. With 2.0 mm/2.0% as the statistical standard, the pass rate was lower than those obtained with the 3.0 mm/3.0% and 2.5 mm/2.5% statistical standards. The pass rate of the original was 98.7%. After X1 and X2 directions of the MLC were extended within 2.0 mm outside, the pass rate decreased to lower than 95%. The pass rate was also higher than 90% when opened within 4.0 mm. With 1.5 mm/1.5% as the statistical standard, the pass rate of the original was 96.5%. After the directions were expanded within 0.30 mm outside, the pass rate decreased to lower than 95%. The pass rate was higher than 90% when the directions were opened within 3.00 mm. With 1.0 mm/1.0% as the statistical standard, the throughout rate was 88.2% when the geometric parameters of X1 and X2 of MLC remained constant. The pass rate was about 86.0% and then sharply declined when X1 and X2 of the MLC were opened within 0.6 mm. The pass rate was 70.4% when the directions were opened within 5.0 mm.

Comparison of the pass rate of the 7.00 × 6.00 cm field with γ index criteria of 3.0%/3.0 mm, 2.5%/2.5 mm, 2.0%/2.0 mm, 1.5%/1.5 mm, and 2.0%/2.0 mm for spinal tumor.
Treatment Planning System Calculation Results of Spinal Tumor
The PTV and spinal cord doses of the 3 cases of spinal tumor were calculated using TPS. The results are shown in Table 1. The spinal cord comprises serial tissues; therefore, the absolute dose was used to evaluate the spinal cord dose. The PTV V18 was higher than 96.5% when the MLC misalignments were ≤1 mm. Compared with the original, the deviation was within 1%. Except for the gravity state, the PTV V18 and PTV mean dosages of the other misalignments simulating the MLC increased, and this increase was related to the increased doses in the field caused by simulating the back shift of the MLC (X1 and X2). The changes in the mean of the PTV V18 and PTV caused by the simulated gravity of X1 and X2 were related to the shift of X1 and X2 in the same direction. The field cannot cover the entire PTV, causing the PTV partial dose to be insufficient. The maximum dose for the spinal cord significantly changed. In a minimum change gravity of 0.25 mm, the maximum dose for the spinal cord increased by 6.8% than that of the original. Moreover, in the maximum opening of 1.00 mm, the maximum dose increased by 47.7% than that of the original. In random 0.50 mm, the maximum dose for the spinal cord increased by 13.9% than that of the original.
PTV and Spine Dose for the Spine Tumor.

Abbreviations: max, maximum; PTV, planning target volume.
Figure 5 shows the dose-volume histogram, in which the changes in the MLC open-series PTV and spinal cord doses were the maximum, followed with the open A series. The changes, particularly PTV, in the gravity-series PTV and spinal cord doses were minimal. However, the spinal cord doses in gravities 1.00 and −1.00 mm increased by 29.32% and 35.03%, respectively, than those of the original. The random series increased with increasing MLC error. In comparison with the original, PTV and the spinal cord dosage gradually increased.

Dose-volume histogram (DVH) graph of planning target volume (PTV) and spinal cord doses: (A) open series, (B) open A series, (C) gravity (−) series, (D) gravity series, and (E) random series.
Figure 6 illustrates the isodose distribution map. The figure showed that the 100% isodose line of the original was consistent with that of the PTV. Furthermore, a low-dose region, which was conducive to the positioning, existed below the spinal cord. The maximum dose of the PTV was 115.4% of the prescribed dose. Moreover, the 95% isodose line of open 0.25 mm was linked to the ring, the 100% dose appeared at the arrowhead, and the 105% isodose line almost surrounded the whole PTV. The maximum dose of the PTV was 120.6% of the prescribed dose, and the 100% isodose line of open 0.50 mm was linked to the ring. The spinal cord area formed an isolated region. In addition, the 110% isodose line surrounded the PTV. The maximum dose of the PTV was 126.6% of the prescribed dose. The isodose line distribution of open A 0.50 mm approximated that of open 0.25 mm. The isodose line distribution of gravity 1.0 mm approximated that of the original, with only the whole dose line shifted to the left. Moreover, the 100% isodose line of random 0.8 mm almost surrounded the spinal cord and formed a ring. The maximum dose of the PTV was 121.8% of the prescribed dose.

Isodose line distribution: (A) original, (B) open 0.25 mm, (C) open 0.50 mm, (D) open A 0.50 mm, (E) gravity 1.0 mm, and (F) random 0.80 mm.
Verification Results of Delt 4
Table 2 shows the pass rates after simulating the misalignments of different MLCs. With 3.0 mm/3.0% as the statistical standard and using Delt 4, the pass rate of the original was 100% and that of open 0.25 mm was 97.5%. The pass rates exceeding 95% also included open A 0.5 mm, open A 0.25 mm, the whole gravity series, and random 0.20 mm. The verification dose decreased with the strict statistical standard. With 2 mm/2% as the statistical standard, the pass rate of the original and gravity 0.25 mm was >90%. The pass rates of gravity −0.25 mm, open A 0.25 mm, random 0.20 mm, and the original showed no statistically significant difference as calculated using SPSS 11.0 software (P > .05). With 1.5 mm/1.5% as the statistical standard, all pass rates were <70%.
Pass Rate Based on Vertebral Dose Verification with Different γ Index Criteria.

Figure 7A to E shows the dose verification distribution schemes, in which 7A and B were equivalent. With the expansion of the open-series MLC error, the maximum dose obtained through verification increased. The regions indicated by red and purple arrowheads gradually decreased and even disappeared. The result was similar to the pass rates shown in Table 2.
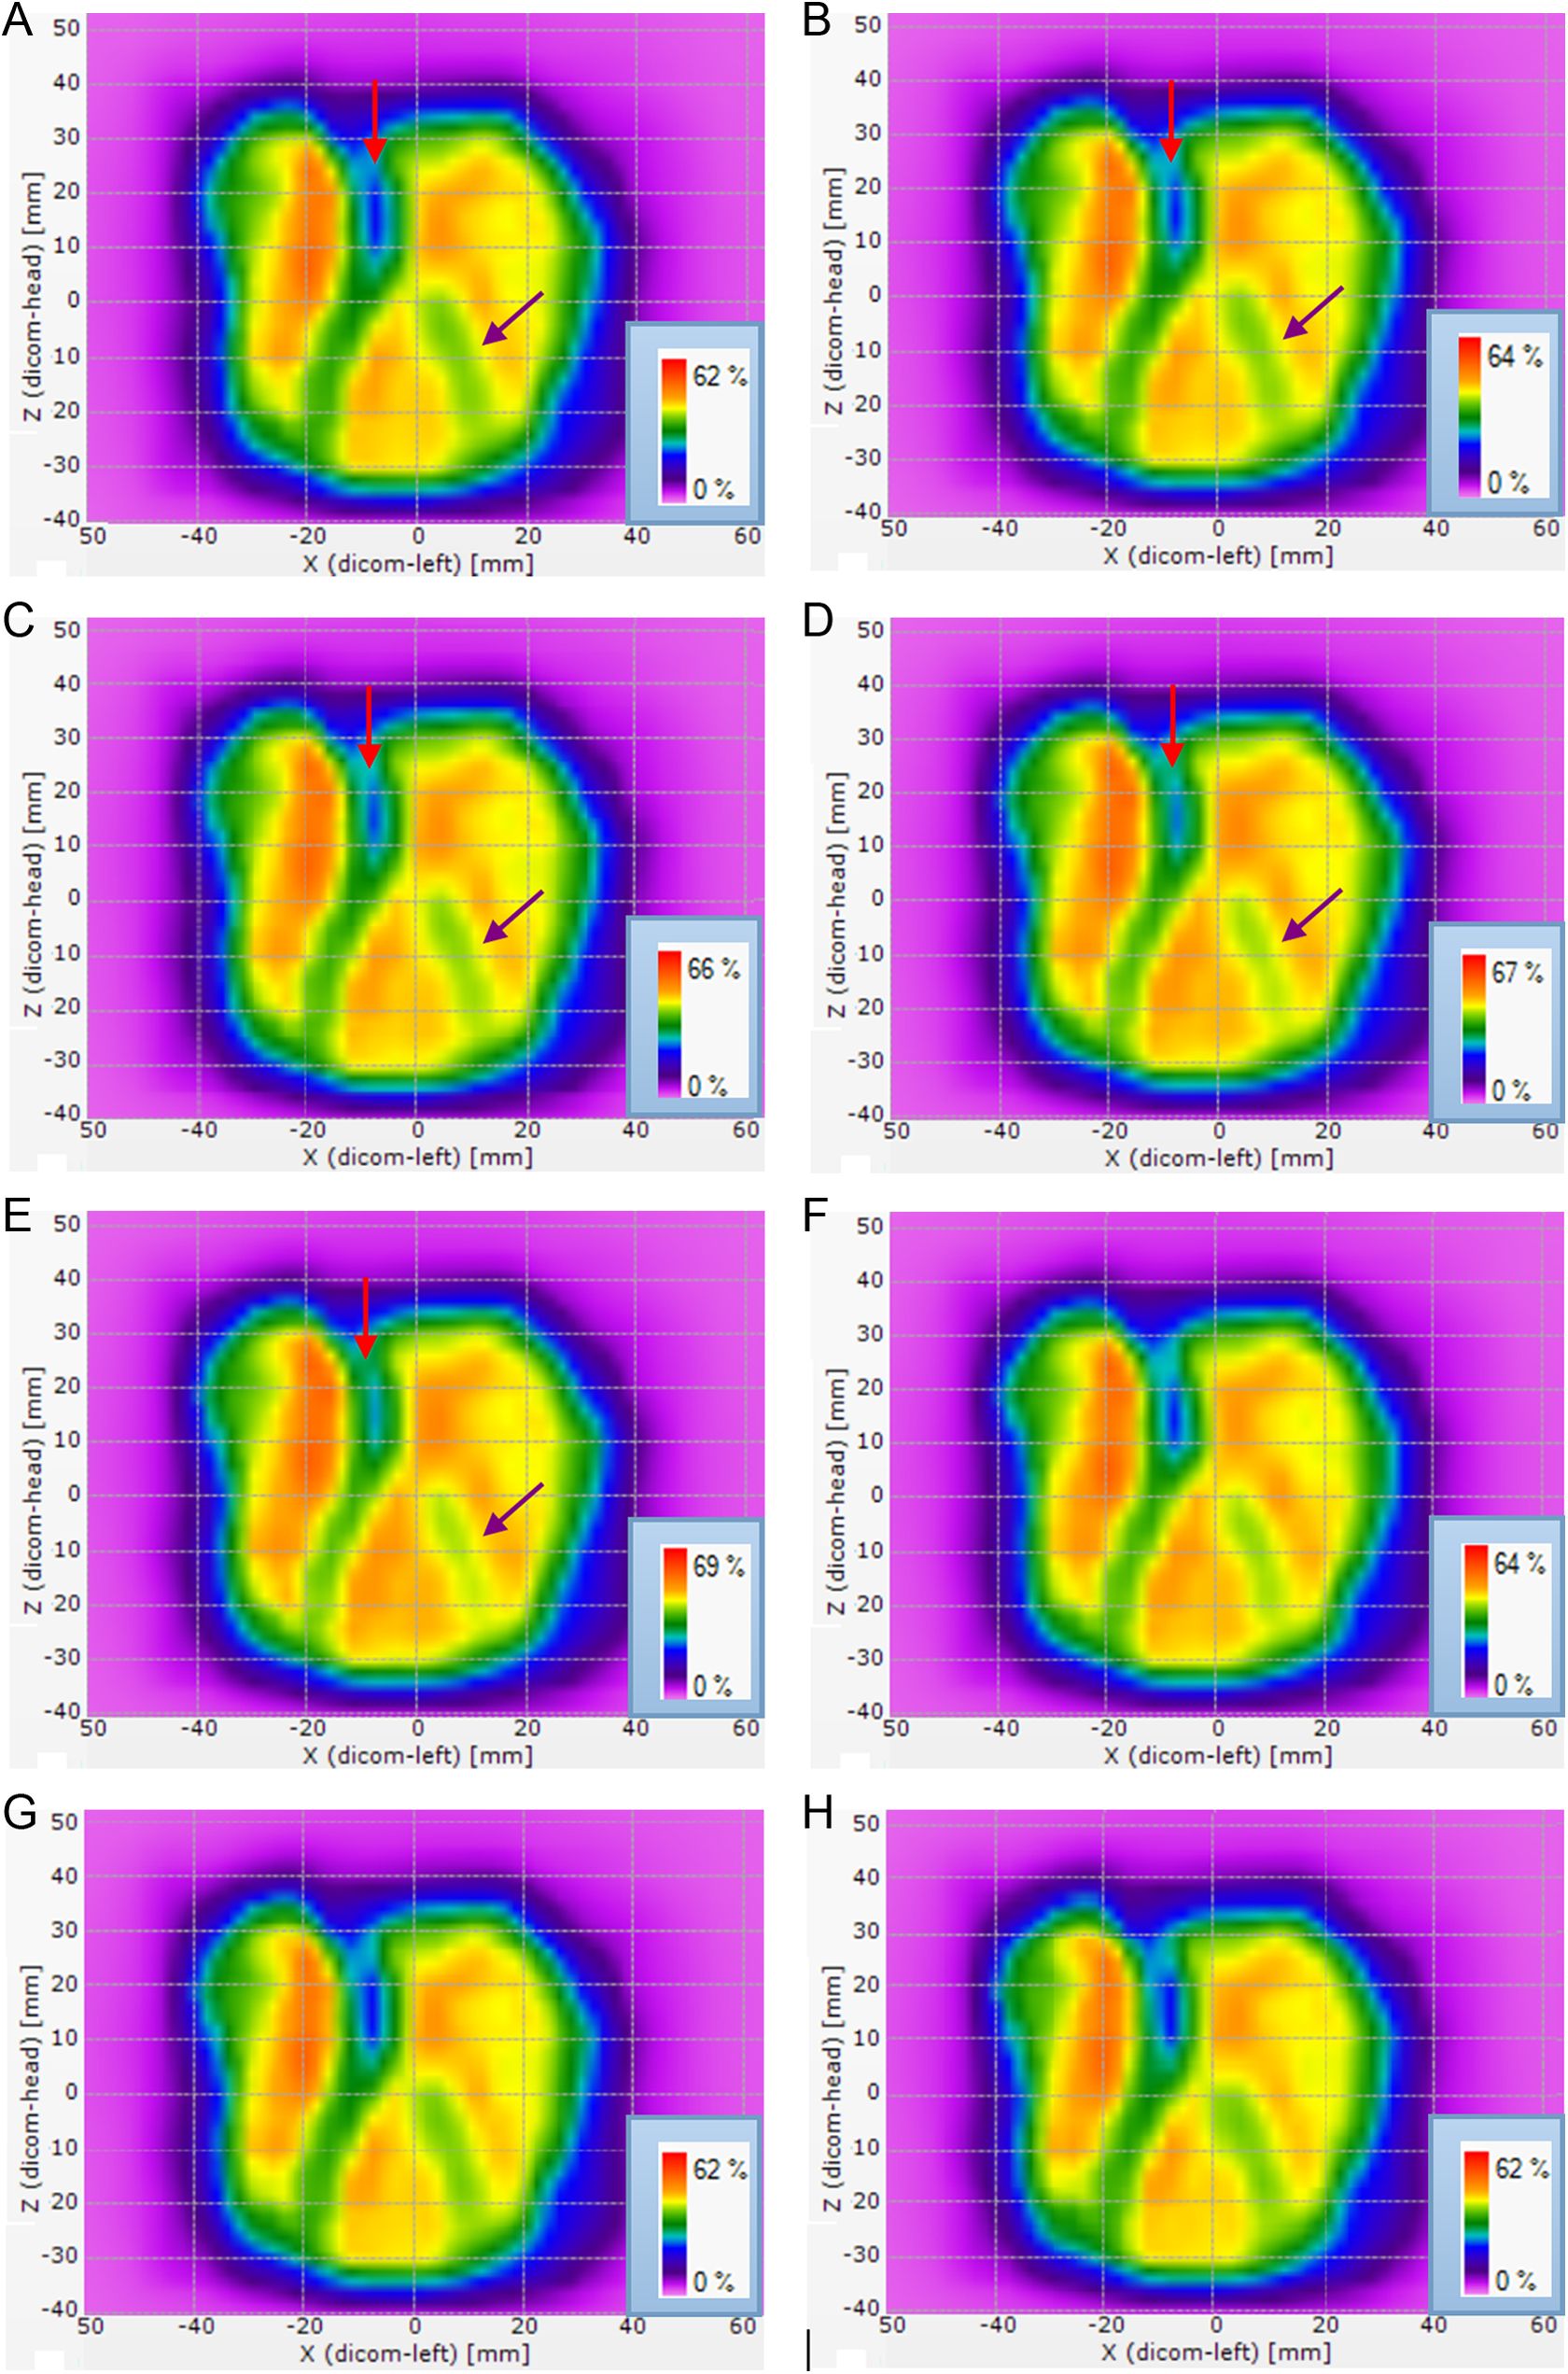
Delt verification of the dose distribution scheme: (A) original, (B) open 0.25 mm, (C) open 0.50 mm, (D) open 0.75 mm, (E) open 1.00 mm, (F) random 0.8 mm, (G) gravity −0.50 mm, and (H) gravity −1.00 mm.
Figure 7F shows that the maximum dose of random 0.80 mm was similar to that of open 0.25 mm, but the pass rate was higher than that of open 0.50 mm and lower than that of open 0.25 mm. This finding was related to the random error of MLC caused by random series but not to the system error.
Discussion
In the 2.00 × 6.00 cm field with 2.0 mm/2.0% as the statistical standard, the pass rate of the original was 86.2%, which was lower than the usually defined pass rate (90%). 12 With 1.5 mm/1.5% as the statistical standard, the pass rate increased within 0.4 mm from 57.1% (outside 0.00 mm) up to 66.0% (outside 0.40 mm). Therefore, 2.0 mm/2.0% and 1.5 mm/1.5% statistical standards were unsuitable for comparing the pass rate. In the 7.00 × 6.00 cm field, the pass rate under 1.0 mm/1.0% statistical standard could not linearly reflect the system misalignments of MLC within 0.6 mm and was thus unsuitable for comparing the pass rates.
The comparison between Figures 3 and 4 showed that the verification pass rate of different field doses significantly differed in terms of the MLC misalignments with similar geometrical sizes. In the 7.00 × 6.00 cm field, the pass rate was significantly higher than that of the 2.00 × 6.00 cm field. Therefore, the pass rate was related to the size of the original. In the fields with high area, the proportion of the differences in the area caused by MLC position error accounted for the decreased field dose, producing high pass rate. However, another important factor that affected the pass rate was related to the spatial distribution position of the Delt 4 detector. The small fields were verified using a 0.50 cm distance between the detectors, and the large fields were verified using a 1.00 cm distance between the detectors.
Although a field or a planning verification pass rate cannot accurately reflect the dosimetric error of patients, 13 the error of dosimetry is mostly discovered by comparing the verification pass rate using the existing method. 14,15 In the early development of IMRT, the criterion of γ analysis of 3.0 mm/3.0% is used for dose verification of IMRT treatment planning. 16 -18 Some scholars believed that the 3.0 mm/3.0% standard cannot be used to detect MLC misalignments. Heilemann et al 12 postulated that the 90% pass rate obtained when using 2.0 mm/2.0% standard based on γ analysis is suitable for evaluation of RapidArc treatment Varian Co. Ltd. (USA) results of MLC misalignments. This study suggests that the γ analysis standard should be changed correspondingly for different field sizes to ensure improved sensitivity in detecting the MLC position on the basis of 90% pass rate.
The TPS calculation results of spine SBRT showed that PTV V18 minimally changed in open 0.25 mm, open A 0.25 mm, gravity 0.25 mm, and random 0.20 mm. In comparison with the original, the PTV mean of open 0.25 mm, open A 0.25 mm, gravity 0.25 mm, and random 0.20 mm increased by 3.9%, 2.0%, 0%, and 1.8%, respectively. The maximum PTV increased by 4.0%, 1.6%, 0.4%, and 1.7%, respectively. The maximum spinal cord doses increased by 10.5%, 8.3%, 7.2%, and 7.3%, respectively. The changes in the amount of spinal cord dose were the highest. In vertebral SBRT, small changes in the MLC position can improve the maximum spinal cord dose and change the dose of PTV. Radiation-induced myelopathy will be occurred in the excess of the spinal cord dose. 19 Therefore, an accurate assessment of the spinal cord dose is necessary in radiotherapy. Dose tolerance requirements of reirradiation and radiation for spinal cord are not the same. 20 Spinal cord tolerance dose is not well defined in terms of either the end point definition or the dose/fractionation schedule yielding such. 21
The verification dose of Delt 4 showed that 3.0 mm/3.0% mm or 2.0 mm/2.0% statistical standard was unable to differentiate all results, particularly the submillimeter level of error through the pass rate, caused by simulating the MLC displacement within 1.00 mm. At lower than 3.0 mm/3.0%, the pass rate of the whole gravity series was higher than 95%. The position system errors of MLC, including the pass rates of open 0.25 mm, open A 0.25 mm, and open A 0.50 mm, were higher than 95%. For the random misalignments of MLC, the pass rates of random 0.20 mm and random 0.50 mm were also higher than 90%. With 1.5 mm/1.5% as the statistical standard, all of the pass rates, including that of the original, were lower than 70%. Therefore, 1.5 mm/1.5% was an unsuitable statistical standard. The pass rate of the whole gravity series was higher than that of the other methods of MLC misalignments. This phenomenon could be attributed to the small influence of gravity on the overall dose distribution. The position of dose distribution was translatory, whereas the sensitivity of Delt 4 on slight displacement of the dose distribution was low.
Although the 2 panels of Delt 4 can simultaneously acquire data, the detection sensitivity on small error was higher than that of the 2D matrix constituted by 1 panel. 12 However, this study showed that Delt 4 cannot distinguish the serious consequences caused by all MLC position derivation by selecting the statistical criteria in SBRT treatment of vertebral body. With 3.0 mm/3.0% as the statistical standard, the pass rate higher than 90% was set as the threshold and the position derivation of MLC was higher than the dosimetric difference caused by open 0.50 mm, open A 0.75 mm, and random 0.80 mm. With 2.0 mm/2.0% as the statistical standard, the position derivation of MLC was higher than the dosimetric difference caused by open 0.25 mm, open A 0.50 mm, and random 0.50 mm.
Oliver et al 22 postulated that the opening/closing position error of the MLC system should be lower than 0.60 mm for the head and neck cancer to ensure the deviation of the PTV V70 within 2%. This study showed that the open misalignments of the MLC system were within 1.00 mm. The PTV V18 derivation was within 1.0%, but the amount of open 1.0 mm spinal cord increased by 47.7% than that of the original. In SBRT treatment of the spinal cord, the misalignments of MLC should be controlled within 0.25 mm or even smaller because the dosimetric differences caused by the MLC misalignments were difficult to obtain using a 3D dose verification instrument. This finding presented challenges for establishing a correction method for daily MLC. A further increased number of sampling points of the 3D dose verification instrument or film measurements will probably be used to get the difference between the corresponding 3D dose distribution measured and the dose distribution of the TPS with the highest spatial resolution in SBRT.
Conclusion
Delt 4 was used to select the different analysis standards for different field sizes to ensure the improved detection sensitivity of the MLC position on the basis of 90% pass rate. In SBRT of vertebral body, the submillimeter level misalignments can result in serious consequences. With 3.0 mm/3.0% as the statistical standard, the pass rate higher than 90% was set as the threshold. The misalignment position shift was lower than the dosimetric differences caused by open 0.50 mm, open A 0.75 mm, and random 0.80 mm. With 2.0 mm/2.0% as the statistical standard, the dosimetric differences caused by the position derivation of misalignments cannot be observed. However, some position derivations of the misalignments that caused high dose amount to the spinal cord cannot be obtained.
Footnotes
Declaration of Conflicting Interests
The author(s) declared no potential conflicts of interest with respect to the research, authorship, and/or publication of this article.
Funding
The author(s) received the following financial support for the research, authorship, and/or publication of this article: China Postdoctoral Science Foundation funded project (Grant no. 2014M560323) and the municipal social development project of the Changzhou City, Jiangsu Province, China (Grant no. CJ20130019).