
Abstract
Background and Purpose:
During radiation treatment, movement of the target and organs at risks as well as tumor response can significantly influence dose distribution. This is highly relevant in patients with pancreatic cancer, where organs at risk lie in close proximity to the target.
Material and Methods:
Data sets of 10 patients with locally advanced pancreatic cancer were evaluated. Gross tumor volume deformation was analyzed. Dose changes to organs at risk were determined with focus on kidneys both without adaptive radiotherapy compensation and with replanning based on weekly acquired computed tomography scans.
Results:
During irradiation, gross tumor volume changes between 0% and 26% and moves within a radius of 5 to 16 mm. Required maximal dose to organs at risk for kidneys can be met with the current practice of matching computed tomography scans during treatment and adjusting patient position accordingly. Comparison of the mean doses and V15, V20 volumes demonstrated that weekly replanning could bring a significant dose sparing of the left kidney.
Conclusion:
Manual matching with focus on bony structures can lead to overall acceptable positioning of patients during treatment. Thus, tolerance doses of organs at risk, such as the kidneys, can be met. With adequate margins, normal tissue constraints to organs at risk can be kept as well. Adaptive radiotherapy approaches (in this case with weekly rescanning) reduced dose to organs at risk, which may be especially important for hypofractionated approaches.
Keywords
Introduction
During radiation treatment (RT), motion of target and organs at risk (OARs) as well as tumor response can significantly influence dose distribution. With modern radiation therapy, however, precise dose deposition and sparing of normal tissue is a main goal. Thus, modern radiation machines are combined with imaging to provide daily/weekly online imaging for patient positioning and tumor response monitoring. 1
For patients with locally advanced pancreatic cancer (LAPC), organ movement, elastic deformation during treatment, and anatomy changes can contribute to inhomogeneity and potentially increase toxicity, especially in cases when dose-escalation schemes are planned. Therefore, detailed analyses of motion and responses during treatment are required. Ideally, data on motion and treatment monitoring can in the end automatically be combined with other clinical information for evaluation.
Conducting such clinical evaluations is rather difficult in radiation oncology. As mentioned previously, 2 –4 heterogeneous, distributed, voluminous amounts of data arise. This creates high complexity and involves considerable time and effort for analysis. 5,6 Therefore, we connected analysis tools for an advanced evaluation to our in-house documentation system for immediate analysis of the collected data in an understandable, transparent, and reproducible way.
Neoadjuvant radiochemotherapy is an established approach for downsizing tumors in patients with LAPC. 7,8 Modern combinations of imaging with radiation devices open the horizon for image-guided radiotherapy (IGRT): By defining subareas of target volumes and by characterization of organ motion, doses can be increased further without increasing the risk of side effects. In this context, the evaluation of gross tumor volume (GTV) changes and organ motion analysis is a highly relevant subject currently assessed in pancreatic cancer research. 6,9,10 To date, few data are available on the size and deformation of the tumor during a course of radiation. Especially with the advent of modern dose-escalation schemes or the use of particle therapy, knowledge of tumor configuration, volume development, and, ultimately, real-time adaptation to these changes is necessary. We therefore implemented the newly designed database and review tools to address the mentioned research questions. Thus, the aim of the present analysis was to evaluate morphological tumor changes and organ variability during neoadjuvant radiochemotherapy as well as to analyze and identify the potential impact of these changes on dose distributions using photon irradiation during treatment. Interfractional computed tomography (CT) scans acquired as image guidance with an in-room CT-scanner immediately before irradiation were analyzed to assess variations in the GTV and OARs. Moreover, we sought to determine organ motion and elastic deformation of the tumor, as well as motion of surrounding OARs and the potential influence of that on doses to tumor and normal tissue.
Methods
The data sets of 10 patients with LAPC were randomly chosen and included into the present analysis. We chose these patients from a large group of patients with pancreatic cancer. The inclusion criteria included that patients completed treatment without interruptions, and that weekly CT images were available for analysis. Patient characteristics are shown in Table 1. These patients are a subgroup of the previously published cohort by Combs et al 8 treated at the Department of Radiation Oncology at the University Hospital Heidelberg in the Clinical Cooperation Unit Radiation Oncology at the German Cancer Research Center (DKFZ) from 2003 to 2010. The data analysis is very time consuming, since a multitude volumes need to be delineated. Therefore, we restricted the analysis to 10 patients, which is a frequent and solid number to answer questions such as the ones addressed within this evaluation. The study is in compliance with the Helsinki Declaration (Sixth Revision, 2008). A vote by the independent Ethics Committee of the Medical Faculty, Heidelberg, has been obtained (Ref. Nr.: S-483/2011).
Patient characteristics.
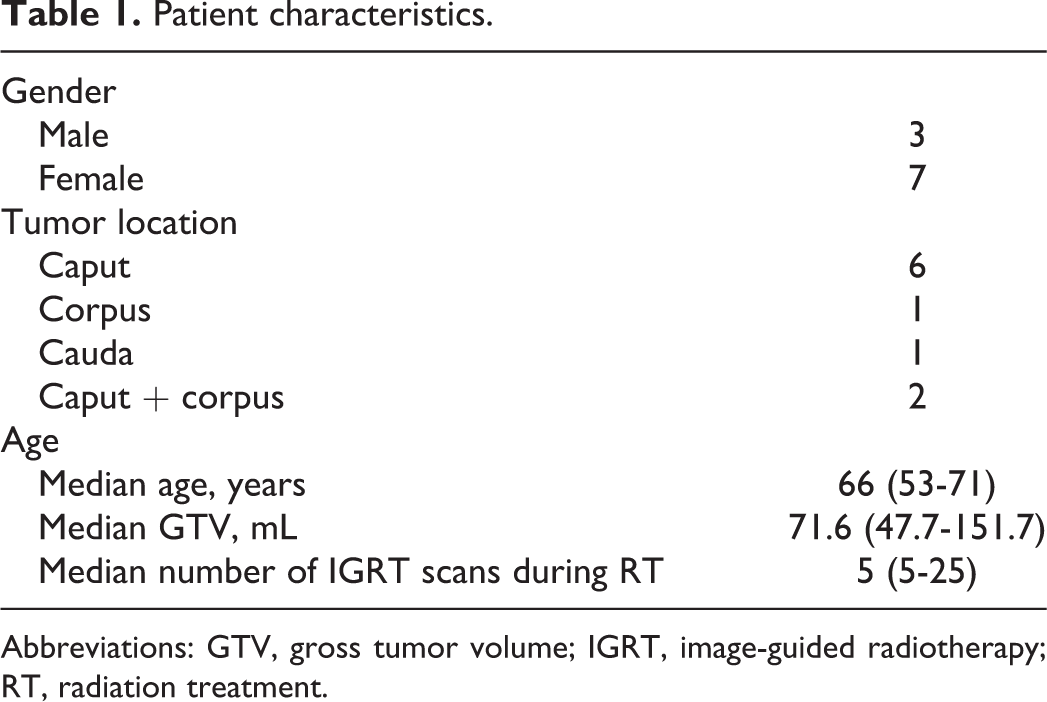
Abbreviations: GTV, gross tumor volume; IGRT, image-guided radiotherapy; RT, radiation treatment.
Patient Treatment and IGRT
For all patients, interfractional CT scans performed at least once per week were available to assess variations in the GTV and OARs as well as adaptive radiotherapeutic (ART) approaches. Organ deformation and motion were analyzed based on the GTVs; further, the effect of ART on OARs was examined. For this purpose, we delineated the GTV as well as OARs on five CTs performed for positioning during the course of treatment. For the kidneys, especially the V15 and V20 volumes provide interesting indications for under- or overdosage in OARs according to current guidelines. 11
All patients received intensity modulated radiotherapy (IMRT) with 54 Gy in 25 fractions and an integrated boost using the Virtuos (DKFZ, Heidelberg, Germany) treatment planning system (TPS). Accordingly, a median single daily dose of 2.16 Gy was applied. For treatment planning, contrast-enhanced multislice CT imaging with a slice thickness of 2 mm was acquired and fused within the TPS. The GTV was defined as the macroscopically visible primary tumor. For the clinical target volume (CTV) surrounding lymph nodes and areas of lymphatic spread were included adding about 2 to 3 cm in all directions. Further 3 to 5 mm were added for the planning target volume (PTV).
IGRT was acquired as a free-breathing, kilovoltage (kV) CT with an in-room scanner (CT on rails; Siemens, Erlangen, Germany) performed with regular image guidance procedures. The CT acquisitions and treatment were performed in a supine position in individual fixation with vacuum bags and knee-foot rests. Five weekly noncontrast CT scans taken immediately prior to treatment were used for this analysis. The CTs were selected with a minimum of 3-day interval and a maximum of 7-day interval. Table 2 shows the exact chosen fractions (one per week of treatment) for each patient.
GTV statistic for each patient.a

Abbreviations: CT, computed tomography; fx, fraction; GTV, gross tumor volume; inter, intersection; pt, patient; vol, volume.
a(1) GTV of each fraction and planning (PL) CT; (2) intersection volume of each GTVfx with GTVini; (3) union volume containing all GTVfx; (4) margin for containing 100% of all GTVfx; and (5) margin for containing 99% of all GTVfx.
The number of patients and on-treatment images per patient was limited due to the availability of IGRT images stored on the local PACS (Picture Archiving and Communication System) and the availability of the radiation plans (only printed copies were stored).
Analysis Workflow
Analysis workflow was performed in four steps as follows.
Image registration
In this evaluation, rigid image registration of the interfractional CT scan was performed manually focused to bony structures within the Virtuos TPS system. Because the CT scans were already matched during the treatment period, registration results had only to be checked and minimally adapted if necessary.
Segmentation
Segmentation was the most time-consuming step in this evaluation. First, an advanced radiation oncologist, familiar with pancreatic tumors, delineated the GTVfx volumes on the five fraction CT scans as the macroscopically visible primary tumor. Further, the left and right kidneys were carefully segmented for all 10 patients on all slices of all interfractional CT scans. At the end, all new and old structures were saved in one single RT structure set. The same radiation oncologist was used for all segmentations to minimize interobserver variability.
Dose calculation and replanning
Based on the segmented volumes and for the other significant VOIs (volume of interest), the dose volume histogram (DVH) statistic was calculated including basic values such as min, max, and mean dose; volume; and standard deviation.
For data acquisition, we used our in-house documentation and analysis system, 2 containing all relevant patient information (such as information about radiation therapy, diagnostic images, dose distributions, and basic therapy data). For the dose statistic calculations, the Analysis of Variations in Interfractional Radiotherapy (AVID) framework 6 was used. It provides dose analysis tools for calculating dosimetric variances of defined VOIs from any given RT structure set matched to the control CT. The dose statistic tool is a command line tool with XML-based configuration options. This is highly convenient if a large number of calculations are to be executed. It uses the RTToolbox 12 to determine dosimetric variances—a dedicated dose analysis library developed at the German Cancer Research Center (DKFZ) containing analysis routines for descriptive dose statistics parameters together with DVHs. To ensure a precise dose analysis, voxelization is computed on several resolution levels to ensure all calculations have subvoxel accuracy.
Gross tumor volume and OAR analysis
To determine the GTV motion during treatment, first intersection volumes GTVini were calculated and compared to GTVfx. During that process, no major changes were observed, hence, additionally the exact range of motion was determined. For that the original GTVini was circumferentially expanded within the TPS system until it contained all GTVfx volumes. Hence, the margin determines the maximal motion in all directions.
Based on the weekly interfractional CT scans, replanning was simulated by computing new plans automatically compensating tissue densities and without changing original dosimetric parameters/constraints. For that the primarily used Virtuos, TPS was used. All resulting statistical calculations and plots were performed using SPSS Statistic software (IBM, USA).
Results
Moderate GTV changes in volume over time were observed from planning CT to the final week of RT (0%-26%). Data show no statistically significant changes. Initial GTV (GTVini) ranged from 44.9 to 151.8 mL, and the absolute volume change during treatment (GTVfx) ranged between 74% and 110% of its initial volume (see Figure 1). However, the GTV changed more the further the therapy had progressed. At week one and toward week three/four, larger changes do occur. Intersection volumes comparing GTVini to GTVfx were between 71% and 100% and 35.2 and 151.3 mL (see Table 2). Weight loss was only minor (mean 2.6 kg, range 0.6-5.0 kg) during treatment in all patients. Weight before RT ranged from 55.5 to 79.0 kg (mean 63.3 kg), after RT from 54.5 to 76.5 (mean 62.7).
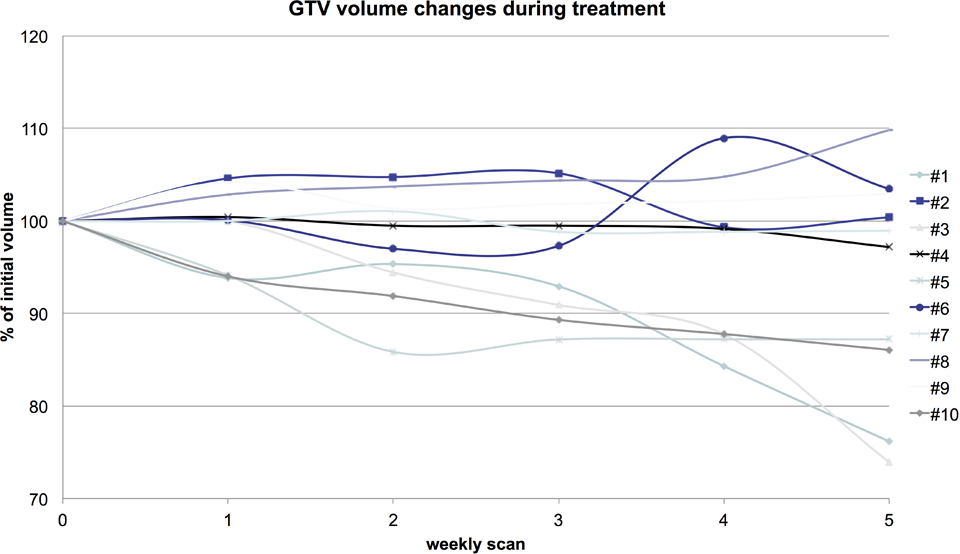
GTV changes during treatment.
The uniform margin to the GTVini volume aiming to incorporate all GTVfx was calculated. It ranged from 5 to 16 mm for actual including 100% of all GTVfx volumes; however, it reduced to 2 to 11 mm for including only 99% of all GTVfx (see Table 2). The GTVunion volume itself containing all GTVfx ranged from 55.5 to 152.8 mL.
First, we delineated all kidneys. Afterward five new plans were computed based on the chosen interfractional CTs. These new plans were used to automatically calculate a total of 480 (10 patients, 2 kidneys, 6 fractions, 2 Vx-calculations, and 2 plans [original and replan]) separate dose statistics by the AVID framework.
Only small changes in the dose applied to the kidney volume were observed. Figure 2 illustrates the dose ranges for both kidneys. During treatment planning, a maximal dose of 15 Gy for kidneys, according to Emami et al, 11 is generally accepted. The data show that in the current treatment setup, these doses can be met without exceeding the dose constraints. Figure 2 shows that the applied dose ranged from 4.69 to 14.51 Gy in the right kidney and from 5.21 to 12.91 Gy in the left kidney.

Box plot of the left and right kidneys of all patients showing the dose changes during treatment. The bar in the middle of each box is the median dose (Gy); the whiskers represent the lowest/highest value still within the 1.5 interquartile range; the bottom and top of the box are the first and third quartiles. Outliners are marked as a circle or star.
Results demonstrated that weekly replanning could bring a significant benefit. Dose varied only minimally from 4.67 to 14.33 Gy in the right kidney and from 5.21 to 12.88 Gy in the left kidney (right kidney: 1.39%-2.67%; left kidney: 2.15%-4.41%) for the original plan and replanning. Table 3 characterizes the comparison of the mean doses and V15, V20 volumes (Vx = volume containing x% of the prescribed dose). A paired t-test was performed. The P value of .005 showed a significantly improved dose sparing of the left kidney, however, the same was not observed for the right kidney. Both V15 and V20 volumes were not significantly lower after replanning. On the contrary, both showed similar results for the left kidney in V15 (82.26% vs 81.90%) and V20 (23.64% vs 23.44%) and minimal lower results for the right kidney in V15 (47.02% vs 47.24%) and V20 (28.21% vs 28.22%).
Statistical comparison of the mean dose and V15, V20 in the left and right kidneys from all included patients.

Abbreviation: RT, radiation treatment.
Discussion
Even small changes in tumor volume and shape during chemoradiation of patients with LAPC can have a significant impact on RT. Over the course of irradiation, GTV ranged from 74% to 110% of its initial volume and moves within a radius of 5 to 16 mm, leading to significant under- or overdosage of treatment volumes. Additionally, changes in OARs can occur during treatment. Precise image guidance can help improve the therapeutic window. The present results of a weekly replanning strategy could lead to significant reduction in dose to OARs. Looking at the pure doses, in the first step, this may not be clinically relevant (see Table 3, mean dose left kidney of 7.95 vs 7.91 Gy). However, keeping in mind long-term side effects as well as the principle to stick to the goal or ALARA (As Low As Reasonably Achievable), and taking into account that in the future high-dose escalation strategies or the use of particle therapy will be followed, even minor changes in dose to OARs can become clinically meaningful. A prospective randomized clinical trial with actual replanning and a larger patient number will provide more meaningful results.
We minimized interobserver variability by using the same oncologist in a short period of time to delineate all volumes. However, this was not always done by the same person as for the initial planning some time before the analysis. With a prospective approach, this impact could also be further minimized.
Adaptive radiotherapy aims to spare OARs, especially in abdominal tumor regions, such as the pancreas, which are under constant movement. Comparable results were observed between IGRT and weekly replanning.
Computerized tomography is still known to be the best diagnostic test for pancreatic cancer. It is also best for disease staging and has 80% accuracy for prediction of resectability. 13 Magnetic resonance imaging (MRI) is rarely used, mostly in patients with intolerance of contrast agents, and positron emission tomography (PET) is rather poor for primary diagnostics. For this reason, the planning CT as well as representative IGRT CT scans were chosen. We selected five fraction CTs with about the same frequency. However, this limited our patient cohort. Image guidance was not performed “weekly” in all cases, regularity and intervals varied. For instance, some patients receive IGRT daily, others once a week.
For IGRT of LPAC, minor GTV changes in volume over time are observed; hence, volume changes are of minor relevance. However, changes caused by elastic deformation of the tumor and surrounding OARs do occur. The present analysis could show that within ranges of 16 mm, the GTV is covered during the whole treatment course and required doses can be met. This is in accordance with previous published data. 9,14
Manual matching with focus on bony structures can lead to overall acceptable positioning of patients with pancreatic cancer during a treatment cycle. Thus, tolerance doses of OARs, such as the kidneys, can be met with our approach. With adequate margins, normal tissue constraints to OARs can be kept as well. The ART approaches (in this case with weekly rescanning) reduced dose to OARs, which may be especially important for hypofractionated approaches. However, when further dose-escalation strategies are implemented, organ movement correction becomes more important; thus, also smaller changes as observed in the present work become more relevant and require correction methods.
However, for further dose escalation, especially when targeted only to the GTV or to defined high-risk regions, such as PET-positive areas with very small margins, more adaptive approaches including dose delivery to the deformed volume are necessary. Such work is currently under way. In terms of patients with pancreatic cancer, weekly ART replanning approaches have the potential to reduce dose to OARs. However, online motion management as well as immediate online replanning based on daily changing anatomy has the greater potential to reduce dose to OARs, hence, leading to a smaller rate of radiogenic toxicity.
The next research focus must lie in using 4D-CTs to evaluate tumor movement and organ variability, as the tumor and especially kidneys move substantially with breathing. In other oncological entities as well, such as head-and-neck, prostate, or bladder cancer, ART is of high interest. Different approaches are currently being explored such as weekly or daily replanning/reoptimization strategies, “plan of the day” concepts, intra- and interfractional dose adaption, or replanning based on cone beam or regular CT scans.
Schwarz et al. 15 analyzed patients with head-and-neck cancer and stated that even with good image guidance and daily adaption of patient positioning some tissue deformations or overall technical uncertainties cannot be overcome. They compared daily IGRT based on regular CTs with a non-IGRT treatment and found the IGRT approach resulted in better target coverage and sparing of normal tissue. Daily replanning would be a very time-consuming task and not realizable in daily clinical routine. Weekly replanning might be a compromise as shown in a recent study by Stoll et al. 16 First work has been done with special fast replanning strategies by Li et al. 17 Also radiation concepts by daily choosing the best plan from a precalculated plan library show promising results. 18,19 However, it remains an open question which strategy is the best. Certainly, it will depend on the tumor region, and patient individuality is required.
Analysis tools were adopted and directly connected to an existing patient database providing a system to extract quantitative parameters and assist fast analysis. Documentation and evaluation take place in one single system (“one platform approach”). The idea to tie analysis tools directly to a documentation system or through software interfaces and bring them in the desired context is a promising approach for cancer analysis even in a large-scale context. 6 This way, analysis procedures use already existing data from a documentation system, process it, and create new information, which can be possibly used again for future analyses.
Conclusion
Given the increasing use of ART associated with the availability of frequent imaging during the course of radiotherapy, the issue of adaptive replanning becomes increasingly important in IGRT. Validation on our patients with pancreatic cancer demonstrated data well in accordance with previously published data and could contribute to in-house optimization of subsequent study concepts based on an improved and validated target volume definition. For dose-escalation studies, close monitoring of tumor shrinkage during treatment as well as elastic deformation could be of high importance to minimize toxicity. Thus, further replanning or ART algorithms with quick response times to changes in tumor and normal tissue geometry are required for fast and clinically useable applications.
Footnotes
Declaration of Conflicting Interests
The author(s) declared no potential conflicts of interest with respect to the research, authorship, and/or publication of this article.
Funding
The author(s) received no financial support for the research, authorship, and/or publication of this article.