
Abstract
Computed tomography (CT) scans are of high clinical value as a diagnostic technique, and new applications continue to be identified. However, their application is challenged by emerging concerns regarding carcinogenesis from their radiation. Recent articles made a significant contribution to the above-mentioned concerns by reporting evidence for direct association of the radiation from CT scans with cancer. Such interpretation of the data has already been criticized; there is the possibility of reverse causation due to confounding factors. Nevertheless, such work has had a high impact, with one article being cited more than 300 times from the Web of Science Core Collection within 2 years. However, the data points on cancer relative risk versus CT dose in that article fit straight lines corresponding to the linear no-threshold hypothesis suspiciously well. Here, by applying rigorous statistical analysis, it is shown that the probability of the fit truly being that good or better is only 2%. The results of such studies therefore appear “too good to be true” and the credibility of their conclusions must be questioned.
Introduction
Computed tomography scans are an extremely valuable technique in diagnostic radiology, and new applications continue to materialize. However, during the last 2 decades their application has been challenged by emerging concerns regarding carcinogenesis from their radiation. 1,2 For instance, Pearce et al 3 recently provided a significant addition to the above-mentioned concerns by reporting, perhaps for the first time, evidence for a direct association of the radiation from CT scans with cancer. Specifically, they reported a statistically significant dependence of relative risk (RR) of leukemia and brain tumors on the radiation dose from CT scans (CT dose) in childhood. Their interpretation of the data has been criticized 4,5 because of the uncertainty of the CT doses, the lack of information on clinical data of the examined children, and the possibility of reverse causation (ie, cancers may have been caused by the medical conditions prompting the CT scans rather than by the CT dose). 6,7 Reverse causation was demonstrated, for example, by Dickman et al 8 by means of a population-based cohort study in Sweden after I131 scans. The excess cancer risk was very high when the reason for the scan was a suspicion of tumor: RR was reported as 3.5 for more than 20 years of follow-up, being as high as 6.3 for 2- to 5-year period after the scan. No excess (RR = 0.9) was reported for scans performed for “other reasons.” In spite of the criticism, the work of Pearce et al has had a very high impact with more than 300 citations from Web of Science Core Collection within 2 years (August 2014). 9
Data points on cancer RR versus CT dose in the article by Pearce et al fit nearly perfect straight lines, corresponding to the linear no-threshold (LNT) risk hypothesis. 10 Such perfect fits are known to sometimes be “too good to be true” 11 and therefore deserve special attention.
Materials and Methods
In this article, the goodness of the data fits was quantitatively estimated. The data reported by Pearce et al 3 (appendix 6) were independently fitted by LNT curves, that is, by straight lines originating from the point (0, 1)—unity RR at zero dose. The lowest dose data points were used for estimating the risk at zero dose and therefore excluded from the fit. Table 1 summarizes the exact relationship between our notation and that of Pearce et al (appendix 6).
Notations Used in This Article.
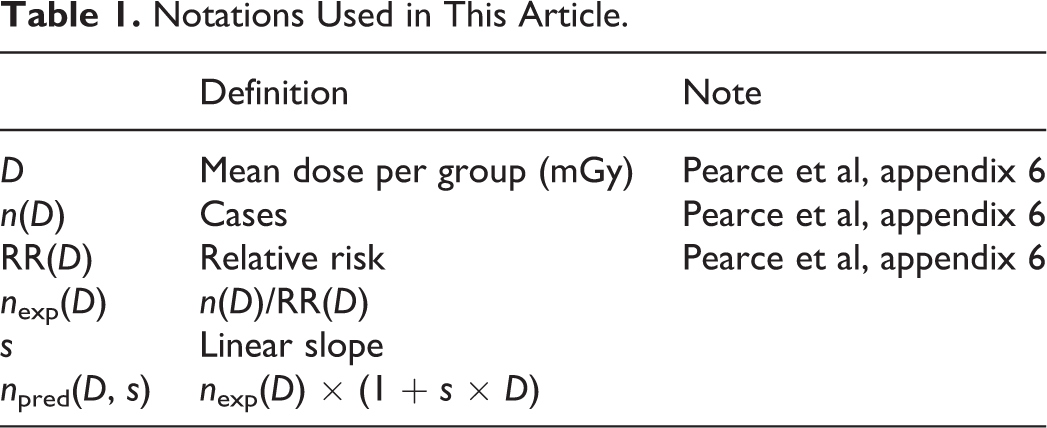
The fit was performed by the simple and transparent method of weighted least squares as follows. First, we reconstructed the expected (extrapolated from the lowest dose group) number of cancer cases nexp(D) for each dose D; this number was calculated by Pearce et al but not reported explicitly in the article. The reconstructed expected values are:


Finally, the weighted mismatch χ2,

The numerical results are summarized in Table 2 for leukemia and in Table 3 for brain tumors.
Data of Pearce et al 3 and Numerical Results for Leukemia.a

aSee Table 1 for definitions.
Data of Pearce et al 3 and Numerical Results for Brain Tumors.a

aSee Table 1 for definitions.
Results
The results of the data fit according to the LNT hypothesis are shown in Figure 1. The χ2 values are 1.19 and 2.91 for leukemia and brain tumors, respectively.

Linear no-threshold (LNT) fit of the data.
The application of the chi-square goodness-of-fit test is illustrated in Figure 2. For leukemia, appendix 6 of Pearce et al contains data on 6 dose groups. The first data group is used for risk normalization and there is 1 parameter—LNT slope s. The number of degrees of freedom is 4 = 5 − 1, corresponding to 5 independent dose groups and 1 parameter. For brain tumors (8 dose groups), the number of degrees of freedom is 6 = 8 − 2. The expected (average) values (χ2) are therefore 4.0 and 6.0, while the actual fitted χ2 was 1.19 and 2.91, respectively. The corresponding P values are .12 and .18, respectively. Here the P value is the probability that χ2 will be equal or less than the obtained value, that is, the fit will be that good or better—opposite to the common definition of P value as probability that the fit will be that bad or worse.

Chi-square goodness-of-fit test. The P values (here probabilities that the fit will be that good or better) are .12 and .18 for leukemia and brain tumors, respectively. Both P values are fair, but since the 2 data sets are expected to be independent, the resulting probability of both fits being that good or better simultaneously is 0.12 × 0.18 ≈ 0.02. This P value (.02) is below the generally assumed threshold of Pthr = .05 and should therefore be considered as “too good to be true.”
Discussion and Conclusion
The P values for both fits (.12 and .18) are theoretically acceptable but nevertheless suspicious: In practice, χ2 very rarely appears to be less than the expected (average) value due to unaccounted factors, whatever their origin. Moreover, since the 2 data sets are expected to be independent, the resulting probability of both fits being that good or better simultaneously is 0.12 × 0.18 ≈ 0.02. This is below the generally assumed threshold of Pthr = .05, and the reported data should therefore be considered as too good to be true.
Let us discuss possible source of such too-good fits. Pearce et al used complicated processing methods in their work. The CT dose, as reported in the article, was unavailable for individual patients. The dose evaluation employed elaborate modeling algorithms including Monte Carlo simulations. In such modeling, there is no escape from setting values of many parameters by judgment. It is well known, and also has been reported in the literature (see e.g., Simmons et al 13 ) that such analysis makes false-positive findings vastly more likely. One of the authors (YS) has been a participant of an unintended data adjustment in the field of particle physics. CERES collaboration at CERN (European Center for Nuclear Research) studied a weak signal masked by strong background. By directly optimizing the signal-to-background ratio, an erroneous value (roughly, 2-fold) was obtained and published. 14 Only after 10-fold data sample was collected, the error was realized and fixed. 15 The analysis of the CERES data mistreatment took several years. 16
Systematic error in dose evaluation may lead to much more severe consequences than biased values of the risk coefficient. Actually, such error may invalidate the main result of Pearce et al—the association between radiation and cancer. The following model demonstrates how a simple systematic error in dose evaluation can yield high false-positive risk, especially in the highest dose group. Suppose that the CT doses for different patients have different statistical distributions for cases with cancer and noncancer cases. Suppose, furthermore, as in Figure 3, that the dose distribution for patients is uniform for cancers (solid line) and exponential for noncancers (dotted line). Then, if for any reason, the evaluated CT doses (both cancer and noncancer) are underestimated, more noncancers than cancers will fall out of the highest dose group. The calculated risk in the highest dose group will thus be positively biased. For example, taking the exponent with scale parameter of 25 mGy for noncancers (dotted line), uniform distribution from 30 to 120 mGy for cancers (solid line), and systematic error leading to evaluation of each dose D as two-third (i.e. about 66.7%) of its actual value D0: D = 2/3 × D0, we get an artificial increase in the risk by 130% (more than 2-fold). As shown in Figure 3, the ratio of areas to the right of the dashed vertical line is 1:1 for the upper plot (proper dose evaluation) but 2.3:1 for the bottom plot (biased dose evaluation).

Model: Possible influence of systematic error in dose evaluation on calculated risk. The patients’ computed tomography (CT) dose statistical distribution is uniform for cancers (solid line); for noncancers, the distribution is exponential with scale parameter 25 mGy (dotted line; for clarity, the probability density functions are not normalized to unity). If the evaluated CT-dose is two-third of its actual value for both cancers and noncancers, then the calculated risk of patients in the dose group above 30 mGy is artificially increased by factor about 2.3.
The above-mentioned hypothetical example is for illustration only. The authors by no means claim that the above-described or any other particular error was actually made. However, based on the suspiciously high data fit goodness, it could very well be that some kind of parameter adjustment that yielded the LNT model results was, perhaps unknowingly, performed by Pearce et al. From a purely statistical perspective, the data showing an association of cancer with radiation from CT scans look “too good to be true” and therefore should be viewed with an appropriate degree of caution.
Footnotes
Abbreviations
Declaration of Conflicting Interests
The author(s) declared no potential conflicts of interest with respect to the research, authorship, and/or publication of this article.
Funding
The author(s) received no financial support for the research, authorship, and/or publication of this article.