
Abstract
Raman spectroscopy has been widely used in biomedical research and clinical diagnostics. It possesses great potential for the analysis of biochemical processes in cell studies. In this article, the surface-enhanced Raman spectroscopy (SERS) of normal and cancerous liver cells incubated with SERS active substrates (gold nanoparticle) was measured using confocal Raman microspectroscopy technology. The chemical components of the cells were analyzed through statistical methods for the SERS spectrum. Both the relative intensity ratio and principal component analysis (PCA) were used for distinguishing the normal liver cells (QSG-7701) from the hepatoma cells (SMMC-7721). The relative intensity ratio of the Raman spectra peaks such as I937/I1209, I1276/I1308, I1342/I1375, and I1402/I1435 was set as the judge boundary, and the sensitivity and the specificity using PCA method were calculated. The results indicated that the surface-enhanced Raman spectrum could provide the chemical information for distinguishing the normal cells from the cancerous liver cells and demonstrated that SERS technology possessed the possible applied potential for the diagnosis of liver cancer.
Introduction
Raman spectroscopy is a label-free method for rapid and sensitive detection of changes in biomolecular composition of cells. The molecular structure changes could be detected using Raman spectroscopy without a label. 1 But the technology has been significantly limited due to the weak Raman scattering signal and high fluorescence in normal Raman spectra. 2 In recent years, the problem has been well solved with the metal nanotechnology, which promotes the development of the surface-enhanced Raman spectroscopy (SERS) technique. 3,4 Now it has been applied in various analytical areas such as environmental chemistry and biochemistry. 5 So the highly sensitive optical images can be obtained with detailed molecule level information recently. 6
Raman spectroscopy has been explored for biomedical applications because it can provide detailed information on the chemical composition of cells and tissues. 7 Raman spectroscopy could be used in the analysis of biological processes within living cells, such as cell biochemical analysis, 8 cell membranes, 9 and chromosomes. 10 And Raman spectroscopy could also be used in the analysis of tissue, such as bone quality, 11 human aorta, 12 mammalian tissue, 13 and others. 14,15
Early diagnosis of cancer affords early intervention and greatest chance of cure. During the process of the cells canceration, there are some prominent variations for conversion of a normal cell into a cancerous tumor. Changes in the protein or nucleic acid structure between the normal and malignant cells may therefore provide valuable clues to diagnose the cancerous cells. 16 In fact, the basic elements, such as protein, nucleic acid, carbohydrate, and lipid in the normal cells, are the same as in the cancerous cells, but the composition of each component, physics, and chemistry space arrangement of the molecules in these 2 classes of cells are different. Especially in the cancer cells, the ingredients for cellular structure such as nucleic acids, nucleotides, and proteins increase violently during cancerous process of the cells. 17 However, those changes can be detected from their Raman characteristic peaks. Additionally, the Raman measurement is highly reproducible and label free. Therefore, Raman analysis has been widely used in biomedical diagnosis and research. For example, the in vivo imaging of water, lipid, and protein of skin and mapping of penetration pathways of topically applied drugs in mice and humans have been done using Raman spectrum without label, 18 and Raman spectrum is a good tool for real-time diagnosis of diseases and in situ evaluation of living tissues. 19,20 The diagnostic application in cancer detection of Raman spectroscopy was reported, 21 it could be used in the diagnostic application of the breast cancer, 22,23 cervical cancer, 24,25 colorectal cancer, 26 head and neck cancer, 27 skin cancer, 28 bladder cancer, 29 gastric carcinoma, 30 prostate cancer, 31 and leukemia. 32 Many literatures reported the difference in the normal and malignant cells and tissues using the chemical method or fluorescence spectroscopy technology. 33,34 Raman spectroscopy method was also applied for the analysis in some literatures with Raman label or Raman mapping rather than SERS. 35,36
As the need for rapid cancer detection, Raman spectroscopy could confer the patient benefit with early, rapid, and accurate diagnosis. The nanoparticles such as Ag or Au, Au@SiO2, or Ag@SiO2 nanoparticles, with different shapes such as spherical, star, triangle, and diamond, were used in Raman spectra measurement as the substrates. 37 –39 The SERS measurement of the cancer cells/tissue samples has been developed with a high accuracy and sensitivity as a potential cancer diagnostic tool. 29,37,40 The SERS spectra of the blood/serum samples show that some differences exist between the normal individuals and the patients with specific cancer. 41,42 Although the blood/serum could be easily affected by the environment, the blood/serum SERS measurement has the potential to be developed as a simple method for the cancer diagnosis in the future. At present, many cancers such as breast cancer and bladder cancer were studied using the Raman spectroscopy. The liver cancer was one of the most common malignant tumors with a high rate of morbidity and mortality. The main diagnosis technology for liver cancer was the multidetector computed tomography (CT) scan or dynamic contrast-enhanced magnetic resonance imaging (MRI). 43 And some patients with cirrhosis without the imaging features were recommend to liver biopsy with the tissues stained with tumor markers. 43,44 The CT/MRI was a traditional method for the cancer diagnosis in clinical application, and the Raman spectroscopy of cells/tissues is an accuracy method; Raman spectroscopy of blood/serum would be a more simple method for the cancer diagnosis in the future. We think that it would improve the accuracy and sensitivity for the liver cancer diagnosis if the technology allied together with the Raman spectroscopy of blood/serum, the Raman spectroscopy of cells/tissues, and the CT/MRI. In this article, the SERS spectra of normal liver cells (QSG-7701) and hepatoma cells (SMMC-7721) were measured by confocal Raman microspectroscopy technology.
Materials and Methods
Preparation of SERS Substrates
The gold nanoparticles were prepared by trisodium citrate reduction method with microwave heating. The 1 mL 1% HAuCl4 solution was dipped into 100 mL deionized water and heated to boiling in microwave, then quickly dropped 1.0, 0.8, 0.5, and 0.4 mL 1% trisodium citrate solution into the above-mentioned solutions separately, so that the gold nanoparticles with the different sizes were synthesized.
Cell Culture and Sample Preparation
SMMC-7721 and QSG-7701 were the sensitive phenotypes of human hepatoma carcinoma and human hepatic cell lines, respectively. The cells were initially cultured in growth medium with different culture bottles, which composed of Dulbecco’s modified eagle medium supplemented with 10% fetal bovine serum, 100 units/mL penicillin, and 100 mg/mL streptomycin. And then cells were transferred to different cover glasses placed in 6-well plate and incubated with the SERS substrate gold nanoparticles at the volume ratio of 2:1 (medium:gold nanoparticles) for different time in the incubator at 37°C and 5% CO2. After the time in exponential growth conditions, cell samples on the cover glasses were picked up from culture medium and washed with phosphate-buffered saline for 2 times in order to remove free gold nanoparticles on the surface of the cells before measuring.
Measurement of SERS
Raman measurements were performed on the Renishaw Invia Confocal Raman Microscope system. The 632.8 nm laser was used as the excitation source, and the laser beam was focused on the single cell through an oil immersion objective lens (100× magnification) with a spot size of about 1 μm in diameter. The time of integration was 10 seconds, the output laser power was about 10 mW, and the wavelength scan range was between 500 and 1800 cm−1. To further study the difference in normal and cancer liver cells, 32 Raman spectra of normal cells and hepatoma cells were measured. Then 20 groups with clear, high ratio of signal to noise were selected for further analysis.
Results and Discussion
The SERS of the Normal and Cancerous Liver Cells
The gold nanoparticles were prepared according to the method mentioned previously, and the nanoparticles were synthesized in different sizes. The sizes were about 27, 42, 55, and 70 nm, and the transmission electron microscopy of the Au nanoparticles is shown in Figure 1.

Transmission electron microscopy images of the gold nanoparticles. A, 27 nm, (B) 42 nm, (C) 55 nm, and (D) 70 nm.
Figure 2 shows the Raman spectra of the cells incubated with the SERS substrate gold nanoparticles at the different size 27, 42, 55, and 70 nm. The results showed that the spectrum was better when the cells were incubated with the gold nanoparticles at the size of 55 nm.
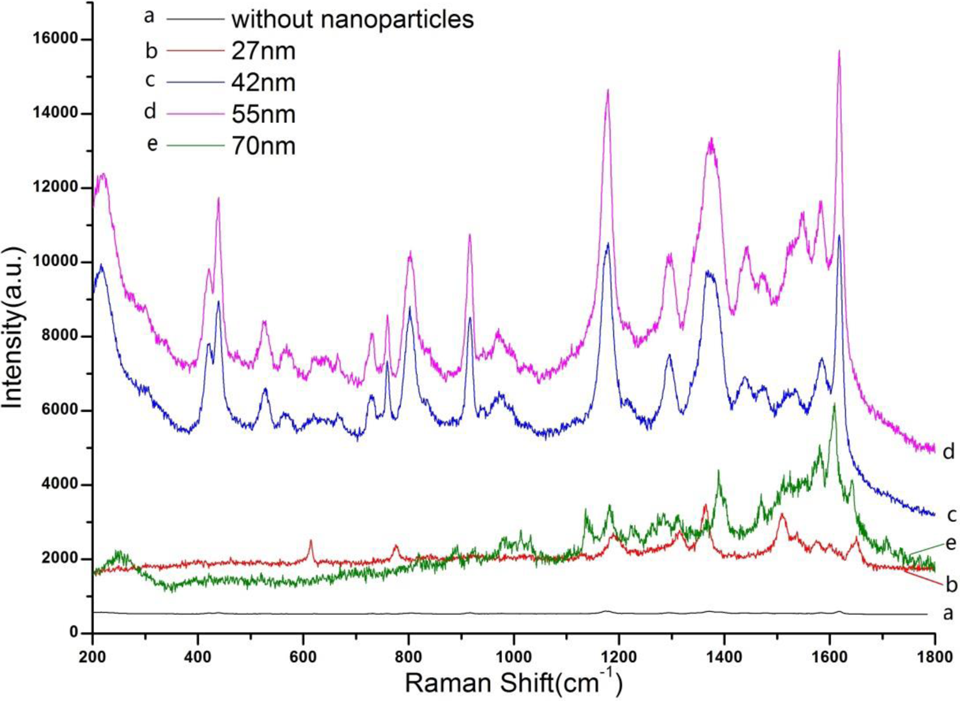
Surface-enhanced Raman spectroscopy (SERS) of the SMMC-7721 cell incubated with gold nanoparticles in different sizes.
Figure 3 shows the Raman spectra of the cells incubated with the SERS substrate gold nanoparticles for the different time 0.5, 1, 3, 6, 12, and 24 hours. The results showed that the spectrum was better when the cells were incubated with the gold nanoparticles for about 6 hours above.
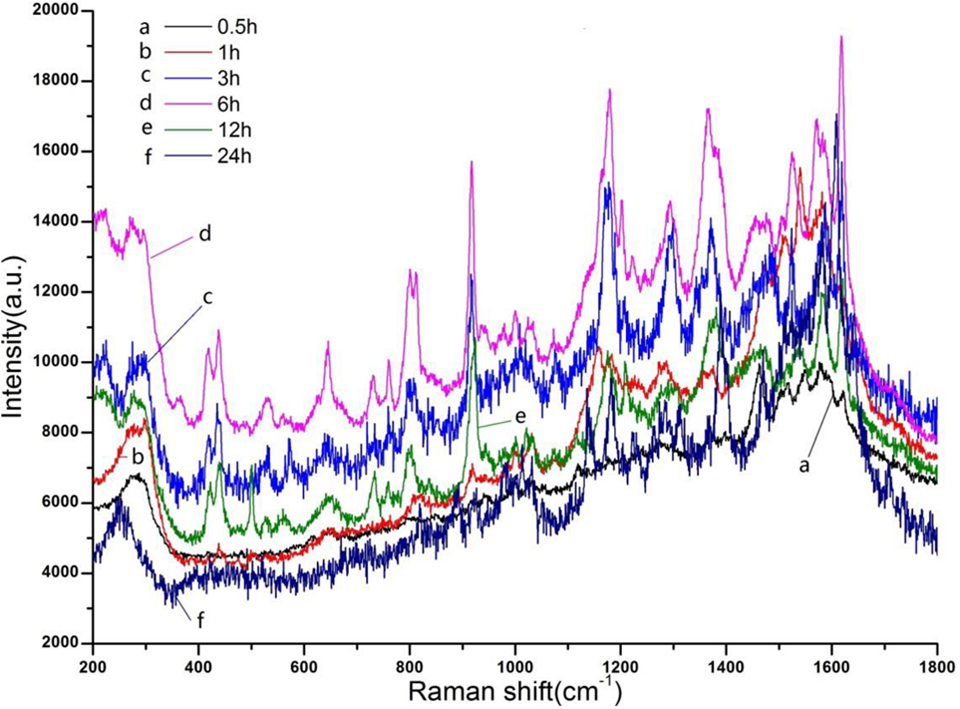
Surface-enhanced Raman spectroscopy (SERS) of the SMMC-7721 cell incubated with gold nanoparticles in different time.
The SERS spectra of the single cell (SMMC-7721 cell and QSG-7701 cell) were measured with gold nanoparticles as the substrate (see Figure 4). The results showed that the spectra of the single cell were clear and the positions of the Raman peaks were similar between the spectra of the 2 kinds of cells, but the intensity of the peaks was different. The hepatoma cells had higher SERS signal (Figure 4B), and many additional Raman peaks appeared in the spectrum of hepatoma cell. One of the reasons may be the cancer cell engulfing more gold nanoparticles than the normal cells.

The average surface-enhanced Raman spectroscopy (SERS) spectrum of (A) normal cells and (B) cancerous cells incubated with gold nanoparticle. A, The average spectra of the normal cell (QSG-7701) and (B) the average spectra of the cancerous cell (SMMC-7721).
Figure 4A shows the average spectra of normal cells (QSG-7701) and Figure 4B shows the average spectra of the hepatoma cells (SMMC-7721). The spectra contained abundant biological information of proteins, lipids, carbohydrate, and nucleic acids. 45,46 The peak assignments of the spectra are presented in Table 1.
The Raman Shift With the Corresponding Peak Assignments of QSG-7701 and SMMC-7721.

Abbreviations: δ, deformation; sym, symmetric; asym, asymmetric; Tyr, tyrosine; Trp, tryptophan; str, stretch; Pro, proline; Val, valine; def, deformation; Phe, phenylalanine; A, adenine; T, thymine; C, cytosine; G, guanine.
The spectral peak assignments of the cells are listed in Table 1. Compared with the normal cells, more peaks appeared in the spectra of the cancerous cells at 644, 877, 978, 1518, 1586, and 1662 cm−1. Many peaks were associated with protein vibrations, such as 644, 877, and 978 cm−1, which assigned to C-C twist vibration, C-C-N+ symmetric stretch of proteins, and CH3 deformation of proteins in cell, respectively. The Raman bands near 1518, 1586, and 1662 cm−1 indicated the components of nucleic acid in liver cancer cells. The Raman peak at 1518 cm−1 originated from nucleic acid nucleotides of cytosine, adenine, and guanine. The corresponding peak of protein phenylalanine and tyrosine in DNA/RNA appeared at 1586 cm−1 and the peak at 1662 cm−1 corresponded to the CH3 asymmetric deformation of amino acids in cancerous cells. These might belong to the large increase in cellular structure components such as nucleic acids, nucleotides, and proteins.
For the similar peaks in the spectra, the peaks at 937, 1209, 1402, and 1435 cm−1 might belong to the chemical bond vibration of proteins, they indicated C-C stretch α-helix of proline and valine, C-C6H5 stretch of phenylalanine and tyrosine, CH3 symmetric, and asymmetric deformation, respectively. The peak at 1276 cm−1 was generated by amide III. The peaks at 1308, 1342, and 1375 cm−1 mainly attributed to the vibration of nucleic acids, 1308 cm−1 corresponded to CH2 twist, and rest of peaks might corresponded to the base in nucleic acids, including adenine, guanine, and thymine. Although cancerous and normal cells have a lot of similar peaks, there was also much difference at 810 and 854 cm−1 in the cancerous cells. The 854 cm−1 peak represented tyrosine and proline, same as 852 cm−1 peak in the normal cells. The same results were analyzed for the 1616 and 1618 cm−1 peak. It was reasonable that the cancerous cells have 1 to 4 cm−1 Raman shift compared with the normal cells. 47 As for the peak at 810 cm−1, it reflected the C-C stretch vibration of proline and valine. It mainly resulted from the metabolism increase leading to the increase in protein activity. 17
Distinguishing the Normal From Cancerous Liver Cells With Relative Intensity Ratio
Due to many indeterminacy factors, there was no valuable significance to emphasize only the intensity of the Raman peaks. The relative intensity ratio of each spectral line could avoid the effect of the indeterminacy factor. The relative intensity ratio of the peaks was calculated for the analysis of the normal and cancer liver cells. The Raman peaks at 937, 1209, 1276, 1308, 1342, 1375, 1402, and 1435 cm−1 were taken from 20 groups of SERS spectra selected from the experimental data of the normal and cancerous cells incubated gold nanoparticles, and then the relative intensity ratio I937/I1209, I1276/I1308, I1342/I1375, and I1402/I1435 were statistically analyzed. For example, the I937/I1209 of the normal cells was taken, the Raman intensity at the peak 937 and 1209 cm−1 from the Raman spectrum of single normal cell was recorded, respectively, the intensity ratio was calculated, and it was noted as I937/I1209. 1 By this way, 20 groups’ relative intensity ratio of I937/I1209 from the normal cells was obtained. The relative intensity ratio of the I1276/I1308, I1342/I1375, and I1402/I1435 was performed, respectively, with the same way. The calculation method of 20 groups’ relative intensity of the cancerous cells was same as that of the normal cells. The distributions of the relative intensity ratio are shown in Figure 5. The horizontal axis number meant the serial number of the Raman spectra.

Distributions of the relative intensity ratio of the Raman peaks (A) I937/I1209, (B) I1276/I1308, (C) I1342/I1375, and (D) I1402/I1435.
Sensitivity and specificity were used to characterize the data of 2 classification test features in statistics. 48,49 Sensitivity was the ratio of true positivity to the sum of false negative and true positivity, specificity was the ratio of true negative to the sum of true negative and false positive. In this article, the cancerous cells were taken as “sick,” being namely positive, and the normal cells as “anosis,” being namely negative. Figure 5 shows that the relative intensity ratio of the Raman peaks obtained from the SERS spectra of the cancerous cells was much higher than that of the normal cells. Set I937/I1209 = 1.462 as a standard to judge the cancer or not, there were 2 normal cells which fall into the cancer area and 1 cancer cell in the normal area. So the sensitivity was about 95% and the specificity was about 90%. In the same way, when setting the relative intensity ratio I1276/I1308 = 1.234, I1342/I1375 = 1.515, and I1402/I1435 = 1.618 as the judge boundary, respectively, the sensitivity was about 90%, 90%, and 90%, respectively, while the specificity was 90%, 90%, and 85%, respectively. No matter how much the value of relative intensity ratio was set, it always could set a value making their sensitivity and specificity rate reach more than 85%. It indicated that we could initially separate the normal and cancerous cells by this method.
Distinguishing the Normal From Cancerous Liver Cells With Principal Component Analysis
In order to improve the resolution and determine whether the same Raman peaks could be used to distinguish the normal from cancerous cells at the single cell level, a common, simple, and effective method was selected to further analyze the 8 same Raman peaks data, which was named principal component analysis (PCA). 50 Principal component analysis is a data regression method, by which large data are reduced into small number of independent variables such as principal components, namely we commonly call it dimensionality reduction. 51 It is widely used for classification. In this study, 8 Raman peaks data of 20 groups were analyzed using the PCA method by Statistical product and service solutions software, the total variance explained of 3 principal components (PCs; noted PC1-PC3) reaching to 85.41% (PC1: 47.50%, PC2: 24.68%, and PC3: 13.23%), they could be used to replace the original 8 Raman peaks to characterize the normal and cancerous liver cells. The results of the 3 principal components from the normal and cancerous liver cells of 20 groups analyzed by PCA were shown in Figure 6. The PC1, PC2, and PC3 were set as Z-, Y-, and X-axis, respectively, and the value in Figure 6 represented the factor value of the 3 principal components.

Principal component analysis (PCA) of surface-enhanced Raman spectroscopy (SERS) spectra peaks of normal and cancerous liver cells.
Figure 6 clearly shows that the PCA of Raman spectra data was in different areas, the sensitivity and specificity of this method could reach to 100%. It verified that the method of PCA could accurately distinguish the normal from cancerous liver cells. The PCA distribution area of the cancerous cells was larger than that of normal cells. It indicated that the individual differences in the cancerous cells were obvious, and the uniformity of cellular molecules was worse than that of the normal cells. And the major differentiation in the PCA lied along with PC1, relating the Raman peaks features that were being used in the discrimination to the biochemical changes, the loadings plot of PC1 to PC3 are shown in Figure 7, Var1 to Var8 represented the 8 selected Raman peaks, respectively.

The loadings plot of PC3 of the 8 Raman peaks (Var1-Var8) of normal and cancerous liver cells (A) the loading plot of 3 principal component: principle component 1 (PC1), principle component 2 (PC2), and principle component 3 (PC3); (B) the loading plot of the PC1.
Conclusions
Raman spectroscopy could produce a highly detailed biochemical “fingerprint” of the sample, and this technique is almost labor free without the need for sample preparation. Raman spectroscopy could confer great patient benefit in a clinical setting with early, nondestructive, rapid, and accurate diagnosis. 27,52 Many studies report the Raman spectroscopic detection of malignant and premalignant tissues in different sites of the body with high sensitivities, has the potential as a new tool in the clinico-oncological practice. 19 The diagnostic potential of Raman spectroscopy has been demonstrated in cancers of various organs including the esophagus, 53 breast, 54 lung, 55 bladder, 56 skin, 57 and prostate. 31
This work described the spectra investigation of single normal and cancerous liver cells using confocal Raman microspectroscopy technology. The characteristic Raman bands in the SERS spectra were analyzed for distinguishing the liver normal cells from liver cancerous cells. The relative intensity ratio of the Raman spectra peaks was set as the judge boundary, and both the sensitivity and the specificity reached more than 85%. The SERS followed by PCA method performed better in separating the 2 kinds of cells. The results demonstrated the potential application of SERS technology followed by PCA as an effective method with the advantages of rapid measurement and high sensitivity for the cancer diagnostic at the cell level. The cancer cells and the normal cells would exhibit some difference in chemical molecular, and the cancer cells/tissues are the targeted focus positions directly measured by Raman spectroscopy with producing the chemical molecular fingerprint. So the specificity and accuracy of the sensing should be high if the right analysis methods are adopted.
Footnotes
Abbreviations
Declaration of Conflicting Interests
The author(s) declared no potential conflicts of interest with respect to the research, authorship, and/or publication of this article.
Funding
The author(s) disclosed receipt of the following financial support for the research, authorship, and/or publication of this article: This research is supported by Natural Science Foundation of China (NSFC; 61027015, 61177088, and 61107076). And thanks for the support of Key Laboratory of Specialty Fiber Optics and Optical Access Networks (SKLSFO2012-01 and SKLSFO2011-02).