
Abstract
The purpose of this study is to evaluate the differences between dose distributions calculated with the pencil beam (PB) and X-ray voxel Monte Carlo (MC) algorithms for patients with lung cancer using intensity-modulated radiotherapy (IMRT) or HybridArc techniques. The 2 algorithms were compared in terms of dose–volume histograms, under normal and deep inspiration breath hold, and in terms of the tumor control probability (TCP). The dependence of the differences in tumor volume and location was investigated. Dosimetric validation was performed using Gafchromic EBT3 (International Specialty Products, ISP, Wayne, NJ). Forty-five Computed Tomography (CT) data sets were used for this study; 40 Gy at 8 Gy/fraction was prescribed with 5 noncoplanar 6-MV IMRT beams or 3 to 4 dynamic conformal arcs with 3 to 5 IMRT beams distributed per arc. The plans were first calculated with PB and then recalculated with MC. The difference between the mean tumor doses was approximately 10% ± 4%; these differences were even larger under deep inspiration breath hold. Differences between the mean tumor dose correlated with tumor volume and path length of the beams. The TCP values changed from 99.87% ± 0.24% to 96.78% ± 4.81% for both PB- and MC-calculated plans (P = .009). When a fraction of hypoxic cells was considered, the mean TCP values changed from 76.01% ± 5.83% to 34.78% ± 18.06% for the differently calculated plans (P < .0001). When the plans were renormalized to the same mean dose at the tumor, the mean TCP for oxic cells was 99.05% ± 1.59% and for hypoxic cells was 60.20% ± 9.53%. This study confirms that the MC algorithm adequately accounts for inhomogeneities. The inclusion of the MC in the process of IMRT optimization could represent a further step in the complex problem of determining the optimal treatment plan.
Introduction
The widespread use of technologies, allowing for safe delivery of high doses per fraction, combined with the fact that stereotactic hypofractionated radiotherapy for lung cancer has been demonstrated as a promising technique in terms of clinical results, 1 –6 has drawn attention to the importance of accurate heterogeneity correction algorithms for dose calculations. It is well known that calculations performed with the pencil beam (PB) algorithm are reasonably accurate for tumors located in homogeneous regions, but the doses tend to be overestimated when large inhomogeneities are present. Moreover, for intensity-modulated radiation therapy (IMRT), dose calculations can be more complex due to the combined effect of many small fields and the presence of steep fluence gradients. The agreement between measured and calculated doses in the presence of inhomogeneities reaches 15% for the PB algorithm, and under certain circumstances, other algorithms, such as the collapsed cone convolution and the analytical anisotropic algorithm (AAA), may deviate by up to 5%. 7 –10 These discrepancies become even more critical when treatments are delivered under deep inspiration breath hold. 11 The Monte Carlo (MC) algorithm has proved to be the most accurate algorithm for dose calculation; nevertheless, it is often highly time consuming. Recent codes such as the X-ray voxel MC (XVMC) algorithm have allowed for the use of fast and accurate algorithms in clinical practice, which will not only provide confidence in the dose delivered to the tumor but may also diminish the uncertainties regarding the data about the radiation tolerance of the lung. The purpose of this study is to evaluate the differences between dose distributions calculated with the PB and XVMC algorithms implemented in the Iplan (BrainLAB, Feldkirchen, Germany) treatment planning system for a cohort of patients treated for lung cancer with stereotactic body radiotherapy (SBRT) using IMRT and HybridArc (HA) techniques. The algorithms are compared in terms of dose–volume histograms (DVHs), at the tumor and organs at risk (OARs) under normal and deep inspiration breath hold, and in terms of tumor control probability (TCP). The dependence of the observed differences in calculations of tumor volume and location is also investigated. Furthermore, a dosimetric validation using Gafchromic EBT3 was performed in an anthropomorphic phantom.
Materials and Methods
Dose Calculation Algorithm in iPlan RT 5.1
The PB and MC dose calculation algorithms were implemented in the iPlan RT 5.1 treatment planning system. The iPlan RT dose MC algorithm is based on the XVMC algorithm developed by Kawrakow et al and Fippel et al and consists of 3 main components, source modeling, beam collimating system modeling, and patient dose computation. 12,13 The user can select between 2 different precision levels according to the selected multileaf collimator model optimized for accuracy or speed. In both cases, the leaf thickness, the leaf material, and the rounded leaf end design are correctly accounted for, but the speed-optimized version neglects air gaps between leaves and the tongue and groove design. In this study, the final dose calculations were always performed with the accuracy-optimized model.
Patient Population and Treatment Planning
This study used the Computed Tomography (CT) data for 45 patients with lung cancer previously treated using 3-dimensional conformal radiotherapy plans calculated with the AAA implemented in Eclipse v.8.9. Of the 45 patients, 4 had also been scanned under deep inspiration breath hold to plan for a gated radiotherapy. The patients were immobilized using a custom-made cast for CT simulation and treatment. The CT scans were acquired from the larynx to the level of the abdomen, with a thickness of 2 mm. For these 49 CT data set, an IMRT or an HA plan was developed with iPlan to provide 40 Gy at 8 Gy/fraction with 5 noncoplanar 6-MV beams or 3 or 4 dynamic conformal arcs with 3 to 5 IMRT beams distributed per arc (for HA plans). The spatial resolution, which defines the size of the dose calculation grid, was set at 2 mm. The mean variance, which gives the statistical uncertainty of the MC dose calculation, was set at 2%. The dose result type was set at “dose to medium.”
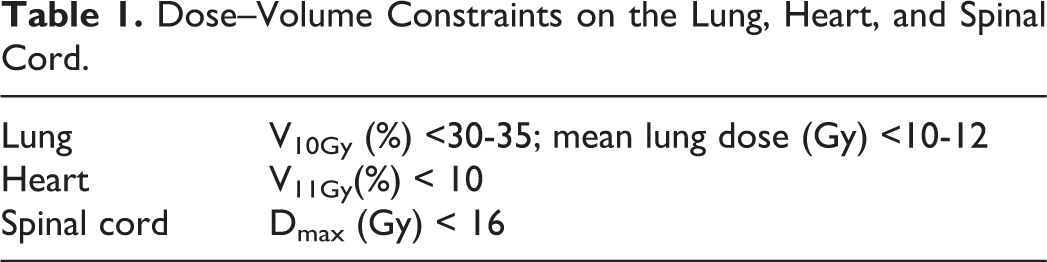
Plans were optimized to give between 95% and 107% of the prescribed dose to the planning target volume (PTV) normalized to the PTV mean dose. The dose–volume constraints on the lung, considering both lungs as one organ, the heart, and the spinal cord were set on the basis of Quantitative Analysis of Normal Tissue Effects in the Clinic (QUANTEC) 14 –16 and reevaluated for the different fractionations according to the isoeffect equation 17 (see Table 1).
Dose–Volume Constraints on the Lung, Heart, and Spinal Cord.
Treatment plans were calculated using the PB algorithm (plan PB). Then, each optimized plan was recalculated with the XVMC algorithm while maintaining the same monitor units (plan MC). Then, the XVMC plans were renormalized to provide the prescribed dose to the tumor (plan MC normalized).
Dosimetry
CT data from an anthropomorphic phantom, RANDO (Thorax region; Radiology Support Devices, Long Beach, CA), were acquired, and a typical IMRT treatment optimization was executed on contours delineated by the physician; dose calculation was then performed with both PB and MC algorithms to obtain 2 different dose distributions. The 2 plans, calculated with different algorithms, were used to irradiate Gafchromic EBT3 film positioned in representative planes in the phantom, and the measured and calculated doses were compared based on the γ index (3 mm/3%). The films had been previously calibrated in a solid water phantom, with doses ranging from 0 to 20 Gy. The film samples were handled in accordance with the recommendations outlined in the customer protocol and in the literature 18 ; they were cut into rectangular pieces to maintain the original sheet orientation and were exposed perpendicularly to the radiation beams. Nonirradiated films were used to determine the zero dose value. The irradiated films were analyzed 48 hours after exposure. A commercial flatbed color scanner, EPSON Expression 10000XL (Epson American, Inc., Long Beach, CA), was used to digitalize the film images in the landscape orientation. 19 To minimize errors, all film pieces were positioned in the same area of the scanner. 20 The EBT3 films were scanned in the transmission of red, green, blue (RGB) color mode, with a scan resolution of 75 dots/in and a color depth of 48-bit RGB (16 bit/channel). The films were analyzed with TA Picodose Pro SW (Tecnologie Avanzate, Torino, Italy), using only the red channel pixel values to obtain gray levels that correlate with the absorbed dose. The dose distributions were exported and compared with the 2 calculated values (PB and MC) using SNC Mapcheck software version 3.01.08.00.
Volume and Path Length Dependence
The dependence of the observed differences in the calculations of tumor volume and location was investigated. Different locations of the tumor inside the lung imply different path lengths. In general, the water equivalent path length is defined as: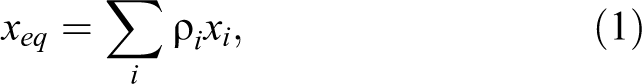
where ρ
i
are the densities of the different tissues encountered and x
i is the physical length of the path in that tissue. The different locations of the tumor were parameterized in terms of the tissue ratio (TR), as defined subsequently: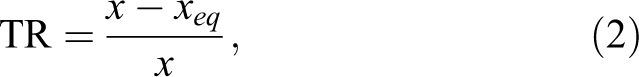
where x is total physical distance.
Hence,
where ρ w is the density of water, ρlung is the density of lung, and xw and x lung are the corresponding geometrical lengths, respectively.
Radiobiology Indicators
To estimate the impact of the observed differences on treatment outcome, the TCP was calculated from DVHs according to the following Poisson formula:
where α and β are radiobiological parameters, 0.35 Gy−1 and 0.035 Gy−2, D is the total dose, 21 d is the dose per fraction, N = ρ × V is the number of clonogenic cells, and ρ the clonogenic cell density, with ρ = 108/cm3 at a reference target and volume V given in cm3.
For any given arbitrary heterogeneous dose distribution 
where η
k
is the fraction volume with
Next, a hypoxia-based model that considers a fraction of hypoxic cells in the tumor and their reoxygenation was used. 22
According to this model, it is assumed that a tumor, with N
0 clonogens at the beginning of radiation treatment, is composed of a hypoxic compartment with N
0η
h
cells and an oxic compartment with N
0(1 − η
h
) cells, where η
h
is the hypoxic fraction. The TCP at the end of treatment is then given by:
where Po
and Ph
are the fractions of oxic and hypoxic cells, respectively, at the end of the treatment. In particular Po
is a function of the surviving fraction after 1 irradiation for oxic clonogens, of the hypoxic fraction η
h, of the clonogenic doubling time T
eff, and of the interfraction time ▵t. Ph
is a function also of the surviving fraction after 1 irradiation for hypoxic clonogens and of B, that is, the fraction of hypoxic cells that undergo the new treatment session as oxic. The surviving fractions are given by:

where
The reoxygenation rate, B, is given by:
where n is the number of fractions, d is the dose per fraction, and C 1 and C 2 are the parameters of the model.
The oxygen enhancement ratio was set to 1.5 and consequently the B was derived using the linear quadratic model. The values of the parameters used in the calculations are given in Table 2, while an extensive explanation of the model is given in the cited article. 22
Parameters and Their Values Used in Calculation.

Statistical Analysis
The dose volumetric data, that is, DVHs and mean doses, were compared using the Mann-Whitney U test and the t test for independent samples. Box-and-whisker plots were used to display a statistical summary of the mean dose values calculated using the PB and MC algorithms. For each box, the central mark is the median, the edges are the 25th and 75th percentiles, and the horizontal lines extend from the minimum to the maximum value. The Pearson correlation coefficient (r) was calculated to evaluate the degree of association between the differences in mean tumor dose calculated with PB and MC algorithms and the tumor volume or the X-ray path of the beams (ie, the TR). If 0 < r < .3, .3< r < .7, or r > .7, the correlation is considered weak, moderate, or strong, respectively. The TCP values were compared using a paired samples t test. A P value < .05 was used to indicate statistical significance. All statistical analyses were performed using MedCalc software, version 11.1.0.0.
Results
Patients’ characteristics are reported in Table 3. The mean lung density ρlung for the patients under normal breathing conditions was 0.286 ± 0.027 g/cm3, while under deep inspiration breath hold the density was 0.215 ± 0.031 g/cm3. As shown in Figure 1, for a typical patient, the PB calculation overestimates the dose inside the target volume, while the DVHs of the OARs show less variation. In Figure 2, the comparison between absolute doses calculated with MC algorithm (left) and measured doses (right) performed using the SNC Mapcheck software is shown, together with the irradiated EBT3.

A, Dose–volume histograms (DVHs) resulting from pencil beam (PB) and Monte Carlo (MC) calculations for a typical patient; the difference is significant for the planning target volume (PTV) but not for the organs at risk (OARs). B, Mean DVHs of all patients from treatment plans calculated with the PB and MC algorithms, mean ρlung = 0.286 ± 0.027 g/cm3. (C) For the 4 patients under deep inspiration breath hold, mean ρlung = 0.215 ± 0.031 g/cm3.

A, Comparison between absolute doses calculated with Monte Carlo algorithm (left) and measured doses (right) performed with SNC Mapcheck software (Sun Nuclear Corporation, Melbourne, FL). B, Irradiated EBT3.
The PTV and OAR Volumes of the 45 Patients Investigated.

Abbreviations: OAR, organs at risk; PTV, planning target volume; std dev, standard deviation.
The agreement in terms of the absolute γ function (γ < 1, 3%, 3 mm) was approximately 94% for the MC algorithm and 67% for the PB algorithm. The mean tumor doses calculated using the PB algorithm were approximately 10% ± 4% and 19% ± 5%, which are higher than those calculated using the MC algorithm under normal breathing and breath hold conditions, respectively. These differences are significant, as shown in Figure 3, while the differences between the doses and the significant volumes of OARs were generally smaller.

Box-and-whisker plots of the mean tumor doses for 40 treatment plans calculated with the pencil beam (PB) and Monte Carlo (MC) algorithms (A) and for 4 patients under deep inspiration breath hold (B).
Figure 4 shows the results obtained when the plans were renormalized to have the same mean dose at the PTV. The DVHs obtained with the MC-based calculation differ in shape from that of the original histogram because the calculated dose distribution is less homogeneous, thus producing a less steep DVH.

Comparison between the dose–volume histograms (DVHs) obtained with the pencil beam (PB) and renormalized Monte Carlo (MC; MC-normalized) calculations with the same mean dose at the planning target volume (PTV): it can be noted that the shapes are different.
In Figure 5, DVHs are shown for a small and a large tumor volume. In this case, the differences in the DVHs are inversely proportional to the size of the PTV. In fact, as shown in Figure 6, the percentage deviation between the mean tumor doses calculated with PB, Dmean PB, and MC, Dmean MC shows a statistically significant correlation, though moderate, with tumor volume and TR, that is, r = −.3652 (P = .0013) and r = .5116 (P = .0003), respectively.

A comparison of dose–volume histograms (DVHs) for the 2 plans (pencil beam [PB] and Monte Carlo [MC]) calculated for patients with a planning target volume (PTV) of 9.39 cm3 (A) and 550.34 cm3 (B).
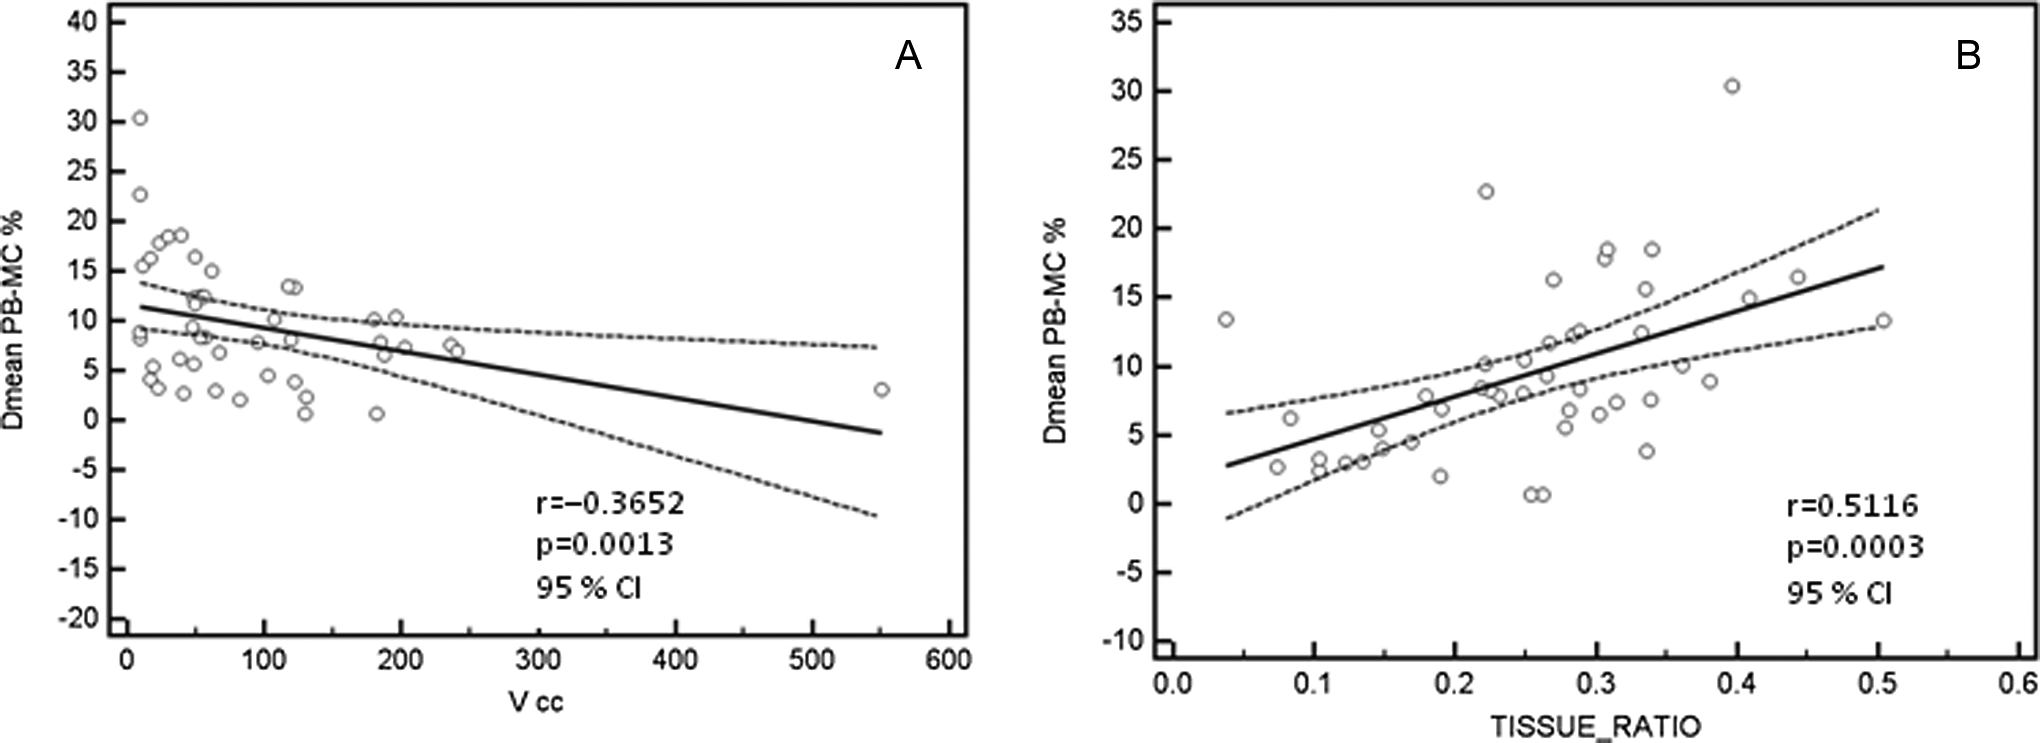
Scatter plots of the percentage difference between Dmean pencil beam (PB) and Dmean Monte Carlo (MC) versus tumor volume (A) and X-ray path of the beams (tissue ratio; B). The P values for the Pearson correlation tests are indicated for each plot. The best linear polynomial fit was depicted.
Finally, the TCP was calculated for a homogeneous population of oxic clonogenic cells inside the tumor (TCP_oxic) and for a fraction of hypoxic cells (TCP_hypoxic). While the normal tissue complication probability of OARs does not vary significantly, the mean TCP_oxic values change from 99.87% ± 0.24% to 96.78% ± 4.81% both for the PB- and MC-calculated plans, (P = .009). When η h was set to .15, thus considering a fraction of hypoxic cells, the mean TCP_hypoxic values changed from 76.01% ± 5.83% to 34.78% ± 18.06% for both the PB- and MC-calculated plans (P < .0001). Nevertheless, when the plans were renormalized to have the same mean dose at the PTV, the mean TCP_oxic_norm was 99.05% ± 1.59% and the mean TCP_ hypoxic_norm was 60.20% ± 9.53%. Both renormalized values are closer to the PB-calculated value, but the differences are still statistically significant, with P = .0304 and P < .0001, respectively (Figure 7).

Box-and-whisker plots of tumor control probability (TCP) values obtained while considering all oxic cells, TCP_oxic, and while considering a fraction of hypoxic cells, ηh = 0.15, TCP_hypoxic.
Discussion
In this study, SBRT IMRT treatment plans optimized for patients with lung cancer using the PB algorithm were recalculated with the MC algorithm to investigate the differences between the obtained dose distributions. Our dosimetric results confirm that the XVMC algorithm implemented in iPlan can accurately calculate the dose under conditions of low density and small fields (IMRT) as reported by other studies. 23 –25 It is known that the PB algorithm fails to calculate the correct dose when the tissue density varies significantly from the density of water and thus the range of lateral electrons is increased. This effect is intensified under deep inspiration breath hold conditions, where the lung density can be as low 11 as 0.16 g/cm3. In our experience, the mean lung density under deep inspiration breath hold conditions was higher, with a mean value of 0.215 ± 0.031 g/cm−3, most likely because our patients were affected by lung cancer and presented a restricted pulmonary capacity compared to the patients with breast cancer described in the previously cited article. Nevertheless, the difference in dose calculation was statistically significant for the PTV, and lower lung densities produced the largest difference between the DVHs. Moreover, at the interface between the lung and the tumor, the dose “build down” effect causes a dose reduction at the border of the tumor, resulting in dose heterogeneity inside the PTV. 26 In fact, as shown in Figure 4, renormalizing the dose to have the same mean dose at the target does not compensate for the differences in the DVHs. Furthermore, the plan for a PTV of 550 cm3 showed better agreement between the MC and the PB calculations than the plan for a PTV of 9 cm3. Moreover, as can be seen in Figure 3, the mean doses calculated with the MC algorithm are more sparsely distributed with respect to those calculated with the PB algorithm. In fact, the MC calculation diversifies the radiological paths of the beams within different tissues, hence the calculated dose distribution depends on PTV location inside the lung and on the ratio between the PTV and the lung volumes. The inverse correlation between the difference in mean dose and the PTV is illustrated in Figure 6A and also suggests that the field size strongly influences the impact of electron scattering on the dose to the target. This result is not surprising, given the physical processes leading to electronic disequilibrium. In addition, the significant direct correlation with TR, shown in Figure 6B, shows the ability of MC calculations to discriminate between different radiological paths. These phenomena are directly reflected by the TCP, although the mean TCP_oxic changes from 99.87% to 96.78% for the PB and MC calculations. The standard deviation for the 2 distributions changes from 0.24% to 4.81%, indicating that the dose distribution calculated with the PB algorithm is altered after the MC calculation depending on the PTV and location. This effect is enhanced when TCP_hypoxic is calculated because, when a fraction of hypoxic, more resistant cells is considered, the TCP calculation becomes more sensitive to those areas of the PTV that are underdosed, independent of the absolute values obtained for the set of parameters used. One limitation of this study is the fact that the plans were optimized with the PB approach and were only recalculated with the MC algorithm. Altman et al 27 proposed some practical methods to “truly optimize in situations where PB works poorly”; nevertheless, the inclusion of MC calculations in the process of optimization, allowing the process to be driven according to the obtained dose distribution, could surely lead to a superior plan quality.
Conclusions
The results of this study show that the PB calculation overestimates the dose with respect to the XVMC algorithm for points inside the tumor. In each case, major discrepancies were observed along the boundary between the tissue and the air, leading to a dramatic failure in the probability of controlling the tumor, especially when models considering more aggressive subvolumes inside the tumor are used. Monte Carlo algorithms are becoming more frequently available in commercial TPS, and their employment should be encouraged to accurately calculate doses in the presence of inhomogeneities, especially when delivering high doses per fraction. However, the introduction of MC calculation in the process of IMRT optimization is still lacking, and the PB-based optimized plan may give suboptimal results. For this reason, efforts should be made to find methods for driving the optimization process according to the dose calculated with the MC algorithm to obtain the best possible results.
Footnotes
Abbreviations
Acknowledgments
The authors wish to thank Elio Mansueto, Brainlab engineer, for technical and logistical support, and Mrs Tania Merlino for the English revision.
Declaration of Conflicting Interests
The author(s) declared no potential conflicts of interest with respect to the research, authorship, and/or publication of this article.
Funding
The author(s) received no financial support for the research, authorship, and/or publication of this article.